

Ketogenic HMG-CoA lyase and its product β-hydroxybutyrate promote pancreatic cancer progression
- PMID: 35307861
- PMCID: PMC9058543
- DOI: 10.15252/embj.2021110466
Ketogenic HMG-CoA lyase and its product β-hydroxybutyrate promote pancreatic cancer progression
Abstract
Pancreatic ductal adenocarcinoma (PDA) tumor cells are deprived of oxygen and nutrients and therefore must adapt their metabolism to ensure proliferation. In some physiological states, cells rely on ketone bodies to satisfy their metabolic needs, especially during nutrient stress. Here, we show that PDA cells can activate ketone body metabolism and that β-hydroxybutyrate (βOHB) is an alternative cell-intrinsic or systemic fuel that can promote PDA growth and progression. PDA cells activate enzymes required for ketogenesis, utilizing various nutrients as carbon sources for ketone body formation. By assessing metabolic gene expression from spontaneously arising PDA tumors in mice, we find HMG-CoA lyase (HMGCL), involved in ketogenesis, to be among the most deregulated metabolic enzymes in PDA compared to normal pancreas. In vitro depletion of HMGCL impedes migration, tumor cell invasiveness, and anchorage-independent tumor sphere compaction. Moreover, disrupting HMGCL drastically decreases PDA tumor growth in vivo, while βOHB stimulates metastatic dissemination to the liver. These findings suggest that βOHB increases PDA aggressiveness and identify HMGCL and ketogenesis as metabolic targets for limiting PDA progression.
Keywords: HMGCL; ketone bodies; metastasis; pancreatic cancer; β-hydroxybutyrate.
© 2022 The Authors.
Figures

- A
Tumor weight in KIC mice treated with βOHB (100 mg/kg/day, i.p.) or 0.9% NaCl (i.p.) (n = 13 mice for NaCl and n = 15 mice for βOHB). Data are expressed as mean ± SEM. Significance was defined by Mann‐Whitney test. *P < 0.05.
- B
Kinetic of spheroid area from PK4a cells cultured during 12 days in medium alone (untreated) or with βOHB 1 or 10 mM (n = 4, and 5 respectively). Data are expressed as mean ± SEM. Significance compared to untreated cells was defined by two‐way ANOVA followed by a Dunnett’s multiple comparisons test. **P < 0.01, ****P < 0.0001.
- C
Representative images of mouse PDA and human PDA primary cells‐derived organoids after 7 days of culture in medium alone (untreated) or supplemented with 1 or 10 mM of βOHB. Scale bar: 1000 µm.
- D, E
Immunostaining of MCT2 and SMCT1 in tumors of KIC mice treated with βOHB (100 mg/kg/day, i.p.) or 0.9% NaCl (i.p.) (n = 5 mice/group). Areas of MCT2 (upper panel) and SMCT1 (lower panel) stainings (D) are expressed as mean of percentage of total tissue area ± SEM. Significance was defined by Mann–Whitney test. *P < 0.05, **P < 0.01. Representative images of MCT2 and SMCT1 stainings (E) in tumors from KIC mice treated with βOHB or NaCl. Scale bar: 100 µm.
- F
Histological characterization of liver and spleen of KIC mice treated with βOHB (100 mg/kg/day, i.p.) or 0.9% NaCl (i.p.) (n = 14 mice/group). Number of mice displaying metastatic liver or spleen in each experimental group is reported.
- G
Schematic showing isotopomer transition from [U‐13C]βOHB to label TCA‐cycle intermediates, glutamate, and proline. Gray filled circles indicate 13C carbon derived from labeled βOHB. Empty circles illustrate unlabeled 12C‐species.
- H
[U‐13C]βOHB tracing into the TCA intermediate: citrate in poorly differentiated PDA explants from KIC mice (n = 5). Data are expressed as mean ± SEM.
- I
Schematic showing ketone metabolism pathway (left panel). Reversible enzymes involved in the production of acetyl‐CoA, acetoacetyl‐CoA, acetoacetate, βOHB, mT, SCOT1/2, and BDH1/2 are indicated in bold case. Immunoblots of ketone metabolic enzymes (BDH1/2, SCOT1/2, mT) (right panel) in pancreatic tissues from 7‐week‐old KI (n = 3 for BDH1/2, SCOT1/2, and n = 4 for mT) and KIC mice (n = 4).

Ki67 immunostaining in tumors of KIC mice treated with βOHB (100 mg/kg/day, i.p.) or 0.9% NaCl (i.p.) (n = 13 mice for NaCl and n = 15 mice for βOHB). Data are expressed as mean of percentage of total tissue area ± SEM. Significance was defined by Mann‐Whitney test. ***P < 0.001 (left panel). Representative images of Ki67 staining in pancreatic tumors from treated KIC mice. Scale bar: 100 µm (right panel).
Histological characterization of tumors from KIC mice treated with βOHB or 0.9% NaCl. Number of mice with a glandular + undifferentiated (U) or undifferentiated tumors in each experimental group is reported.
[U‐13C]βOHB tracing into TCA intermediates: citrate, α‐ketoglutarate (α‐KG), succinate, malate and into glutamate and proline in PK4A cells cultured in indicated glucose concentrations. Data are expressed as mean ± SEM (n = 3 technical replicates). Significance was defined by one‐way ANOVA followed by a Bonferroni’s multiple comparisons test. ns: not significant, ***P < 0.001, and mentioned for 0 mM glucose condition compared to other conditions of culture.
[U‐13C]βOHB tracing into TCA intermediates: αKG, succinate, malate and into glutamate and proline in poorly differentiated PDA explants from KIC mice (n = 5). Data are expressed as mean ± SEM. Source data for this figure can be found in source data Fig 1H.
Immunochemistry of the ketone metabolic enzymes, BDH1/2 and SCOT1/2, in pancreatic tumors sections from 9‐week‐old KIC mice. Tumor glands (yellow stars) and poorly differentiated cancer cells disseminated into the stroma (blue crosses) are indicated. Representative images and their relative insets from n = 3 KIC mice are illustrated. Scale bar: 100 µm.

- A
Schematic showing isotopomer transition from [U‐13C]Glucose, [U‐13C]Glutamine, [U‐13C]Acetate, or [U‐13C]Leucine to label TCA‐cycle intermediates, glutamate, and proline. Red, violet, gray, and blue filled circles indicate 13C carbon derived from labeled glucose, glutamine, acetate and leucine, respectively. Empty circles denote 12C‐species.
- B–D
[U‐13C]Glucose (n = 3 mice) (B), [U‐13C]Glutamine (n = 5 mice) (C) and [U‐13C]Acetate (n = 6 mice) (D) tracing into βOHB in poorly differentiated PDA explants from KIC mice. Data are expressed as mean ± SEM.
- E, F
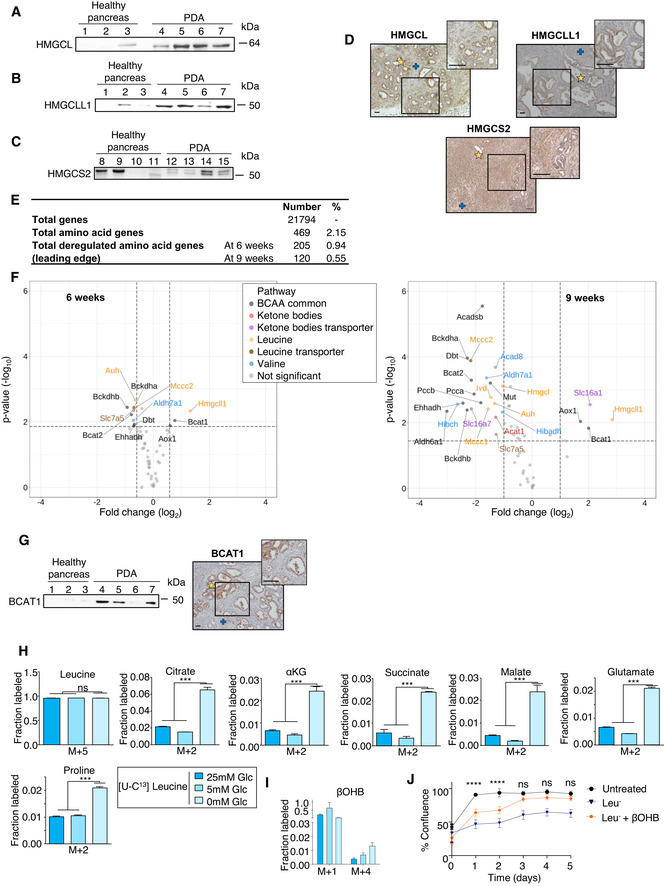
Percentages of leading‐edges amino acid genes in 6 weeks (E) or 9 weeks (F) KIC mice as compared to age‐matched KI mice that contribute to the GSEA enrichment. Red spots represent the P‐value of the deregulated amino acid pathways in KIC mice as compared to KI mice. Red line corresponds to a P‐value of 0.05.
- A–C
Immunoblots of HMGCL (A), HMGCLL1 (B) and HMGCS2 (C) in pancreatic tissues from 7‐week‐old KI (n = 3 for HMGCL, HMGCLL1 and n = 4 for HMGCS2) and KIC mice (n = 4).
- D
Immunochemistry of KB enzymes, HMGCL, HMGCLL1 and HMGCS2 in pancreatic tumors sections from 9‐week‐old KIC mice. Tumor glands (yellow stars) and poorly differentiated cancer cells disseminated into the stroma (blue crosses) are indicated. Representative images and their relative insets from n = 3 KIC mice are illustrated. Scale bar: 100 µm.
- E
Number and percentage of amino acid genes analyzed by GSEA in KIC tumor bearing mice as well as the number and percentage of amino acid related‐genes involved in significant gene sets (P < 0.05) in PDA from KIC mice at 6 or 9 weeks of age (n = 8 and 3 mice respectively) as compared to control pancreas from age‐matched KI mice (n = 5 and 3 mice respectively).
- F
Volcano plot illustrating BCAA and KB genes differentially and significantly expressed in 9‐week‐old (adjusted P‐value < 0.05; absolute fold change > 2) or 6‐week‐old (adjusted P‐value < 0.05; absolute fold change > 1.5) KIC mice as compared to age‐matched KI mice. The vertical dashed lines represent the fold change cutoff thresholds. The horizontal dashed lines represent the selection cutoff based on the adjusted P‐value cutoff threshold of 0.05.
- G
Immunoblot (left) of BCAT1 in pancreatic tissues from 7‐week‐old KI (n = 3) and KIC mice (n = 4) and immunochemistry (right) of BCAT1 in pancreatic tumors sections from 9‐week‐old KIC mice. Tumor glands (yellow star) and poorly differentiated cancer cells disseminated into the stroma (blue cross) are indicated. Representative images and their relative insets from n = 3 KIC mice are illustrated. Scale bars: 100 µm.
- H, I
[U‐13C]Leucine tracing into TCA intermediates: citrate, αKG, succinate, malate, into glutamate and proline (H) and into βOHB (I) in PK4A cells cultured in indicated glucose concentrations. Data are expressed as mean ± SEM (n = 3 technical replicates). Significance was defined by one‐way ANOVA followed by a Bonferroni’s multiple comparisons test. ns: not significant, ***P < 0.001, and mentioned for 0 mM glucose condition compared to other conditions of culture.
- J
Real time viability of PK4a cells cultured during 5 days in untreated medium or in leucine‐depleted media (Leu‐) alone or supplemented with βOHB (n = 4/condition). Data are expressed as mean ± SEM. Significance was defined by two‐way ANOVA followed by a Dunnett’s multiple comparisons test. ns: not‐significant, ****P < 0.0001, and only mentioned for untreated medium compared to Leu− + βOHB.
- A
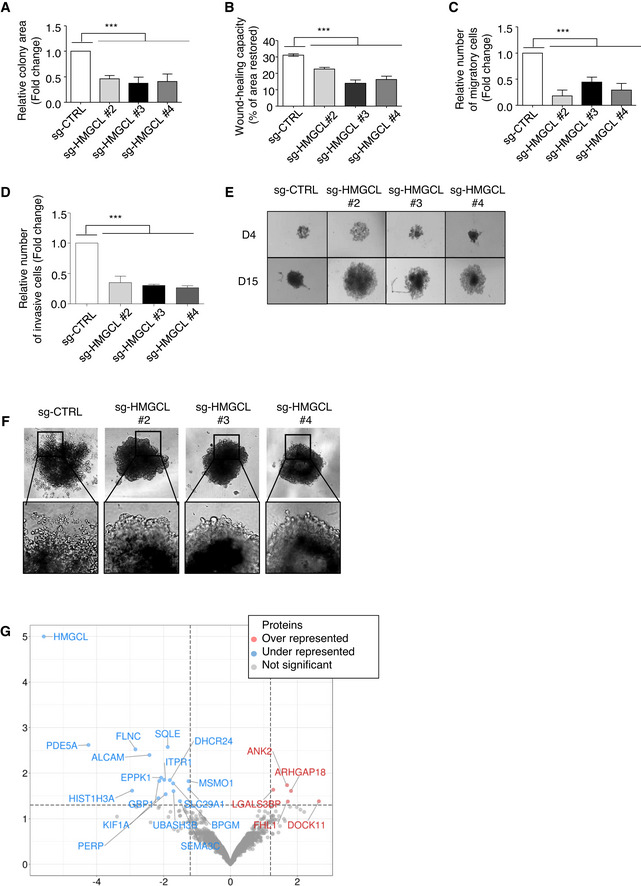
Quantification of colony forming area of sg‐CTRL and sg‐HMGCL (#2, #3 and #4 clones) PANC‐1 cells. Colony area is expressed as mean fold change relative to sg‐CTRL ± SEM (n = 3 independent experiments). Significance was defined by one‐tailed Student’s t‐test. ***P < 0.001.
- B
Quantification of wound healing capacity of sg‐CTRL and sg‐HMGCL (#2, #3 and #4 clones) PANC‐1 cells. Wound healing capacity is expressed as mean of percentage of restored area at 72 h ± SEM (n = 4 independent experiments). Significance was defined by one‐tailed Student’s t test. ***P < 0.001.
- C, D
Quantification of migratory (C) and invasive (D) sg‐CTRL and sg‐HMGCL (#2, #3 and #4 clones) PANC‐1 cells. Migratory or invasive cell numbers are expressed as mean fold change relative to sg‐CTRL cells ± SEM (n = 3 independent experiments). Significance was defined by one‐tailed Student’s t test. ***P < 0.001.
- E
Representative images of spheroid formation from sg‐CTRL and sg‐HMGCL (#2, #3 and #4 clones) PANC‐1 cells after 4 or 15 days of culture. Photos are representative of n = 3 independent experiments.
- F
Representative images of spheroid invasion assay from sg‐CTRL and sg‐HMGCL (#2, #3 and #4 clones) PANC‐1 cells after 10 days of culture in presence of Matrigel. Photos are representative of n = 3 independent experiments.
- G
Volcano plot illustrating proteins significantly under‐ or over‐represented in sg‐CTRL and sg‐HMGCL PANC‐1 spheroids (n = 3 independent experiments). Significance was defined by one‐tailed Student’s t‐test. Protein levels with a q‐value < 0.05 (horizontal axis) and a fold change < −1.5 or > +1.5 (vertical axis) are considered as significantly down or up‐regulated in sg‐HMGCL PANC‐1 spheroids.
- A
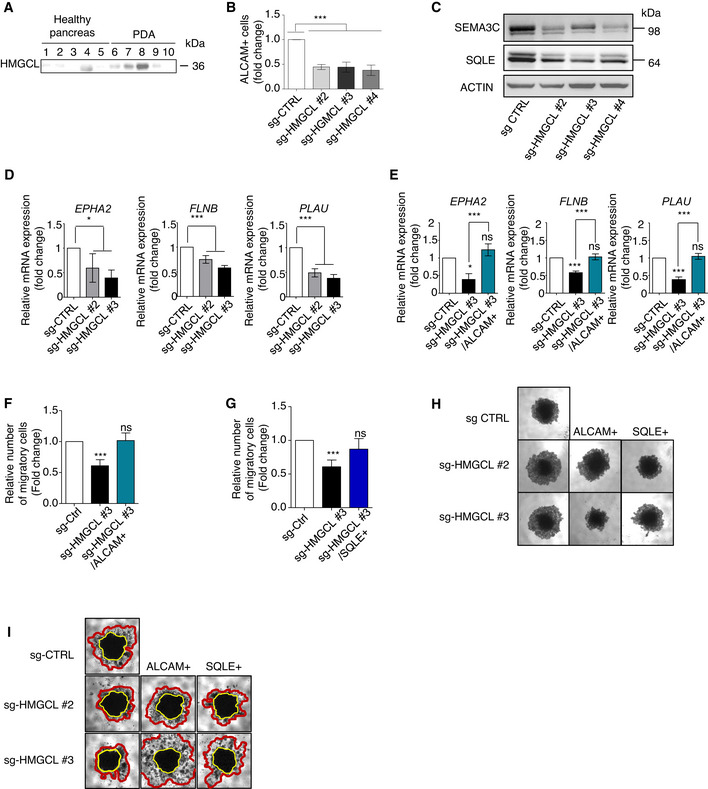
Immunoblots of HMGCL in healthy pancreatic tissue (n = 5) and PDA (n = 5) from PDA patients.
- B
Quantification by flow‐cytometry of protein levels of ALCAM in sg‐CTRL and sg‐HMGCL #2, #3 and #4 PANC‐1 spheroids. ALCAM positive cells are expressed as mean fold change relative to sg‐CTRL ± SEM (n = 3 independent experiments). Significance was defined by one‐tailed Student’s t‐test. ***P < 0.001.
- C
Immunoblots for SEMA3C, SQLE and ACTIN proteins in sg‐CTRL and sg‐HMGCL #2, #3 and #4 PANC‐1 spheroids (Photos are representative of n = 3 independent experiments).
- D
Relative mRNA expression of ALCAM target transcripts: EPHA2, FLNB, PLAU in sg‐CTRL and sg‐HMGCL (#2 and #3) PANC‐1 cells. Relative expressions are expressed as mean fold change relative to sg‐CTRL ± SEM (n = 3 independent experiments). Significance was defined by one‐tailed Student’s t test. *P < 0.05, ***P < 0.001.
- E
Relative mRNA expression of ALCAM target transcripts: EPHA2, FLNB, PLAU in sg‐CTRL, sg‐HMGCL (#3 clone) and sg‐HMGCL/ALCAM+ (#3 clone) PANC‐1 cells. Relative expressions are expressed as mean fold change relative to sg‐CTRL ± SEM (n = 3 independent experiments). Significance was defined by one‐way ANOVA followed by a Bonferroni’s multiple comparisons test. *P < 0.05, ***P < 0.001, ns: not significant.
- F, G
Quantification of migratory sg‐CTRL, sg‐HMGCL, and sg‐HMGCL overexpressing ALCAM (F) or SQLE (G) PANC‐1 cells. Migratory cell numbers are expressed as mean fold change relative to sg‐CTRL cells ± SEM (n = 3 independent experiments). Significance was defined by one‐tailed Student’s t test. ***P < 0.001, ns: not significant.
- H
Representative images at day 15 of sg‐CTRL and sg‐HMGCL #2 and #3 PANC‐1 spheroids stably over‐expressing ALCAM (ALCAM+) or SQLE (SQLE+) protein. (Photos are representative of n = 3 independent experiments).
- I
Representative images of spheroid invasion assays of sg‐CTRL and sg‐HMGCL #2 and #3 PANC‐1 cells stably over‐expressing ALCAM (ALCAM+) or SQLE (SQLE+) protein, after 10 days of culture with Matrigel (n = 3 independent experiments). Compact cores of spheroids are surrounded by yellow lines. Invaded areas are surrounded by red lines.
- A, B
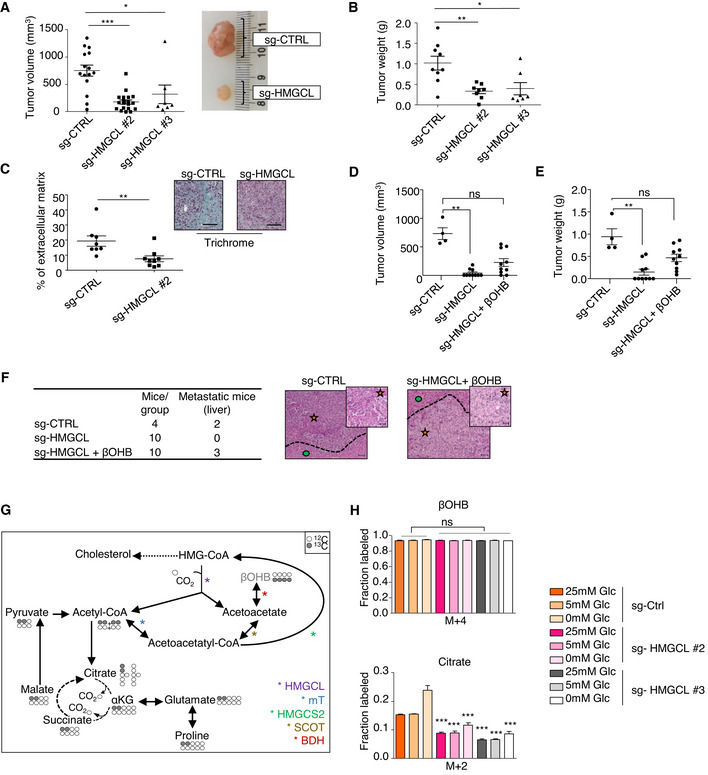
Quantification of volume with representative images (A) and weight (B) of sg‐CTRL (n = 15 for A and n = 9 for B), sg HMGCL #2 (n = 19 for A and n = 8 for B), #3 (n = 7 for A and B) pancreatic tumors. Data are expressed as mean of tumor volume or weight ± SEM. Significance was defined by Mann–Whitney test. *P < 0.05, **P < 0.01, ***P < 0.001.
- C
Extracellular matrix quantification following trichrome staining in sg‐CTRL and sg‐HMGCL #2 pancreatic tumors sections (n = 8 and 9 mice/group respectively, left panel). Data are expressed as mean of percentage of total tissue area ± SEM. Significance was defined by Mann–Whitney test. **P < 0.01. Representative images of trichrome staining in sg‐CTRL and sg‐HMGCL pancreatic tumors. Scale bar: 100 µm (right panel).
- D, E
Quantification of volume (D) and weight (E) of sg‐CTRL pancreatic tumors treated with 0.9% NaCl (i.p.) (n = 4), and pancreatic tumors from two different clones of sg‐HMGCL treated with 0.9% NaCl (i.p.) or βOHB (100 mg/kg/bi‐weekly, i.p.) (n = 10/group). Data are expressed as mean of tumor volume or weight ± SEM. Significance was defined by Mann–Whitney test. ns: not significant, **P < 0.01.
- F
Histological characterization and representative picture of liver from mice orthotopically xenografted with sg‐CTRL or sg‐HMGCL PANC‐1 cells and treated with 0.9% NaCl (i.p.) or βOHB (100 mg/kg/bi‐weekly, i.p.). Number of mice displaying healthy or metastatic liver in each experimental group is reported. Metastatic area (orange star) is separated from liver (green circle) by dotted lines. Scale bar: 100 µm (inset images scale bar: 20 µm).
- G
Schematic showing isotopomer transition from [U‐13C]βOHB to label TCA‐cycle intermediates, glutamate, and proline. Gray filled circles indicate 13C carbon derived from labeled βOHB. Empty circles illustrate unlabeled 12C‐species.
- H
[U‐13C]βOHB tracing into TCA intermediate: citrate in sg‐CTRL and sg‐HMGCL #2 and #3 PANC‐1 cells cultured in indicated glucose concentrations. Data are expressed as mean ± SEM (n = 2 independent experiments). Significance was defined by one‐way ANOVA followed by a Bonferroni’s multiple comparisons test, only significances between sg‐HMGCL #2, #3 PANC‐1 cells and sg‐CTRL PANC‐1 cells under the same culture condition are mentioned. ***P < 0.001.
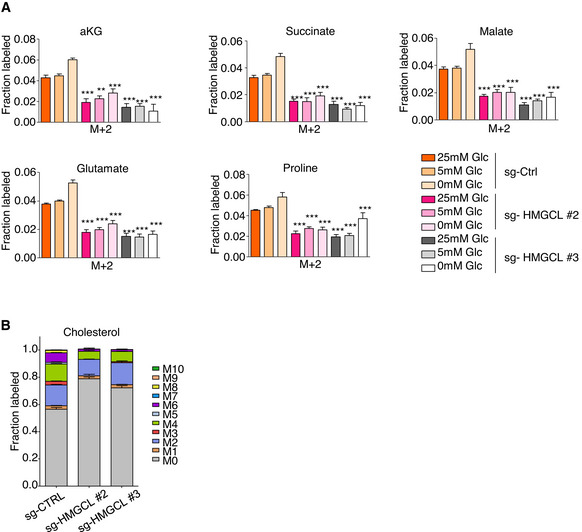
[U‐13C]βOHB tracing into TCA intermediates: αKG, succinate, malate and into glutamate and proline in sg‐CTRL and sg‐HMGCL #2 and #3 PANC‐1 cells cultured in indicated glucose concentrations. Significance was defined by one‐way ANOVA followed by a Bonferroni’s multiple comparisons test, only significances between sg‐HMGCL #2, #3 PANC‐1 cells and sg‐CTRL PANC‐1 cells under the same culture condition are mentioned (n = 2 independent experiments). **P < 0.01, ***P < 0.001. Source data for this figure can be found in source data Fig 4H.
[U‐13C]βOHB tracing into cholesterol in sg‐CTRL and sg‐HMGCL #2 and #3 PANC‐1 cells when cultured in 5 mM glucose medium (n = 3 technical replicates).

- A
Human ALU sequences quantification in lower chorioallantoic membrane (CAM) of chicken embryo injected with sg‐CTRL or sg‐HMGCL #2 PANC‐1 cells. Relative amount of metastasis is expressed as mean fold change relative to sg‐CTRL ± SEM (n = 8/group). Significance was defined by one‐tailed Student’s t‐test. *P < 0.05.
- B
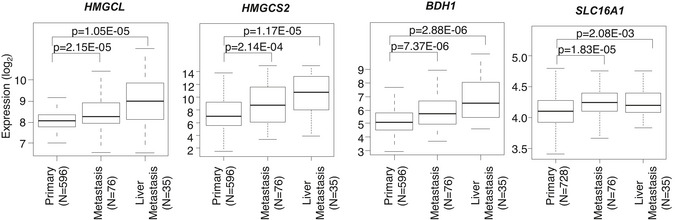
Box‐and‐whisker plots of ketone bodies (KB) metagene score defined as first component of PCA of genes in primary tumors (n = 728), in all metastases (n = 76), and in liver metastases specifically (n = 35). Box‐and‐whisker plot were defined with default parameters by median value (central band at the 50th percentile), interquartile ranges (IQR, box limited by 25th and 75th percentile) and whisker boundaries defined at 1.5× IQR. Significance was defined by Student’s t‐test.
- C
Representative immunostaining of SMCT1 and MCT2 in metastatic livers of KIC mice (n = 3 mice). Metastatic area (orange star) is separated from liver (green circle) by dotted lines. Scale bar: 100 µm.
- D–F
Effect of βOHB treatment on liver metastatic incidence, size and status. Representative HPS staining of liver lobes from metastatic mice treated with βOHB (100 mg/kg/day, i.p.) or 0.9% NaCl (i.p.) (n = 8 mice/group). Metastatic areas are separated from liver by yellow dotted lines. Scale bar: 1 mm and 500 µm for insets (D). Number and size of metastasis per lobe and classified in small, medium, and large size (E). Pathological status of metastasis from mice treated with βOHB or NaCl (n = 13 or 5 lobes/group, respectively). Data are expressed as percentage of total metastasis in all liver lobes presenting metastasis (F).
- G
Representative images of mouse and human liver metastatic cells‐derived organoids after 7 days of culture in medium alone (untreated) or supplemented with 1 or 10 mM of βOHB. Scale bar: 1,000 µm.
- H
Working model: HMGCL and βOHB promote pancreatic tumor expansion and dissemination. PDA tumor cells expressed HMGCL (left panel). In this setting, PDA can use βOHB from direct source as tumor surrounding βOHB, mimicked in our study by direct injection of βOHB, and indirect source from degradation of various nutrients. βOHB and HMGCL contribute to tumor growth and metastases formation. In metastases, ketone bodies genes are upregulated. When HMGCL is knock‐out (right panel), contribution of βOHB in TCA cycle is reduced and tumor growth as well as dissemination capacity of PDA tumor cells are strongly disturbed.
References
-
- Bagci T, Wu JK, Pfannl R, Ilag LL, Jay DG (2009) Autocrine semaphorin 3A signaling promotes glioblastoma dispersal. Oncogene 28: 3537–3550 - PubMed
Publication types
MeSH terms
Substances
Associated data
- Actions
- Actions
Grants and funding
LinkOut - more resources
Full Text Sources
Medical
Molecular Biology Databases
