. 2022 Mar 3:13:824052.
doi: 10.3389/fmicb.2022.824052. eCollection 2022.

High Affinity Iron Acquisition Systems Facilitate but Are Not Essential for Colonization of Chickens by Salmonella Enteritidis

Affiliations

High Affinity Iron Acquisition Systems Facilitate but Are Not Essential for Colonization of Chickens by Salmonella Enteritidis

Dinesh H Wellawa et al. Front Microbiol. .

Abstract

The roles of TonB mediated Fe3+ (ferric iron) uptake via enterobactin (involving biosynthesis genes entABCDEF) and Fe2+ (ferrous iron) uptake through the FeoABC transporter are poorly defined in the context of chicken-Salmonella interactions. Both uptake systems are believed to be the major contributors of iron supply in the Salmonella life cycle. Current evidence suggests that these iron uptake systems play a major role in pathogenesis in mammals and as such, they represent promising antibacterial targets with therapeutic potential. We investigated the role of these iron uptake mechanisms regarding the ability of Salmonella Enteritidis (SEn) strains to colonize in a chicken infection model. Further we constructed a bioluminescent reporter to sense iron limitation during gastrointestinal colonization of Salmonella in chicken via ex vivo imaging. Our data indicated that there is some redundancy between the ferric and ferrous iron uptake mechanisms regarding iron acquisition during SEn pathogenesis in chicken. We believe that this redundancy of iron acquisition in the host reservoir may be the consequence of adaptation to unique avian environments, and thus warrants further investigation. To our knowledge, this the first report providing direct evidence that both enterobactin synthesis and FeoABC mediated iron uptake contribute to the virulence of SEn in chickens.

Keywords: FeoABC transporter; Salmonella; chicken; enterobactin; iron uptake.


Conflict of interest statement

The authors declare that the research was conducted in the absence of any commercial or financial relationships that could be construed as a potential conflict of interest.

Figures
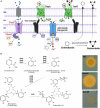
FIGURE 1
FIGURE 1
(A) Ferrous iron and catecholate siderophore chelated ferric iron uptake via high affinity acquisition systems in Salmonella. OM, outer membrane; PP, periplasm; IM, inner membrane. Ton complex components (TonB-ExbB-ExbD) transduce the proton motive force from the inner membrane to outer membrane receptors to translocate the ferric-siderophore into the PP. FepB is the periplasmic binding protein to shuttle siderophores via ABC family transporter (FecC, FecD, FecE) into the cytoplasm. Fes (ferric enterochelin esterase) hydrolyzes the catecholate siderophore to release Fe3+. Not shown components involved in the transport of hydroxamate type ferric-siderophores and iron-dicitrate. (B) Siderophore biosynthesis in key steps. Enzymes involved in enterobactin synthesis are encoded by entCEBA operon and entF transcribed separately. IroB represents a glucosyltransferase. Detection of siderophore production using chrome azurol S agar plate is shown on the right side. Five μL of overnight cultures were spotted onto the agar plate and incubated at 37°C overnight. A yellow halo is indicative of siderophore mediated ferric iron chelation. WT, wild type (LS101 SEn).
FIGURE 2
FIGURE 2
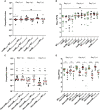
(A,C) competitive index scores; mutant vswildtype in cecal tissue. A; ΔentB vs wildtype strain, C; ΔfeoΔentB vs wildtype strain. Each symbol represents a CI value per bird (12–14 commercial broilers/group) calculated based upon bacteria recovered from cecal content as presented in figure B and D respectively. Median value of the data is given by the horizontal bar. Dotted horizontal line is the CI value of 1 which indicates that the mutant is equally competitive as the wildtype strain. ***P1, ***P2 = 0.0002, ***P3 = 0.0001, **P4 = 0.0034, ***P5 = 0.0002, ***P6 = 0.0001. (B,D) Bacterial load in the cecal content. Each symbol represents a colony count of a particular bird, and each bird has a matching pair of wildtype and mutant colony counts due to the co-infection. The detection limit of Salmonella colonies in the brilliant green agar plate is around 100 CFU/g. Mean differences were calculated by appropriate statistical test. ns; no significance. *p = 0.0142, ****p ≤ 0.0001.
FIGURE 3
FIGURE 3
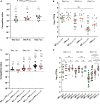
(A) Competitive index scores; ΔfeoABC with chloramphenicol resistant marker (ΔfeoCmR) vs. bioluminescent wildtype SEn strain in cecal tissue. Thirteen broilers/group. Each symbol represents CI value obtained from a bird. **P1 = 0.0081, ***P2 = 0.0002, **P3 = 0.0012. (B,D) Bacterial load in the cecal content. Each symbol represents a colony count of a particular bird, for each strain. Mean differences were analyzed using appropriate statistic test. ns, not significant. (C) Competitive indexes for non-bioluminescent strain vs. bioluminescent strain. ***P1 = 0.001, **P2 = 0.0034, ***P3, ***P4 = 0.0005, ****P5, ****P6 ≤ 0.0001.
FIGURE 4
FIGURE 4
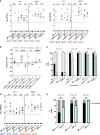
(A) Wildtype or ΔentB burden in liver and spleen by direct plating. Each symbol represents a log10 CFU value related to a mutant or wildtype strain. Due to co-infection each bird (12–14 birds per time point) has two matching pair values of CFU not shown in here. Median value of the data set shown by horizontal bar. Detection limit has shown by dotted horizontal line (50 CFU/g). Mean differences were accounted for analysis. ns, not significant. (B) Competitive index scores for ΔentB vs. wildtype SEn strain. CI values were calculated only from sample which showed recovery from direct plating. Column indicates the median value for the data set. (C) Infectivity of wildtype or ΔentB obtained by liver and spleen enrichments. Dark column represents % birds for infected by the strain which are recovered by liver/spleen enrichments. Non-infected % of birds presented by shaded gray color columns means that strain was not recovered by enrichments. (D) Wildtype or Δfeo burden in liver and spleen by direct plating. Each symbol represents a log10 CFU value related to a mutant or wildtype strain (13–14 birds per time point). Description of data presentation follows as (A). (E) Infectivity of wildtype or Δfeo obtained by liver and spleen enrichments. Description of data presentation follows as (C).
FIGURE 5
FIGURE 5
(A,B) Wildtype or ΔfeoΔentB burden in liver and spleen by direct plating. Each symbol represents a colony count of a particular bird (13–14 birds/time point), and each bird has a matching pair of wildtype/mutant colony counts due to the co-infection. Median value of the data is given by the horizontal bar. The detection limit of the XLD agar plate is around 50 CFU/g as indicated in horizontal dotted line. Differences between the median of the data set was accounted. In (A) *, p = 0.0407 (spleen), **p = 0.0019 (liver); (B) *p = 0.0492 (liver), *p = 0.0159 (spleen), **, p = 0.0058 (spleen). (C) Infectivity of wildtype or ΔfeoΔentB obtained by liver and spleen enrichments. Dark column represents % birds for infected by the strain which are recovered by liver/spleen enrichments. Non-infected% of birds presented by shaded gray. Fisher’s exact test used for statistical analysis. ns: not significant. ***p = 0.001, *p = 0.032, **** p = <0.0001.
FIGURE 6
FIGURE 6
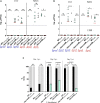
(A) Gentamycin protection assay results at 3 and 24 h of post infection. Survived bacteria shown as CFU/ml in log10 scale. Assay was performed four times in three technical replicates for each strain. Each symbol represents one technical replicate. The detection limit of LB agar palate is 10 CFU/ml. Horizontal bar represent the median value. Mean differences was analyzed using log10 values of CFU/ml. *p = 0.028, *p = 0.012, ***p = 0.0003. (B) Nitric oxide (NO) concentration in μM, 24 post infection. Each column represent mean with standard deviation. Data was from three assays run in triplicates. Statistical significance represents mean differences. ns, not significant, ****p ≤ 0.0001.
FIGURE 7
FIGURE 7
Molecular design for the iron sensing promoter region. TTGACA sequence is recognized by sigma 70 factor which directs the RNA polymerase to the promoter region. GATAATGATAAT is the consensus sequence recognized by ferric uptake regulator protein (Fur) and known as the fur box. In Salmonella, ferrous iron together with Fur, form a dimer and bind to fur box like sequences upstream of iron regulated genes to block the transcription under iron sufficient conditions.
FIGURE 8
FIGURE 8
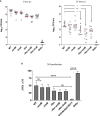
(A) Fur box reporter (WTc35Furbox lux.CmR) expression under iron replete and iron deplete conditions. Maximum light intensity was obtained from luciferase assay results from 24 biological replicates run by a plate reader. 2,2′ Dipyridyl (DP) used with varying concentrations to chelate iron in the LB. Fold change is calculated relative to the average value of reporter expression by the WTc35Furbox lux. Median of the data (CPS) was compared for statistics. ****P ≤ 0.0001. (B) Bioluminescent imaging of gastrointestinal tract of SPF birds challenged with reporter WTc35Furbox lux.CmR). Lowest to highest signal intensity is shown in rainbow color scale. Each pixel represents a specific signal intensity. All images were taken at the IVIS settings of; f = 1, binning = medium, exposure = 60 s, filter = open. (C) Estimated Fur-mediated de-repression in the cecum as a fold change in light intensity. Fold change was calculated from dividing assigned light intensity for each cecal compartment, by 490 CPS. Maximum iron starvation at each time point has been indicated by means of iron chelation of in LB using dipyridyl.

References

    1. Andrews S. C., Robinson A. K., Rodríguez-Quiñones F. (2003). Bacterial iron homeostasis. FEMS Microbiol. Rev. 27 215–237. - PubMed
    1. Bagg A., Neilands J. (1987). Ferric uptake regulation protein acts as a repressor, employing iron (II) as a cofactor to bind the operator of an iron transport operon in Escherichia coli. Biochemistry 26 5471–5477. 10.1021/bi00391a039 - DOI - PubMed
    1. Bailey J., Cox N., Cosby D., Richardson L. (2005). Movement and persistence of Salmonella in broiler chickens following oral or intracloacal inoculation. J. Food Prot. 68 2698–2701. - PubMed
    1. Barrow P. (1991). Experimental infection of chickens with Salmonella enteritidis. Avian Pathol. 20 145–153. - PubMed
    1. Befus A. D., Johnston N., Leslie G., Bienenstock J. (1980). Gut-associated lymphoid tissue in the chicken. I. Morphology, ontogeny, and some functional characteristics of Peyer’s patches. J. Immunol. 125 2626–2632. - PubMed

LinkOut - more resources