. 2022 Mar 4:16:786816.
doi: 10.3389/fnsys.2022.786816. eCollection 2022.

Targeted Interventions to Increase Blood Pressure and Decrease Anaesthetic Concentrations Reduce Intraoperative Burst Suppression: A Randomised, Interventional Clinical Trial

Affiliations

Targeted Interventions to Increase Blood Pressure and Decrease Anaesthetic Concentrations Reduce Intraoperative Burst Suppression: A Randomised, Interventional Clinical Trial

Marie-Therese Georgii et al. Front Syst Neurosci. .

Abstract

Background: It has been suggested that intraoperative electroencephalographic (EEG) burst suppression (BSupp) may be associated with post-operative neurocognitive disorders in the elderly, and EEG-guided anaesthesia may help to reduce BSupp. Despite of this suggestion, a standard treatment does not exist, as we have yet to fully understand the phenomenon and its underlying pathomechanism. This study was designed to address two underlying phenomena-cerebral hypoperfusion and individual anaesthetic overdose.

Objectives: We aimed to demonstrate that targeted anaesthetic interventions-treating intraoperative hypotension and/or reducing the anaesthetic concentration-reduce BSupp.

Methods: We randomly assigned patients to receive EEG-based interventions during anaesthesia or EEG-blinded standard anaesthesia. If BSupp was detected, defined as burst suppression ratio (BSR) > 0, the primary intervention aimed to adjust the mean arterial blood pressure to patient baseline (MAP intervention) followed by reduction of anaesthetic concentration (MAC intervention).

Results: EEG-based intervention significantly reduced total cumulative BSR, BSR duration, and maximum BSR. MAP intervention caused a significant MAP increase at the end of a BSR > 0 episode compared to the control group. Coincidentally, the maximum BSR decreased significantly; in 55% of all MAP interventions, the BSR decreased to 0% without any further action. In the remaining events, additional MAC intervention was required.

Conclusion: Our results show that targeted interventions (MAC/MAP) reduce total cumulative amount, duration, and maximum BSR > 0 in the elderly undergoing general anaesthesia. Haemodynamic intervention already interrupted or reduced BSupp, strengthening the current reflections that hypotension-induced cerebral hypoperfusion may be seen as potential pathomechanism of intraoperative BSupp.

Clinical trial registration: NCT03775356 [ClinicalTrials.gov], DRKS00015839 [German Clinical Trials Register (Deutsches Register klinischer Studien, DRKS)].

Keywords: Burst Suppression Rate; anaesthetic intervention; electroencephalography; entropy; intraoperative neuromonitoring.


Conflict of interest statement

The authors declare that the research was conducted in the absence of any commercial or financial relationships that could be construed as a potential conflict of interest.

Figures
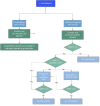
FIGURE 1
FIGURE 1
Study algorithm for the interventional trial on reduction of intraoperative Burst Suppression Rate (BSR).
FIGURE 2
FIGURE 2
Recruitment, randomisation, and patient flowchart for the interventional trial on reduction of intraoperative BSR.
FIGURE 3
FIGURE 3
Description of total cumulative BSR, duration, and maximum of BSR. All boxplots show the medians (solid horizontal lines) and interquartile ranges (IQR, boundaries of the boxes). The square [□] indicates the median and the cross [+] the mean value. The dots represent all measured cases with positive BSR (68 patients) including outliers at the most extreme values outside the boxes. The values on the y-axis are calculated as logarithms. Black coloured boxes/graphs represent the control group and red coloured the intervention group. (A) Displays the total duration of BSR in seconds. The duration of positive BSupp was significantly less in the INTgroup (5.9 min) compared to the CNTgroup (10.1 min) (p = 0.002; difference of medians CI: 165–840 s). (B) The BSR(tot)–the sum of all positive BSR-values–was significantly reduced by intervention (CNTmedian 1385, INTmedian 433; p = 0.002; difference of medians CI: 281–1876). (C) Features a significant reduction of the maximum BSR-value (in %) in the INTgroup (CNTmedian 50, INTmedian 35; p = 0.027; difference of medians CI: -3–29.5).
FIGURE 4
FIGURE 4
Description of the duration of BSR and the cumulative BSR separating induction from maintenance. (A) During induction the duration of BSR (A-left) and the cumulative BSR (A-right) were reduced significantly in the intervention group compared to the control group. The duration of BSR was cut by 2.3 min [p = 0.029, AUC 0.68; CI (0.53; 0.81)]. Similar reductive effect was achieved by intervention regarding the cumulative BSR during induction [CNTmedian 1184 vs. INTmedian 373; p = 0.011; AUC 0.70; CI (0.56; 0.83)]. (B) During maintenance the intervention did not produce statistically significant effects, nevertheless both the duration of BSR (B-left) and the cumulative BSR (B-right) demonstrate a decreasing trend in the intervention group [CNTmedian duration 13.3 min vs. INTmedian duration 10.8 min; p = 0.687; AUC 0.55; CI (0.30; 0.82)] [CNTmedian cumBSR 2129 vs. INTmedian cumBSR 1259; p = 0.828; AUC 0.53; CI (0.29; 0.78)].
FIGURE 5
FIGURE 5
Description of the effect of MAP intervention on BSR during maintenance. (A) When the MAP was increased to its baseline value in INT during maintenance, a sub-analysis showed that the maximum BSR was reduced significantly (p = 0.002). In 7/11 patients, BSR was suppressed to 0. (B) The box and scatter plot shows the distribution of the MAP of all patients at their maximum BSR.
FIGURE 6
FIGURE 6
Description of the MAP values when BSR > 0 during induction and maintenance. (A) During induction (A) both the MAP ratio of “MAP at the start/end of the BSR” (A-left) and the Delta-MAP “end-start” (A-right) showed significant differences comparing CNT with INT. For INT the MAP was increased by 13 mmHg, while for CNT the MAP showed a decreasing trend of -2.9 mmHg [p = 0.033; AUC 0.33; CI (0.19; 0.48)]. (B) In contrast to the non-statistically significant trends of the cumulative BSR and duration of BSR during maintenance, the analysis of the MAP values during maintenance displayed–similar to the induction phase–considerable differences regarding both the MAP ratio (B-left) and the Delta-MAP (B-right) amongst both groups. MAP-ratio: CNT = 0.96 vs. INT = 1.08 (p = 0.012) and Delta MAP: CNT = -1 mmHg vs. INT = 0.7 mmHg [p = 0.006; AUC 0.19; CI (0.04; 0.38)].
FIGURE 7
FIGURE 7
Paired analysis within the groups of the MAP values comparing the MAP at the start and the end of the BSR during induction and maintenance. (A) During induction the paired analysis within INT shows that the MAP by the end of BSR was elevated substantially by intervention [p = 0.009; Hedges’ g 0.68 (−1.25; −0.26)], while there was no significance within CNT [p = 0.802; Hedges’ g 0.03 (−0.38; 0.49)]. (B) Same findings were observed during maintenance: The intervention induced a considerable increase of the MAP at the end of BSR [p = 0.011; Hedges’ g −0.90 (−1.54; −0.42)]. In contrast with CNT, the MAPend often decreased compared to the MAPstart [p = 0.322; Hedges’ g 0.34 (−0.31; 0.89)].
FIGURE 8
FIGURE 8
Paired analysis–comparison of the BL-MAP and MAP at the start of the BSR within the groups during induction and maintenance. During induction (A) and maintenance (B) the paired analysis of the MAP values within both groups (CNT–left; INT–right) demonstrates that the MAP at the start of the BSR was substantially lower than the individual baseline value. For absolute values see Table 1.

References

    1. Aldecoa C., Bettelli G., Bilotta F., Sanders R. D., Audisio R., Borozdina A., et al. (2017). European society of anaesthesiology evidence-based and consensus-based guideline on postoperative delirium. Eur. J. Anaesthesiol. EJA 34 192–214. 10.1097/eja.0000000000000594 - DOI - PubMed
    1. Besch G., Liu N., Samain E., Pericard C., Boichut N., Mercier M., et al. (2011). Occurrence of and risk factors for electroencephalogram burst suppression during propofol–remifentanil anaesthesia. Br. J. Anaesth. 107 749–756. 10.1093/bja/aer235 - DOI - PubMed
    1. Bijker J. B., van Klei W. A., Kappen T. H., van Wolfswinkel L., Moons K. G., Kalkman C. J. (2007). Incidence of intraoperative hypotension as a function of the chosen definition: literature definitions applied to a retrospective cohort using automated data collection. J. Am. Soc. Anesthesiol. 107 213–220. 10.1097/01.anes.0000270724.40897.8e - DOI - PubMed
    1. Bruhn J., Bouillon T. W., Shafer S. L. (2000a). Bispectral index (BIS) and burst suppression: revealing a part of the BIS algorithm. J. Clin. Monit. Comput. 16 593–596. 10.1023/A:1012216600170 - DOI - PubMed
    1. Bruhn J., Röpcke H., Rehberg B., Bouillon T., Hoeft A. (2000b). Electroencephalogram approximate entropy correctly classifies the occurrence of burst suppression pattern as increasing anesthetic drug effect. J. Am. Soc. Anesthesiol. 93 981–985. 10.1097/00000542-200010000-00018 - DOI - PubMed

Associated data