

GLUT1 and ASCT2 Protein Expression in Papillary Thyroid Carcinoma Patients and Relation to Hepatitis C Virus: A Propensity-Score Matched Analysis
- PMID: 35308569
- PMCID: PMC8932928
- DOI: 10.2147/IJGM.S354108
GLUT1 and ASCT2 Protein Expression in Papillary Thyroid Carcinoma Patients and Relation to Hepatitis C Virus: A Propensity-Score Matched Analysis
Abstract
Purpose: Recently, glucose and amino acid transporters have gradually become a hot topic in thyroid gland biology and cancer research. We aimed to investigate the expressions of glucose transporter 1 (GLUT1) and glutamine transporter 2 (ASCT2) in papillary thyroid carcinoma (PTC) and their clinical significance and relation to HCV-related hepatitis.
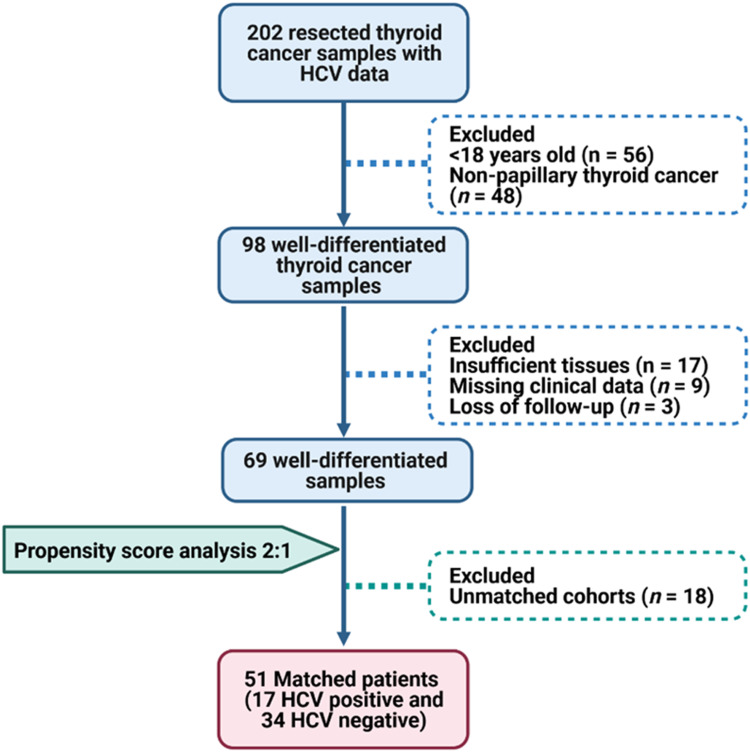
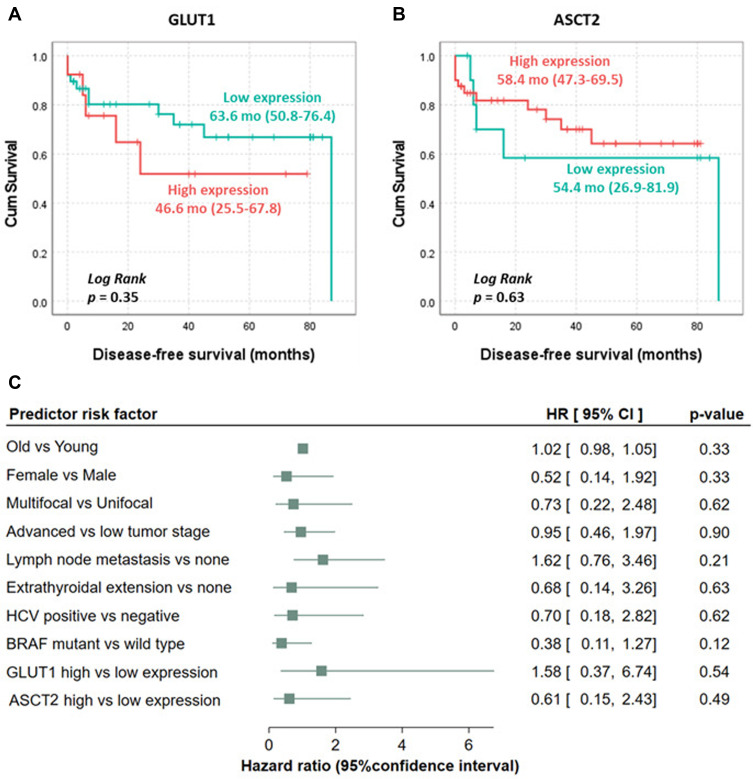
Patients and methods: Screening 202 TC tissue samples against the selection criteria using a propensity-score matched analysis to adjust for age, sex, side of tumor, histopathological variants, TNM staging system, and the positivity for HCV yielded 51 matched (17 HCV positive and 34 HCV negative) PTC samples. The expressions of GLUT1 and ASCT2 expressions were detected by immunohistochemical staining. Kaplan-Meier survival curves were generated for disease-free and overall survival, and multivariate Cox regression analysis was applied to identify predictors for mortality.
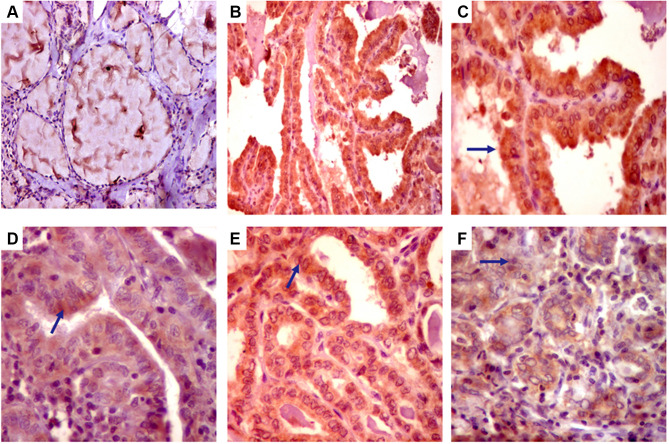
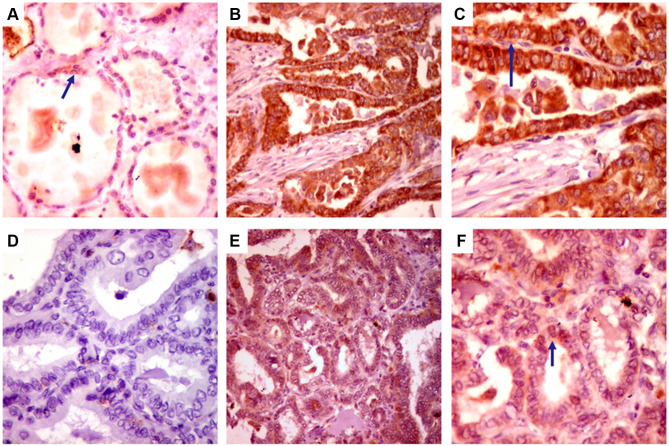
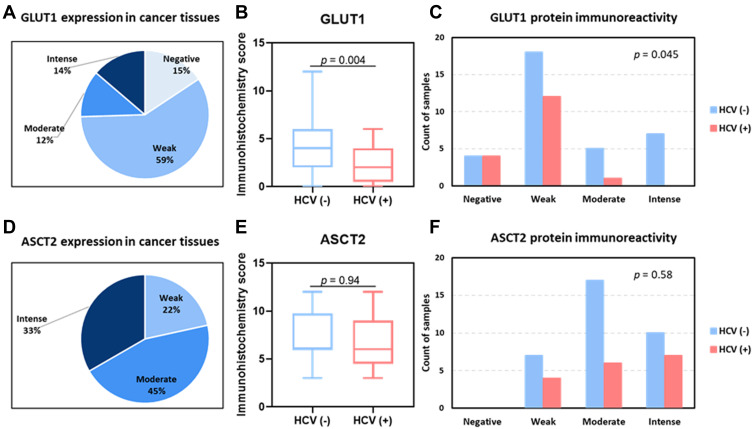
Results: Of 51 thyroid cancer tissues, 85% showed positive GLUT1 cytoplasmic staining, and 26% had a high expression score. All thyroid cancer specimens demonstrated ASCT2 cytoplasmic staining with membranous accentuation. Of these, 78% showed a high expression score, and 22% showed weak staining. On stratifying the study cohort based on the HCV status, HCV negative cohort showed a significantly higher immunoreactivity score for GLUT1 (p = 0.004) but not ASCT2 (p = 0.94) than HCV positive group. The expressions of the studied transporters showed no significant associations with the prognostic features of PTC nor the disease-free/overall survival.
Conclusion: GLUT1 and ASCT2 immunohistochemical staining showed positive expression with variable intensity in nearly 85% and 100% of PTC tissue samples compared to normal ones, respectively. Furthermore, GLUT1 protein expression, not ASCT2, showed a higher immunoreactivity score in PTC patients who are negative for HCV than cancer patients with positive HCV. Meanwhile, the expression of both protein markers was not associated with the clinicopathological characteristics of the studied PTC patients. Further large-scale multicenter studies are recommended to validate the present findings.
Keywords: HCV; glucose transporter 1; glutamine transporter 2; immunohistochemistry; papillary thyroid cancer.
© 2022 Ibrahiem et al.
Conflict of interest statement
The authors report no conflicts of interest. The authors alone are responsible for the content and writing of this article.
Figures
Similar articles
-
GLUT1 and ASCT2 as Predictors for Prognosis of Hepatocellular Carcinoma.PLoS One. 2016 Dec 30;11(12):e0168907. doi: 10.1371/journal.pone.0168907. eCollection 2016. PLoS One. 2016. PMID: 28036362 Free PMC article.
-
GLUT1 and ASCT2 expression and their prognostic value in colorectal carcinoma.Indian J Pathol Microbiol. 2024 Jul 1;67(3):518-524. doi: 10.4103/ijpm.ijpm_78_23. Epub 2023 Nov 9. Indian J Pathol Microbiol. 2024. PMID: 38394402
-
TROP-2 immunohistochemistry: a highly accurate method in the differential diagnosis of papillary thyroid carcinoma.Pathology. 2016 Aug;48(5):425-33. doi: 10.1016/j.pathol.2016.04.002. Epub 2016 Jun 14. Pathology. 2016. PMID: 27311870
-
Glucose transporter 1 gene expression is related to thyroid neoplasms with an unfavorable prognosis: an immunohistochemical study.Thyroid. 2002 Sep;12(9):747-54. doi: 10.1089/105072502760339307. Thyroid. 2002. PMID: 12481939
-
Relationships between transporter expression and the status of BRAF V600E mutation and F-18 FDG uptake in papillary thyroid carcinomas.Endocr Res. 2016;41(1):64-9. doi: 10.3109/07435800.2015.1066803. Epub 2015 Oct 29. Endocr Res. 2016. PMID: 26513490
References
LinkOut - more resources
Full Text Sources
Miscellaneous
