. 2022 Mar 2:16:750464.
doi: 10.3389/fnhum.2022.750464. eCollection 2022.

Age-Related Effects on the Spectrum of Cerebral Visual Impairment in Children With Cerebral Palsy

Affiliations

Age-Related Effects on the Spectrum of Cerebral Visual Impairment in Children With Cerebral Palsy

Jessica Galli et al. Front Hum Neurosci. .

Abstract

Background: Cerebral Visual Impairment (CVI) is a very common finding in children affected by Cerebral Palsy (CP). In this paper we studied the characteristics of CVI of a large group of children with CP and CVI, describing their neurovisual profiles according to three different age subgroups (subgroup 1: infants 6 months-2 years; subgroup 2: pre-school age 3-5 years; subgroup 3: school age ≥ 6 years).

Methods: We enrolled 180 subjects (104 males, mean age 66 ± 42.6 months; range 6-192 months) with CP and CVI for the study. We carried out a demographic and clinical data collection, neurological examination, developmental or cognitive assessment, and a video-recorded visual function assessment including an evaluation of ophthalmological characteristics, oculomotor functions, and basic visual functions. In school-aged children, we also performed an evaluation of their cognitive-visual profiles.

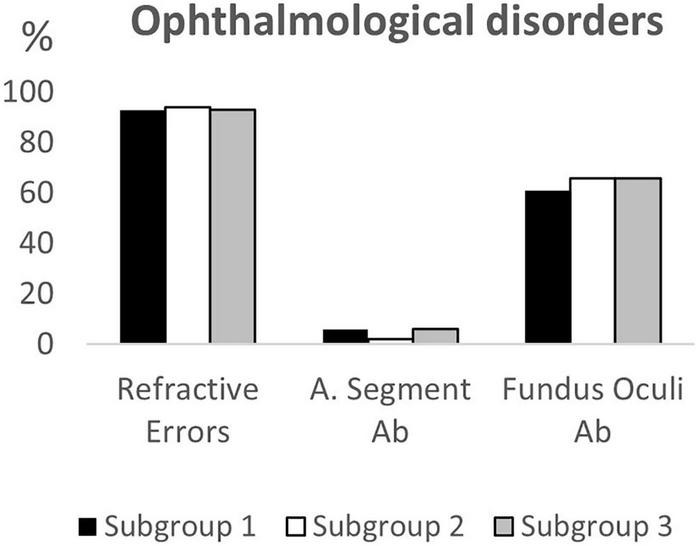
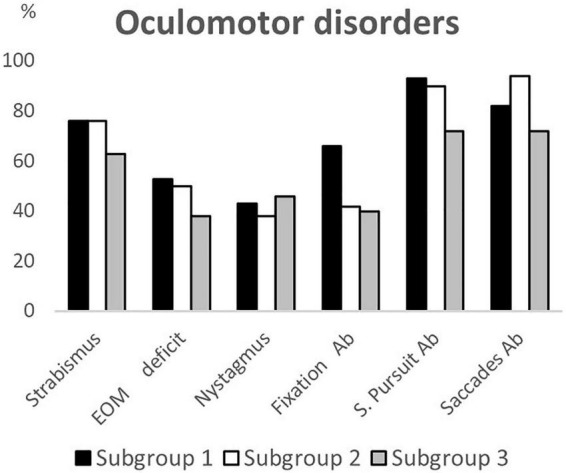
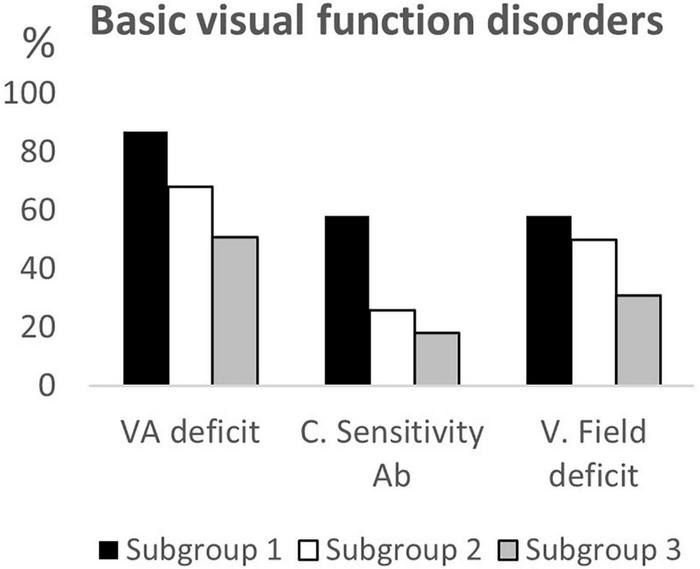
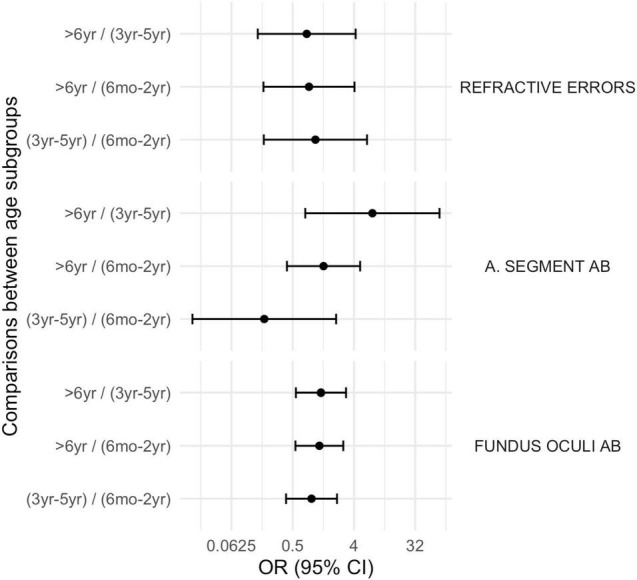
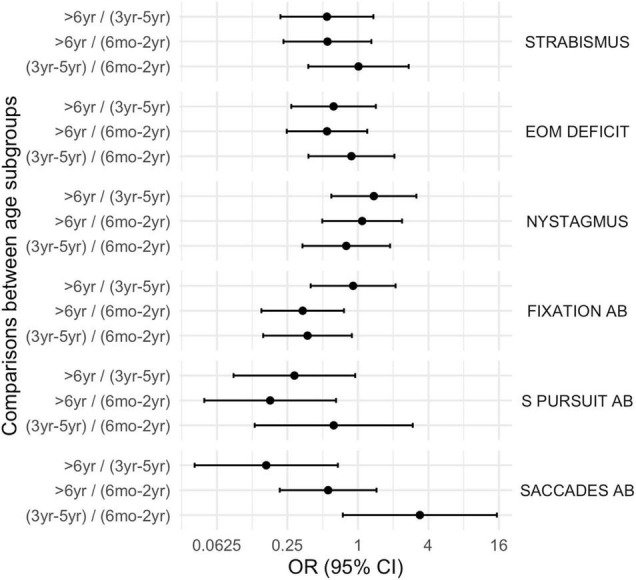
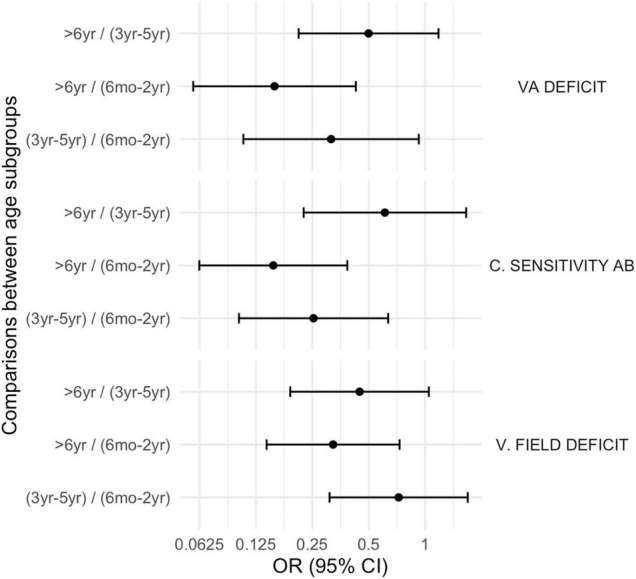
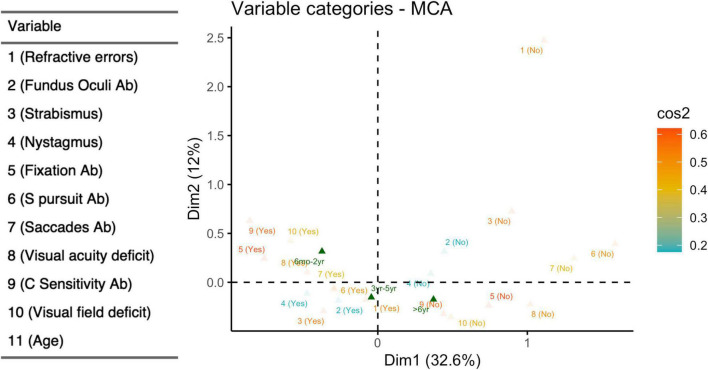
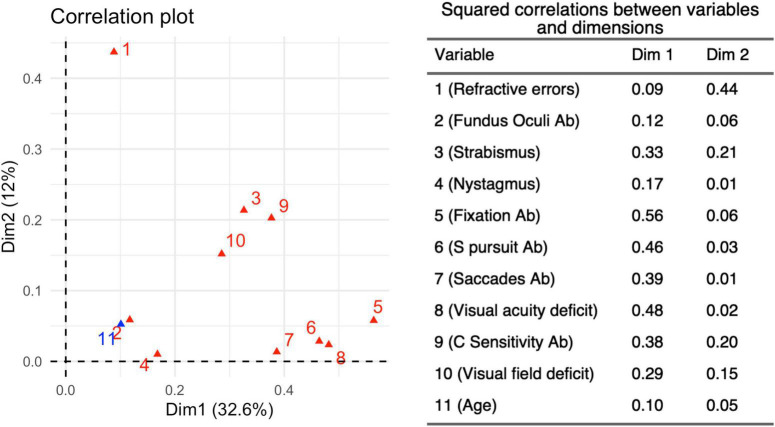
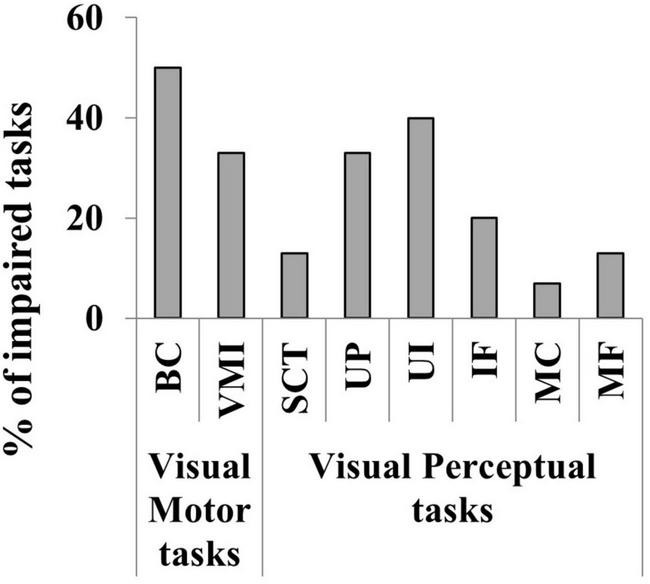
Results: There were signs of CVI in all the three subgroups. Subgroup 1 (62 children) and subgroup 2 (50 children) were different for fixation (p = 0.02), visual acuity (p = 0.03) and contrast sensitivity (p < 0.01), being more frequently impaired in younger children. Comparing subgroup 2 with subgroup 3 (68 children), the older children presented more frequently myopia (p = 0.02) while the younger ones esotropia (p = 0.02) and alteration in smooth pursuit (p = 0.03) and saccades (p < 0.01). Furthermore, fixation, smooth pursuit, visual acuity, contrast sensitivity and visual filed (p < 0.01) were more frequently impaired in younger children (subgroup 1) compared to the older ones. Multiple correspondence analysis (MCA) confirmed the different neurovisual profiles according to age: younger children with CP showed more signs of CVI compared to the older ones. 34 out of 68 children belonging to subgroup 3 underwent the cognitive visual evaluation; an impairment of cognitive visual skills was detected in 21 subjects.

Conclusion: Younger children with CP showed more signs of CVI compared to the older ones, likely for the physiological maturation of visual system and mechanisms of neuroplasticity. In this direction, we suggest an early neurovisual evaluation to detect any weak visual functions.

Keywords: age; cerebral palsy; cerebral visual impairment; children; cognitive-visual disorders.


Conflict of interest statement

The authors declare that the research was conducted in the absence of any commercial or financial relationships that could be construed as a potential conflict of interest.

Figures

FIGURE 1
FIGURE 1
Ophthalmological disorders according to age subgroups. A. Segment Ab, Anterior Segment abnormalities; Fundus Oculi Ab, Fundus Oculi abnormalities.
FIGURE 2
FIGURE 2
Oculomotor disorders according to age subgroups. EOM deficit, extrinsic ocular motility deficit; Ab, abnormalities; S. Pursuit, smooth pursuit.
FIGURE 3
FIGURE 3
Basic visual function disorders according to age subgroups. VA deficit, visual acuity deficit; C. Sensitivity Ab, Contrast Sensitivity abnormalities; V. field deficit, visual field deficit.
FIGURE 4
FIGURE 4
Comparison between subgroups, OR (CI 95%): ophthalmological disorders. A. Segment Ab, Anterior Segment abnormalities; Fundus Oculi Ab, Fundus Oculi abnormalities.
FIGURE 5
FIGURE 5
Comparison between subgroups, OR (CI 95%): oculomotor disorders. EOM deficit, extrinsic ocular motility deficit, Ab, abnormalities, S. Pursuit, smooth pursuit.
FIGURE 6
FIGURE 6
Comparison between subgroups, OR (CI 95%): basic visual function disorders. VA deficit, visual acuity deficit; C. Sensitivity Ab, Contrast Sensitivity abnormalities; V. field deficit, visual field deficit.
FIGURE 7
FIGURE 7
Multiple correspondence analyses (dichotomized items). Coordinate plot: MCA of 10 visual items after dichotomization; supplementary variables: age subgroup, defined as 6 months-2 years, 3–5 years, > 6 years. Explained variability: 1st dimension (horizontal axis) 32.6%; 2nd dimension (vertical axis) 11.9%. Yes (presence of visual deficit); No (absence of visual deficit); Ab (abnormalities).
FIGURE 8
FIGURE 8
Squared Correlations (r2) between each variable and the first two main Dimensions 1 and 2. The r2-values related to the two dimensions determined by the MCA for 10 variables, identified from the neurovisual evaluation carried out in 180 children belonging to the three different age subgroups. Dimension 1 accounts for 32.6% of the variance in this analysis, while Dimension 2 accounts for 12%.
FIGURE 9
FIGURE 9
Percentage of the impaired cognitive visual tasks in the 34 children evaluated. Visual motor skills (BC, Block Construction task; VMI, Developmental Test of Visual-Motor Integration) and Visual perceptual skills (STC, Street Completion Test; UP, colored photographs of objects viewed from unusual perspectives; UL, photographs illuminated in unusual ways; IF, Imagery Figures; MC, Matching Tasks for the ability to recognize semantic attributes of stimuli; MF, Matching Tasks for the ability to recognize functional attributes of stimuli).

Similar articles

Cited by

References

    1. Aghaji A. E., Lawrence L., Ezegwui I., Onwasigwe E., Okoye O., Ebigbo P. (2013). Unmet visual needs of children with down syndrome in an African population: implications for visual and cognitive development. Eur. J. Ophthalmol. 23 394–398. 10.5301/ejo.5000222 - DOI - PubMed
    1. Alahyane N., Lemoine-Lardennois C., Tailhefer C., Collins T., Fagard J., Doré-Mazars K. (2016). Development and learning of saccadic eye movements in 7- to 42-month-old children. J. Vis. 16:6. 10.1167/16.1.6 - DOI - PubMed
    1. Aring E., Grönlund M. A., Hellström A., Ygge J. (2007). Visual fixation development in children. Graefes Arch. Clin. Exp. Ophthalmol. 245 1659–1665. 10.1007/s00417-007-0585-6 - DOI - PubMed
    1. Arp S., Taranne P., Fagard J. (2006). Global perception of small numerosities (subitizing) in cerebral-palsied children. J. Clin. Exp. Neuropsychol. 28 405–419. 10.1080/13803390590935426 - DOI - PubMed
    1. Atkinson J., Braddick O. (2007). Visual and visuocognitive development in children born very prematurely. Prog. Brain Res. 164 123–149. 10.1016/S0079-6123(07)64007-2 - DOI - PubMed