Review
. 2022 Mar 16;9(3):211932.
doi: 10.1098/rsos.211932. eCollection 2022 Mar.

Bedload transport: beyond intractability

Affiliations
Review

Bedload transport: beyond intractability

Basil Gomez et al. R Soc Open Sci. .

Abstract

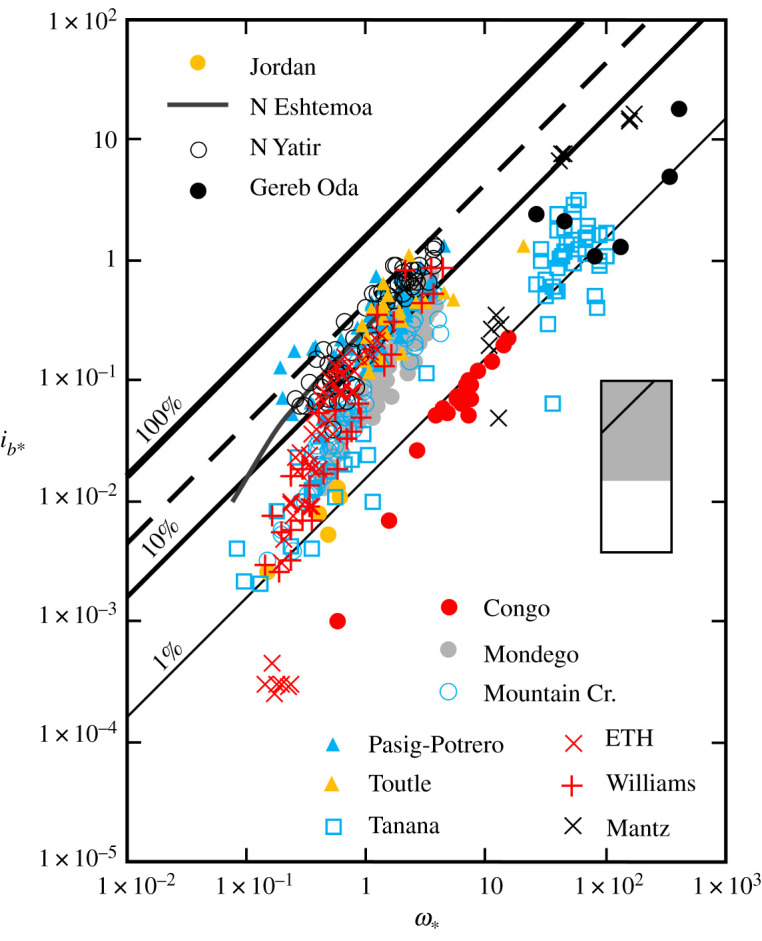
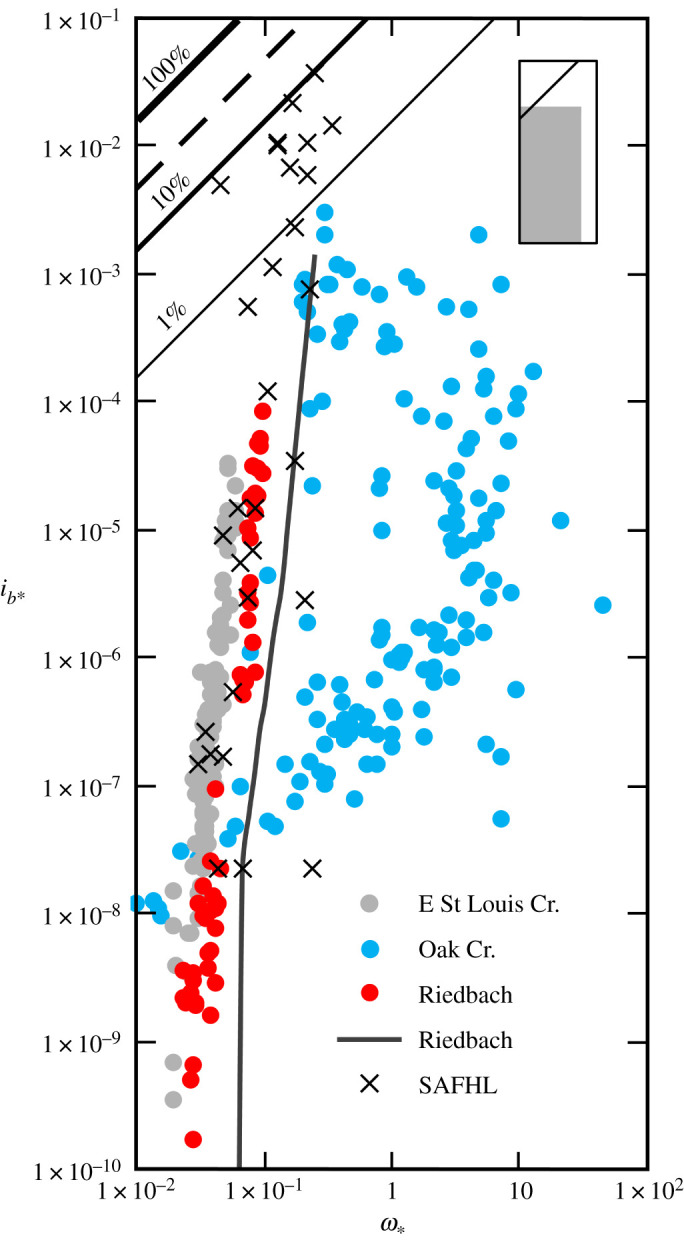
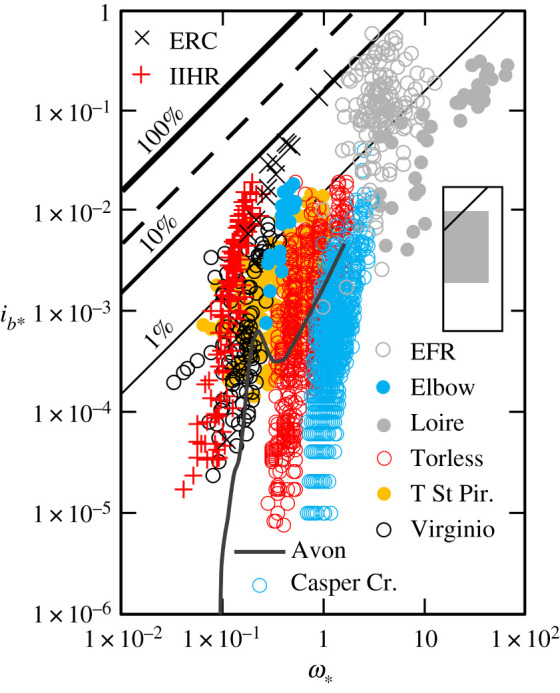
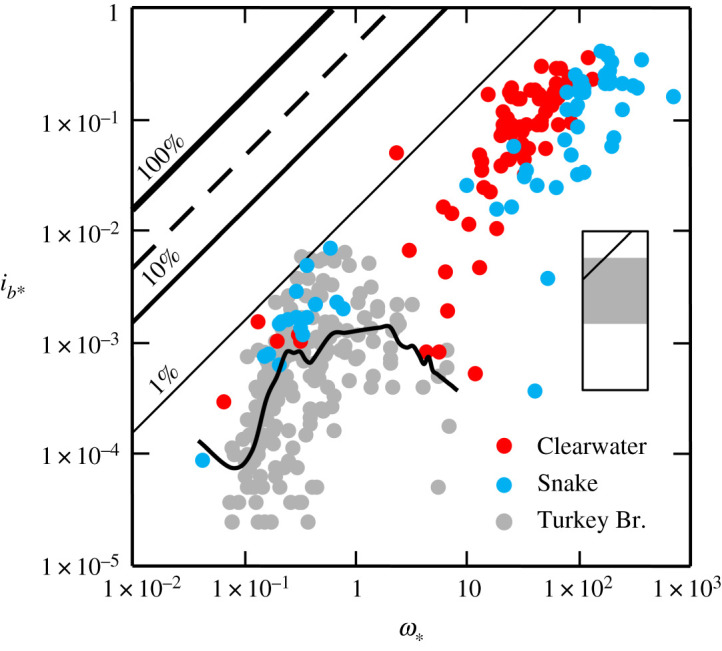
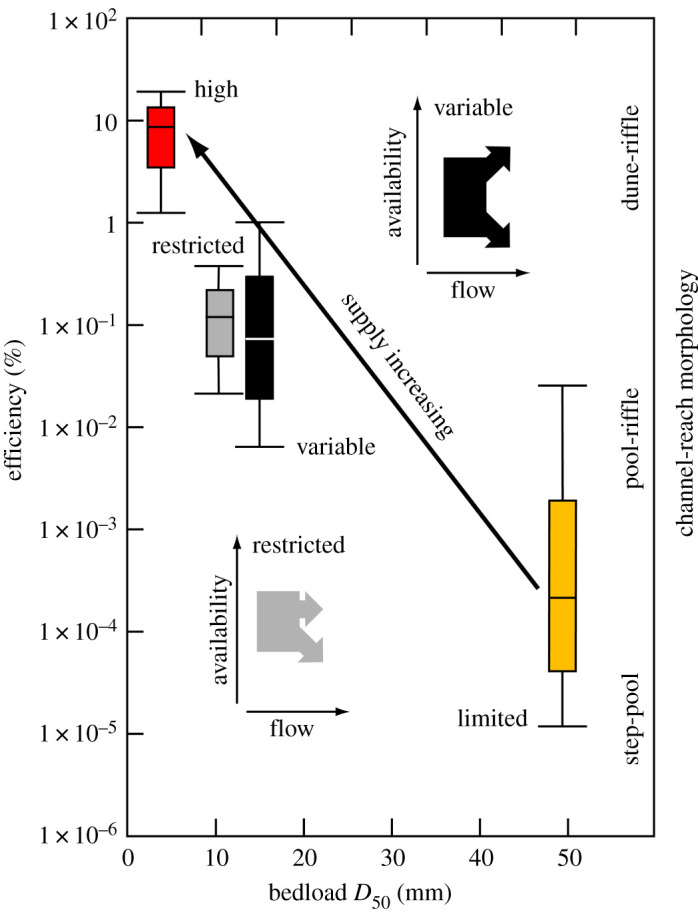
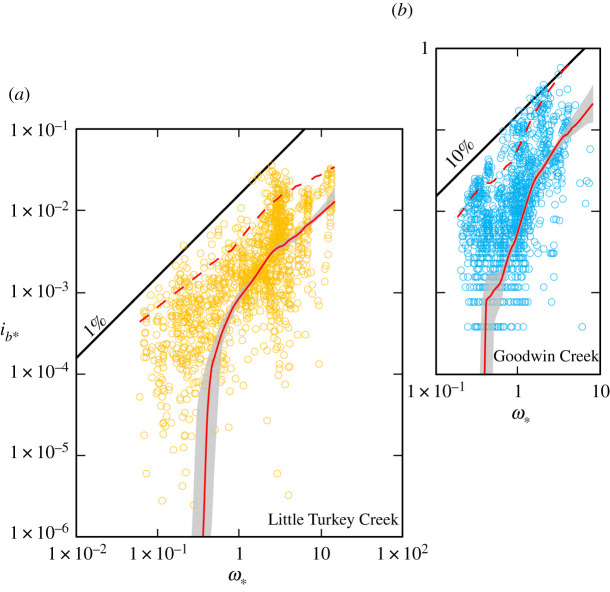
Scrutiny of multifarious field and laboratory data amassed over nine decades reveals four distinct bedload transport regimes and demonstrates the search for a universal formula is a fallacious pursuit. In only one regime, in which the supply of transportable material is unconstrained, does the transport rate in some rivers approximate the expected proportional relationship with dimensionless specific stream power (ω ). At the other extreme, transport occurs at or near the threshold of particle motion, and the availability of sediment is regulated by the characteristics of the bed surface. In each regime, there is an underlying variation of transport rates at a given discharge, that is neither obscured by long measurement times nor standardized methodologies, and to properly differentiate them, the bedload size must be known. We show a data-driven relationship based on measurements made over several years, across the entire flow range, that requires no a priori specification of the association between the transport rate and ω , can reveal nonlinear trends that may otherwise be masked by omni-present temporal and spatial variability. The demise of the search for a universal formula will be accelerated by the development of idiomatic relations that embrace the specificity of rivers in each transport regime.

Keywords: bedload transport efficiency; bedload transport rate; dimensionless specific stream power; quantile locally weighted scatterplot smoothing; sediment availability; transport regimes.


Conflict of interest statement

We declare we have no competing interests.

Figures

Figure 1.
Figure 1.
Variation of dimensionless rate of bedload transport (ib) with dimensionless specific stream power (ω) in high availability rivers and three laboratory flumes (+ and ×). Least-squares regression (r2 = 0.93; solid charcoal line) describes the trend in Nahal Eshtemoa, Israel [34]. The family of diagonal lines represent specified bedload transport efficiencies, and the dashed line, the theoretical maximum efficiency (26–30%) attainable in rivers [13,14]. Inset shows relationship of this figure (with 100% efficiency line indicated) to the overall range of the data used to compile figures 1–4, which are catalogued in the electronic supplementary material.
Figure 2.
Figure 2.
Variation of dimensionless rate of bedload transport (ib) with dimensionless specific stream power (ω) in limited availability rivers and a laboratory flume (×). The 0.5 (median) quantile LOcally WEighted Scatterplot Smoothing (LOWESS) curve flexed with a 0.05 moving kernel window (solid charcoal line) describes the trend in the high-resolution data from the steep reach in the Riedbach River, Switzerland (after [28]), and dots are stream-wide mean values for the low-gradient reach [38]. The family of diagonal lines represent specified bedload transport efficiencies, and the dashed line, the theoretical maximum efficiency (26–30%) attainable in rivers [13,14]. Inset shows relationship of this figure (with 100% efficiency line indicated) to the overall range of data used to compile figures 1–4, which are catalogued in the electronic supplementary material.
Figure 3.
Figure 3.
Variation of dimensionless rate of bedload transport (ib) with dimensionless specific stream power (ω) in variable availability rivers and two laboratory flumes (+ and ×). The 0.5 (median) quantile LOcally WEighted Scatterplot Smoothing (LOWESS) curve flexed with a 0.05 moving kernel window (solid charcoal line) describes the trend in the high-resolution data from the Avon River, Devon, UK (after [28]). The family of diagonal lines represent specified bedload transport efficiencies, and the dashed line the theoretical maximum efficiency (26–30%) attainable in rivers [13,14]. Inset shows relationship of this figure (with 100% efficiency line indicated) to the overall range of data used to compile figures 1–4, which are catalogued in the electronic supplementary material.
Figure 4.
Figure 4.
Variation of dimensionless rate of bedload transport (ib) with dimensionless specific stream power (ω) in restricted availability rivers. The 0.5 (median) quantile LOWESS (LOcally WEighted Scatterplot Smoothing) curve flexed with a 0.25 moving kernel window (solid black line) accentuates the trend in the high-resolution data from Turkey Brook, Greater London, UK (after [28]). The family of diagonal lines represent specified bedload transport efficiencies, and the dashed line the theoretical maximum efficiency (26–30%) attainable in rivers [13,14]. Inset shows relationship of this figure (with 100% efficiency line indicated) to the overall range of data used to compile figures 1–4, which are catalogued in the electronic supplementary material.
Figure 5.
Figure 5.
Variation of bedload transport efficiency in relation to aggregate bedload size, channel-reach morphology and the first order control of sediment supply in rivers that delineate the four transport regimes (figures 1–4; see text for discussion); the line within each box is the median efficiency, lower and upper boundaries are the 25th and 75th percentiles and lower and upper whiskers are the 10th and 90th percentiles. By contrast, the two insets show alternative trends in sediment availability that can occur as the flow rate increases in rivers with a variable or restricted availability transport regime.
Figure 6.
Figure 6.
(a) The 0.5 (median) quantile LOcally WEighted Scatterplot Smoothing (LOWESS) curve flexed with a 0.4 moving kernel window fitted to Little Turkey Creek, TN, USA, and (b) Goodwin Creek, MS, USA, bedload transport data (solid red lines). Grey shading delineates the 95% confidence envelopes computed by percentile block-bootstrapping. Dashed red lines are 0.95 quantile LOWESS curves flexed with a 0.7 moving kernal window. Diagonal lines are specified bedload transport efficiencies. See text for discussion.

References

    1. Gilbert GK. 1876. The Colorado plateau and provinces as a field for geological study. Am. J. Sci. Arts. 12, 16-24, 87-103. (10.2475/ajs.s3-12.67.16) - DOI
    1. Ancey C. 2020. Bedload transport: a walk between randomness and determinism. Part 1. The state of the art. J. Hydraul. Res. 58, 1-17. (10.1080/00221686.2019.1702594) - DOI
    1. Bagnold RA. 1980. An empirical correlation of bedload transport rates in flumes and natural rivers. Proc. R. Soc. Lond. A 372, 453-473. (10.1098/rspa.1980.0122) - DOI
    1. Guo J. 2021. Generalized bed-load function based on empirical data. J. Hydraul. Eng. 147, 06021008. (10.1061/(asce)hy.1943-7900.0001909) - DOI
    1. Einstein HA. 1944. Bed-load transportation in Mountain Creek. Greenville Sediment Load Laboratory SCS-TP- 55, p. 54. United States Department of Agriculture, Soil Conservation Service, Washington, DC.

LinkOut - more resources