Review
. 2022 Mar 4:14:841704.
doi: 10.3389/fnsyn.2022.841704. eCollection 2022.

Multiple Roles of Actin in Exo- and Endocytosis

Affiliations
Review

Multiple Roles of Actin in Exo- and Endocytosis

Ling-Gang Wu et al. Front Synaptic Neurosci. .

Abstract

Cytoskeletal filamentous actin (F-actin) has long been considered a molecule that may regulate exo- and endocytosis. However, its exact roles remained elusive. Recent studies shed new light on many crucial roles of F-actin in regulating exo- and endocytosis. Here, this progress is reviewed from studies of secretory cells, particularly neurons and endocrine cells. These studies reveal that F-actin is involved in mediating all kinetically distinguishable forms of endocytosis, including ultrafast, fast, slow, bulk, and overshoot endocytosis, likely via membrane pit formation. F-actin promotes vesicle replenishment to the readily releasable pool most likely via active zone clearance, which may sustain synaptic transmission and overcome short-term depression of synaptic transmission during repetitive firing. By enhancing plasma membrane tension, F-actin promotes fusion pore expansion, vesicular content release, and a fusion mode called shrink fusion involving fusing vesicle shrinking. Not only F-actin, but also the F-actin assembly pathway, including ATP hydrolysis, N-WASH, and formin, are involved in mediating these roles of exo- and endocytosis. Neurological disorders, including spinocerebellar ataxia 13 caused by Kv3.3 channel mutation, may involve impairment of F-actin and its assembly pathway, leading in turn to impairment of exo- and endocytosis at synapses that may contribute to neurological disorders.

Keywords: actin; endocytosis; exocytosis; neurological disorder; synaptic transmission.


Conflict of interest statement

The authors declare that the research was conducted in the absence of any commercial or financial relationships that could be construed as a potential conflict of interest.

Figures
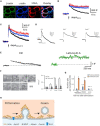
FIGURE 1
FIGURE 1
Actin is involved in mediating ultrafast, fast, slow, bulk, and overshoot endocytosis at synapses likely by facilitating membrane pit formation. (A) Antibody staining of β-actin, γ-actin, and vesicular glutamate transporter 1 (vGluT1) in calyx of Held nerve terminals. (B) Actin involvement in slow endocytosis: mean capacitance (Cm) traces (mean + SEM) induced by a 20 ms depolarization from –80 to +10 mV (depol20 ms, arrow) in calyces of wild-type (black), Actb–/– (red), and Actg1–/– (blue) mice. Depol20 ms induces slow endocytosis in wild-type calyces. (C) Actin involvement in rapid (or fast) endocytosis: similar arrangement as in B except that the stimulus was 10 depol20 ms at 10 Hz (depol20 msX10), which induces rapid (or fast) endocytosis in wild-type calyces. (D) Actin involvement in bulk endocytosis and endocytosis overshoot: sampled Cm induced by depol50 msX10 (10 depol50 ms at 10 Hz) with 5.5 mM calcium in the bath from wild-type (Ctrl), β-actin (Actb)–/–, and γ-actin (Actg1)–/– calyces. Depol50 msX10 induces bulk endocytosis (a large step of downward capacitance shift) and endocytosis overshoot in Ctrl. (E) Actin involvement in very fast endocytosis: averaged Cm response to single action potentials in Ctrl (black) and in the presence of latrunculin A (Lat A, green). Gray solid lines are exponential fits to the Cm decay. (F) Left: electron microscopy images of membrane pits of various shapes obtained during or after high potassium chloride (KCl) application from either wild-type (WT) or Actb–/– hippocampal cultures. Right: the number of pits before (R) and after KCl application (K+, 0 min; 3 min and 10 min) in wild-type (WT) control and Actb–/– hippocampal synapses (mean + SEM). *p < 0.05; ***p < 0.001 (t-test). The data show that β-actin knockout inhibits pit formation. (G) Actin involvement in ultrafast pit formation: average number of exocytic pits (blue) and endocytic pits (orange) in cells treated with latrunculin A (Lat A) or dimethyl sulfoxide (DMSO). ***p < 0.001 (t-test). (H) Schematic diagram showing the involvement of F-actin and its nucleation factors, such as Kv3.3 potassium channel, Arp2/3, formin, and myosin II in all kinetically distinguishable forms of endocytosis, including ultrafast, fast, slow, bulk, and overshoot endocytosis. Panels A–D,F are adapted from Wu et al. (2016) with permission. Panel E is adapted from Delvendahl et al. (2016) with permission. Panel G is adapted from Watanabe et al. (2013) with permission.
FIGURE 2
FIGURE 2
Actin promotes RRP replenishment likely by facilitating active zone clearance. (A) Sampled Cm traces induced by a pair of depol20 ms at an interval of 200 ms in a control (Ctrl, left) and an Actb–/– (right) calyx. Measurements of the capacitance jumps induced by the first and second depol20 ms (ΔCm1 and ΔCm2) are schematically shown. (B) Left: the ratio between the second and first ΔCm (ΔCm2/ΔCm1) during a pair of depol20 ms plotted versus paired-pulse interval at control and Actb–/– calyces. Right: same as in left but plotting the interval between 0 and 1 s. *p < 0.05; **p < 0.01 (t-test). The data in A,B show that β-actin knockout reduces ΔCm2/ΔCm1. (C) Top: a dual pulse of 50 ms (to 0 mV) was applied at different intervals (200 and 500 ms) to the calyx. Presynaptic calcium currents (Ipre) and excitatory postsynaptic currents (EPSCs) are shown. Bottom: similar arrangement as in the top, but with the presynaptic pipette solution containing Lat A to inhibit actin polymerization. Arrows indicate that latrunculin A inhibits EPSC induced by a second pulse. (D) The Kv3.3 channel regulates EPSCs during repetitive action potential firing: sampled EPSCs (top) and the amplitude of EPSCs (bottom, mean + SEM) induced by 10 action potentials at 100 Hz at the calyx of wild-type mice, Kv3.3–/– mice, and mice with a mutation (Kv3.3 G592R) that causes spinocerebellar ataxia 13 and inhibits F-actin nucleation at the calyx. (E) Schematic diagram showing that the F-actin cytoskeleton may facilitate active zone clearance and thus RRP replenishment. RRP replenishment may involve active zone clearance, vesicle docking, and vesicle priming that makes the docked vesicle release-ready. Panels A,B are adapted from Wu et al. (2016) with permission. Panel C is adapted from Sakaba and Neher (2003) with permission. Panel D is adapted from Wu et al. (2021) with permission.
FIGURE 3
FIGURE 3
F-actin promotes fusion pore expansion by enhancing plasma membrane tension. (A) Latrunculin A (Lat A) reduces F-actin: sampled Lifeact-labeled F-actin at the cell bottom of bovine adrenal chromaffin cells before (0 s, left) and 600 s after (right) application of Lat A (3 μM) or a control (Ctrl) solution. (B) A single amperometric spike along with the five parameters: quantal size Q (pC), half-width (ms), peak amplitude (pA), foot signal duration (ms), and mean foot current (pA). (C) Half-width (mean ± SEM) of amperometric spikes in control (CT) or in the presence of blebbistatin (BL), cytochalasin D (CD), ML-7 (ML7), or Lat A. Data normalized to the mean in control. *p < 0.05; **p < 0.01; ***p < 0.001 (t-test). (D) Lat A slows down neuropeptide Y-EGFP (NPY-EGFP) release from single vesicles: fluorescence of NPY-EGFP (FNPY) from single vesicles in Ctrl (left) and in the presence of Lat A (right). Decay indicates release of neuropeptide Y-EGFP. NPY-EGFP images at times indicated are also shown. The initial increase of NPY-EGFP fluorescence is due to fusion pore opening that increases the vesicular lumen pH. (E) Top: setup drawing. Cell membrane is labeled with the phospholipase C ΔPH domain attached with mNeonGreen (PHG, green), whereas the bath solution contains Atto 532 (A532, red, pseudo-color). Bottom left: STED PHG/A532 images immediately before (time 0) and after fusion during imaging every 0.1 s. PHG-labeled fusion pore is visible. The stimulation was a depolarization from –80 to +10 mV for 1 s (depol1 s). Bottom right: similar to left panel but showing a pore not visible to STED microscopy. (F) The percentage of fusion pores induced by depol1s that are visible to STED microscopy (Porev%) at 310 or 650 mOsm (bath solution) in calcium (Ca2+), strontium (Sr2+), or dynasore (DnS, with 5 mM Ca2+). Porev was detected with PHG STED imaging as shown in E. Data show that 650 mOsm reduces Porev%. (G) Latrunculin A (Lat A) reduces membrane tension. Left: drawings of the micropipette aspiration technique. Negative pressure (ΔP) in the pipette (with a diameter D) draws the cell membrane into the pipette by a length L. Middle: pipette-aspirated cells (bright-field images) in the absence (Ctrl) and presence of Lat A (0.5 μM). Arrows indicate membrane projection (L) into the micropipette (ΔP = 500 Pa). Right: normalized projection length (L/D, mean + SEM) for aspirated cells in the absence (Ctrl) or presence of Lat A (0.5 μM). *p = 0.011 (t-test). (H) Lat A inhibits Porev (fusion pore visible to STED microscopy) percentage: the percentage of Porev (Porev%) in the absence (–) or presence (+) of 3 μM Lat A in a bath containing Ca2+, Sr2+, or DnS. Porev was detected with STED imaging of PHG as shown in panel E. (I) Schematic drawing showing that F-actin cytoskeleton enhances plasma membrane tension and thus promotes fusion pore expansion that releases vesicular contents rapidly and completely. Promotion of fusion pore expansion does not necessarily flatten the fusion pore, explained in more detail in Figure 4. Panels A,D,G are adapted from Wen et al. (2016) with permission. Panels B,C are adapted from Berberian et al. (2009) with permission. Panel E,F,H are adapted from Shin et al. (2018) with permission.
FIGURE 4
FIGURE 4
Actin promotes shrink fusion by enhancing plasma membrane tension. (A) PHG-labeled Ω-profile fluorescence (FPH; normalized to baseline), A532 spot fluorescence (F532; normalized to baseline), PHG-labeled Ω-profile height (H; circles), PHG-labeled Ω-profile width (W; triangles), and sampled images at times indicated with lines showing shrink fusion. The experimental setup is the same as that shown in Figure 3E. (B) Percentages (mean + SEM) of fusion events undergoing Ω-shrink fusion in Ctrl or in the presence of 3 μM Lat A (***p < 0.001), 4 μM Cyto D (***p < 0.001), or ATPγS (2 mM, replacing 2 mM ATP in the whole-cell pipette; ***p < 0.001) (t-test). (C) Percentages (mean + SEM) of Ω-shrink fusion induced by whole-cell calcium (1.5 μM) dialysis in Ctrl, Actb–/– cells, Actb–/– cells overexpressed with β-Actin–mEGFP, Ctrl cells treated with Lat A (Lat A), and Actb–/– cells treated with Lat A. ***p < 0.001 (t-test). (D) Left: schematic of the model (not to scale). Cells maintain an outward (swelling) osmotic pressure ΔP = Pcell – Pext (green arrows), with cell pressure Pcell exceeding extracellular pressure Pext. Intact vesicles maintain swelling pressure (red arrow), with vesicle pressure Pves > Pcell. Following fusion with plasma membrane (PM), rapid equilibration between vesicle lumen and extracellular medium is assumed, so Pves = Pext. The vesicle osmotic pressure then equals ΔP but is now an inward squeezing pressure. The model calculates the vesicle tension, γves, while the PM tension, γPM, and the adhesion energy εadhesion to the actin cortex (maroon layer adjacent to PM) are taken from experiment. Right: predicted shrink fusion sequence. Computed vesicle shapes and free energies for squeezing pressure ΔP = 100 Pa and the indicated effective diameters D (such that vesicle area equals πD2). A transition occurs at D = 56 nm from Ω to Λ shape (defined as a profile lacking overhang). (E) Shrink fusion mechanism predicted by the model. Osmotic squeezing deflates the vesicular Ω-shape profile and abolishes its membrane tension, so the Ω-profile’s membrane is reeled into the PM by PM tension and PM adhesion to the actin cortex. Panels A,D,E are adapted from Shin et al. (2020) with permission. Panels B,C are adapted from Wen et al. (2016) with permission.
FIGURE 5
FIGURE 5
Schematic summary of F-actin’s functions in RRP replenishment, fusion pore expansion, fused vesicle merging via shrink fusion, and all distinguishable forms of endocytosis in secretory cells. The schematic drawing shows RRP replenishment involving active zone clearance, vesicle docking and priming, fusion pore opening, fusion pore expansion that releases vesicular contents, shrink fusion that merges fused vesicles at the plasma membrane, and classical endocytosis involving pit formation and fission of the pit. F-actin promotes (1) RRP replenishment likely by facilitating active zone clearance, (2) fusion pore expansion by enhancing the plasma membrane tension, (3) shrink fusion by providing membrane tension to reel of fusing vesicular membrane, and (4) endocytosis likely by generating forces needed for pit formation. Actin nucleation factors, including Kv3.3, N-WASP, Arp2/3, myosin II, and formin are also involved in these processes. This cartoon represents a synthesis of many suggestions derived from the many studies discussed in this review.

Similar articles

Cited by

References

    1. Alabi A. A., Tsien R. W. (2013). Perspectives on kiss-and-run: role in exocytosis, endocytosis, and neurotransmission. Annu. Rev. Physiol. 75 393–422. 10.1146/annurev-physiol-020911-153305 - DOI - PubMed
    1. Aunis D., Bader M. F. (1988). The cytoskeleton as a barrier to exocytosis in secretory cells. J. Exp. Biol. 139 253–266. 10.1242/jeb.139.1.253 - DOI - PubMed
    1. Balaji J., Ryan T. A. (2007). Single-vesicle imaging reveals that synaptic vesicle exocytosis and endocytosis are coupled by a single stochastic mode. Proc. Natl. Acad. Sci. U.S.A 104 20576–20581. 10.1073/pnas.0707574105 - DOI - PMC - PubMed
    1. Berberian K., Torres A. J., Fang Q., Kisler K., Lindau M. (2009). F-actin and myosin II accelerate catecholamine release from chromaffin granules. J. Neurosci. 29 863–870. 10.1523/JNEUROSCI.2818-08.2009 - DOI - PMC - PubMed
    1. Bleckert A., Photowala H., Alford S. (2012). Dual pools of actin at presynaptic terminals. J. Neurophysiol. 107 3479–3492. 10.1152/jn.00789.2011 - DOI - PMC - PubMed

LinkOut - more resources