. 2022 Mar 2:13:757961.
doi: 10.3389/fpsyt.2022.757961. eCollection 2022.

Dynamic Tracking of State Anxiety via Multi-Modal Data and Machine Learning

Affiliations

Dynamic Tracking of State Anxiety via Multi-Modal Data and Machine Learning

Yue Ding et al. Front Psychiatry. .

Abstract

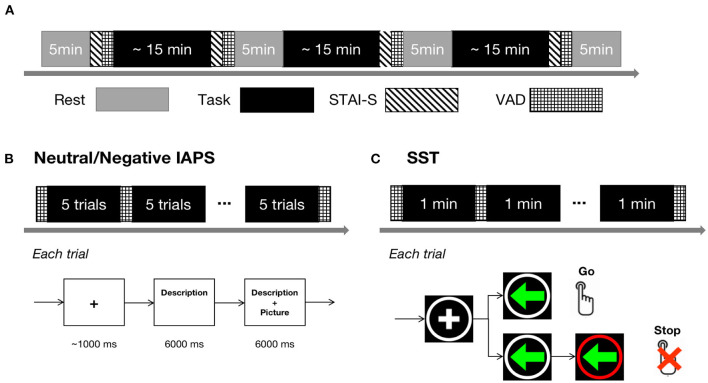
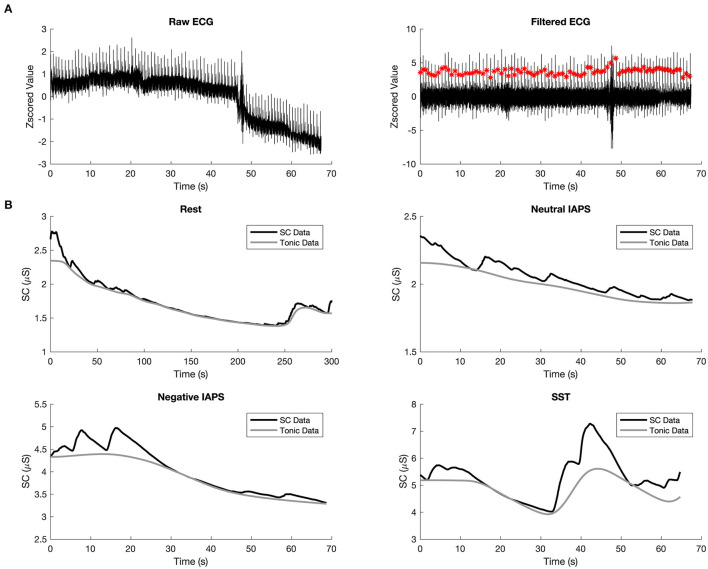
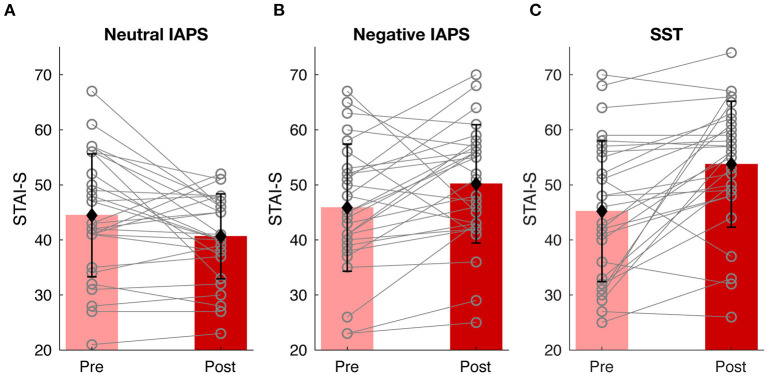
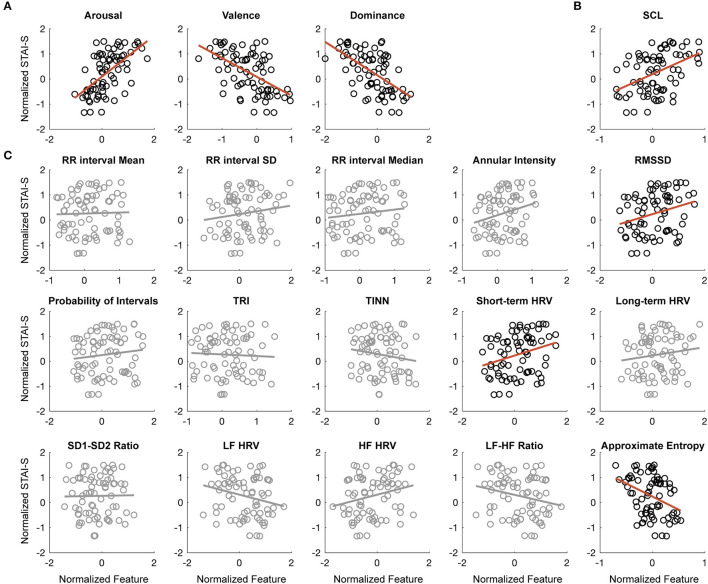
Anxiety induction is widely used in the investigations of the mechanism and treatment of state anxiety. State anxiety is accompanied by immediate psychological and physiological responses. However, the existing state anxiety measurement, such as the commonly used state anxiety subscale of the State-Trait Anxiety Inventory, mainly relies on questionnaires with low temporal resolution. This study aims to develop a tracking model of state anxiety with high temporal resolution. To capture the dynamic changes of state anxiety levels, we induced the participants' state anxiety through exposure to aversive pictures or the risk of electric shocks and simultaneously recorded multi-modal data, including dimensional emotion ratings, electrocardiogram, and galvanic skin response. Using the paired self-reported state anxiety levels and multi-modal measures, we trained and validated machine learning models to predict state anxiety based on psychological and physiological features extracted from the multi-modal data. The prediction model achieved a high correlation between the predicted and self-reported state anxiety levels. This quantitative model provides fine-grained and sensitive measures of state anxiety levels for future affective brain-computer interaction and anxiety modulation studies.

Keywords: dynamic tracking; machine learning; physiological feature; psychological feature; quantitative modeling; state anxiety.


Conflict of interest statement

The authors declare that the research was conducted in the absence of any commercial or financial relationships that could be construed as a potential conflict of interest.

Figures

Figure 1
Figure 1
Experimental procedure. (A) Overall experimental procedure. The gray blocks represent rest conditions and the black blocks represent task conditions, including Neutral IAPS, Negative IAPS, and SST. The blocks indicated with diagonal lines represent STAI-S sessions and the blocks marked with grids represent VAD rating sessions. (B) Experiment design of Neutral/Negative IAPS. The upper panel shows the temporal structure of a block and the bottom panel shows the temporal structure of a trial. (C) Experiment design of the SST task. The upper panel shows the temporal structure of a block and the bottom panel shows the temporal structure of a go or stop trial.
Figure 2
Figure 2
Preprocessing of ECG and GSR. (A) Example waveform of raw ECG (left) and filtered ECG (right), the red dots indicate detected beats. (B) Example waveform of denoised skin conductance data (in black) and the tonic component of GSR (in gray) in rest (top left), Neutral IAPS (top right), Negative IAPS (bottom left), and SST (bottom right).
Figure 3
Figure 3
Behavioral results. State anxiety level changes of Neutral IAPS (A), Negative IAPS (B), and SST (C). In each condition, the pink and red bars show the mean value of STAI-S scores before and after tasks, the black error bars represent the standard deviation of STAI-S scores, and the gray lines indicate alteration from pre-task to post-task for each participant.
Figure 4
Figure 4
The correlation between STAI-S and physiological and psychological features. (A) Correlation between arousal (left), valence (middle), dominance (right) ratings, and STAI-S scores. (B) Correlation between SCL and STAI-S scores. (C) Correlation between 15 HRV features and STAI-S scores. The circle points are samples and the red lines are the linear fitting lines. The non-significant correlations were shadowed in gray.
Figure 5
Figure 5
Prediction of STAI-S using multi-modal data. (A) Correlation between predicted STAI-S and actual STAI-S using all the features in the LASSO regression model. (B) Sorted predictor importance estimates of the LASSO regression model when using all the features. (C) Correlation between predicted STAI-S and actual STAI-S using only physiological features. (D) Sorted predictor importance estimates of the LASSO regression model when using only physiological features. The error bars represent standard deviation across participants in the “leave one subject out” validation.

Similar articles

Cited by

References

    1. Gross C, Hen R. The developmental origins of anxiety. Nat Rev Neurosci. (2004) 5:545–52. 10.1038/nrn1429 - DOI - PubMed
    1. Hur J, Stockbridge MD, Fox AS, Shackman AJ. Dispositional negativity, cognition, and anxiety disorders: an integrative translational neuroscience framework. Prog Brain Res. (2019) 247:375–436. 10.1016/bs.pbr.2019.03.012 - DOI - PMC - PubMed
    1. Tovote P, Fadok JP, Lüthi A. Neuronal circuits for fear and anxiety. Nat Rev Neurosci. (2015) 16:317–31. 10.1038/nrn3945 - DOI - PubMed
    1. Bandelow B, Michaelis S. Epidemiology of anxiety disorders in the 21st century. Dialogues Clin Neurosci. (2015) 17:327–35. 10.31887/DCNS.2015.17.3/bbandelow - DOI - PMC - PubMed
    1. World Health Organization . Depression and Other Common Mental Disorders: Global Health Estimates. WHO/MSD/MER/2017.2 (2017), 1–24. Available online at: https://apps.who.int/iris/bitstream/handle/10665/254610/W?sequence=1 (accessed December 17, 2021).

LinkOut - more resources