

Economic costs of childhood stunting to the private sector in low- and middle-income countries
- PMID: 35308896
- PMCID: PMC8927824
- DOI: 10.1016/j.eclinm.2022.101320
Economic costs of childhood stunting to the private sector in low- and middle-income countries
Abstract
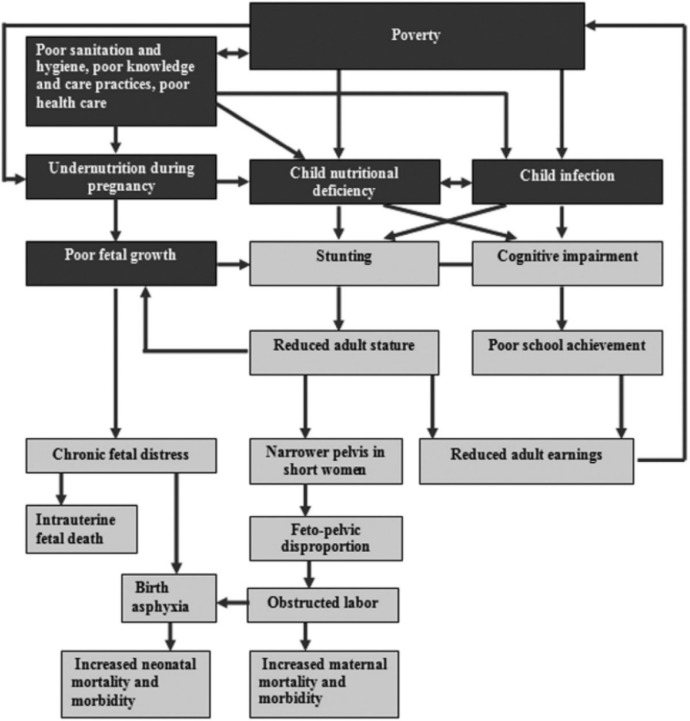
Background: Stunting during childhood has long-term consequences on human capital, including decreased physical growth, and lower educational attainment, cognition, workforce productivity and wages. Previous research has quantified the costs of stunting to national economies however beyond a few single-country datasets there has been a limited number of which have used diverse datasets and have had a dedicated focus on the private sector, which employs nearly 90% of the workforce in many low- and middle-income countries (LMICs). We aimed to examine (i) the impact of childhood stunting on income loss of private sector workforce in LMICs; (ii) to quantify losses in sales to private firms in LMICs due to childhood stunting; and (iii) to estimate potential gains (benefit-cost ratios) if stunting levels are reduced in select high prevalence countries.
Methods: This multiple-methods study engaged multi-disciplinary technical advisers, executed several literature reviews, used innovative statistical methods, and implemented health and labor economic models. We analyzed data from seven longitudinal datasets (up to 30+ years of follow-up; 1982-2016; Peru, Ethiopia, India, Vietnam, Philippines, Tanzania, Brazil), 108 private firm datasets (spanning 2008-2020), and many global datasets including Joint Malnutrition Estimates, and World Development Indicators to produce estimates for 120+ LMICs (with estimates up to 2021). We studied the impact of childhood stunting on adult cognition, education, and height as pathways to wages/productivity in adulthood. We employed cloud-based artificial intelligence (AI) platforms, and conducted comparative analyses using three analytic approaches: traditional frequentist statistics, Bayesian inferential statistics and machine learning. We employed labour and health economic models to estimate wage losses to the private sector worker and firm revenue losses due to stunting. We also estimated benefit-cost ratios for countries investing in nutrition-specific interventions to prevent stunting.
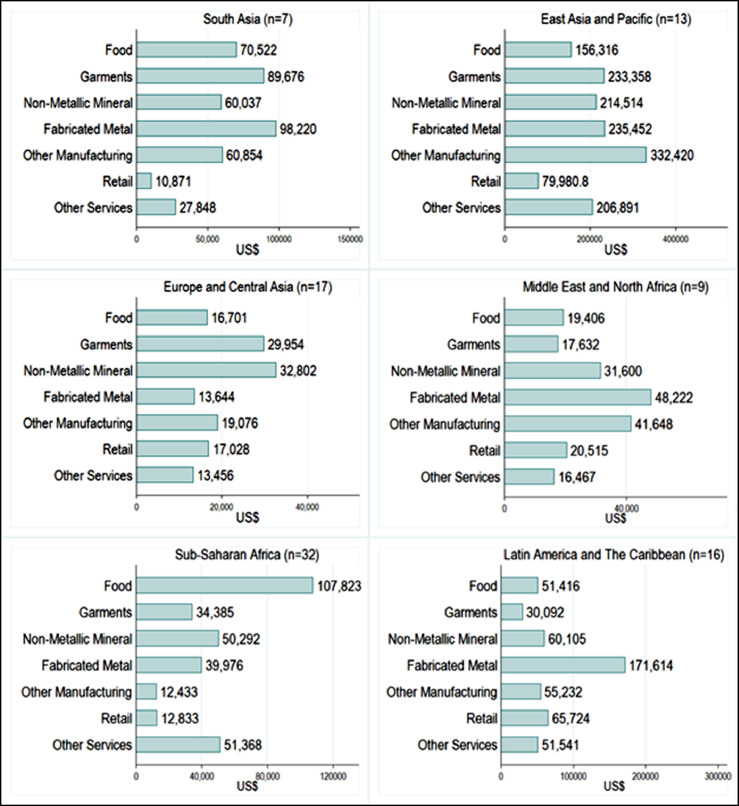
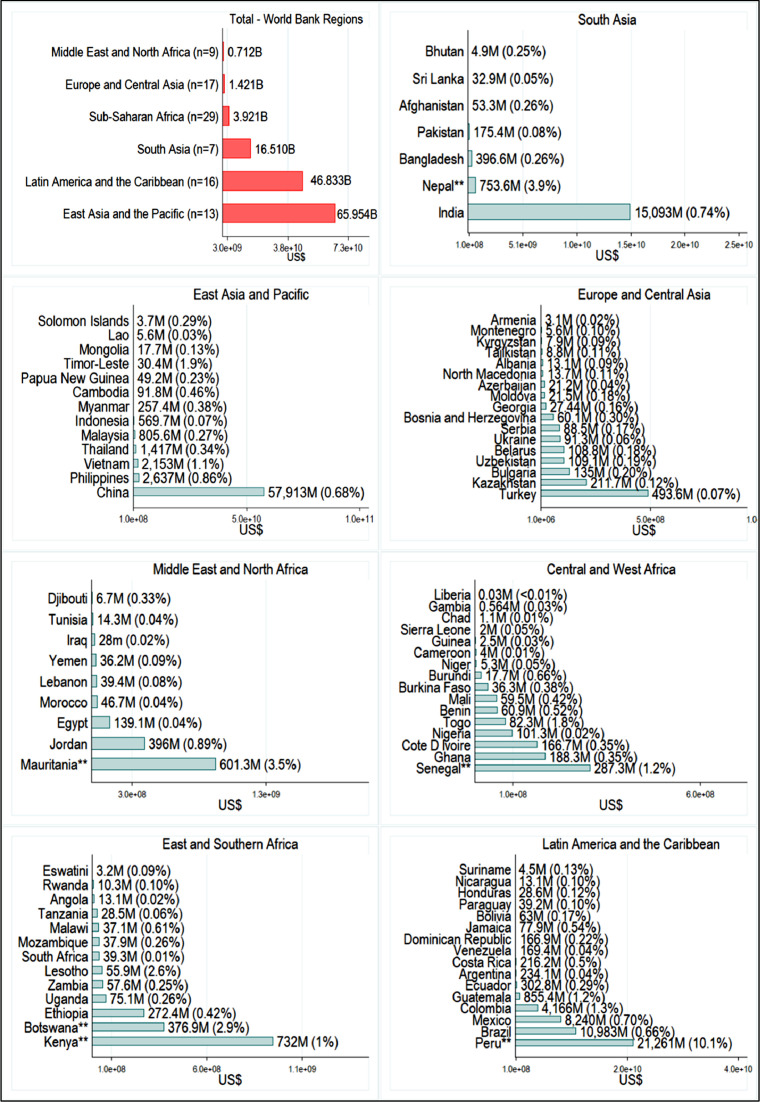
Findings: Across 95 LMICs, childhood stunting costs the private sector at least US$135.4 billion in sales annually. Firms from countries in Latin America and the Caribbean and East Asia and Pacific regions had the greatest losses. Totals sales losses to the private sector accumulated to 0.01% to 1.2% of national GDP across countries. Sectors most affected by childhood stunting were manufacturing (non-metallic mineral, fabricated metal, other), garments and food sectors. Sale losses were highest for larger sized private firms. Across regions (representing 123 LMICs), US$700 million (Middle East and North Africa) to US$16.5 billion (East Asia and Pacific) monthly income was lost among private sector workers. Investing in stunting reduction interventions yields gains from US$2 to US$81 per $1 invested annually (or 100% to 8000% across countries). Across sectors, the highest returns were in elementary occupations (US$46) and the lowest were among agricultural workers (US$8). By gender, women incurred a higher income penalty from childhood stunting and earned less than men; due to their relatively higher earnings, the returns for investing in stunting reduction were consistently higher for men across most countries studied.
Interpretation: Childhood stunting costs the private sector in LMICs billions of dollars in sales and earnings for the workforce annually. Returns to nutrition interventions show that there is an economic case to be made for investing in childhood nutrition, alongside a moral one for both the public and private sector. This research could be used to motivate strong public-private sector partnerships to invest in childhood undernutrition for benefits in the short and long-term.
Keywords: Children; Costs; Economy; Low and middle income; Private sector; Stunting.
© 2022 The Author(s).
Conflict of interest statement
Nikita Japra is a current employee of Patrick J. McGovern Foundation (funder) and former employee of Cloudera Foundation (funder). NJ served as the program officer for the grant that funded this work while employed by Cloudera Foundation/Patrick J. McGovern Foundation (funder). Kerri Wazny was an employee of The Power of Nutrition (funder) during the work.
Figures
References
-
- UNICEF . UNICEF Publications; 2020. Nutrition, for Every Child UNICEF Nutrition Strategy 2020–2030; pp. 1–98.
-
- WHO . WHO; Geneva: 2010. Nutrition Landscape Information System (NLIS) Country Profile: Interpretation Guide.
-
- Wellesley L., Eis J., Marijs C., Vexler C., Waites F., Benton T.G. The business case for investment in nutrition. Chatham House, The Royal Institute of International Affairs; 2020.
-
- PATH and MQSUN+, Where business and nutrition meet review of approaches and evidence on private sector engagement in nutrition. Washington, DC; 2018.
-
- Shekar M., Kakietek J., Eberwein J.D., Walters D. An investment framework for nutrition: reaching the global targets for stunting, anemia, breastfeeding, and wasting. 2017.
LinkOut - more resources
Full Text Sources
