

The Addition of United States Census-Tract Data Does Not Improve the Prediction of Substance Misuse
- PMID: 35308901
- PMCID: PMC8861711
The Addition of United States Census-Tract Data Does Not Improve the Prediction of Substance Misuse
Abstract
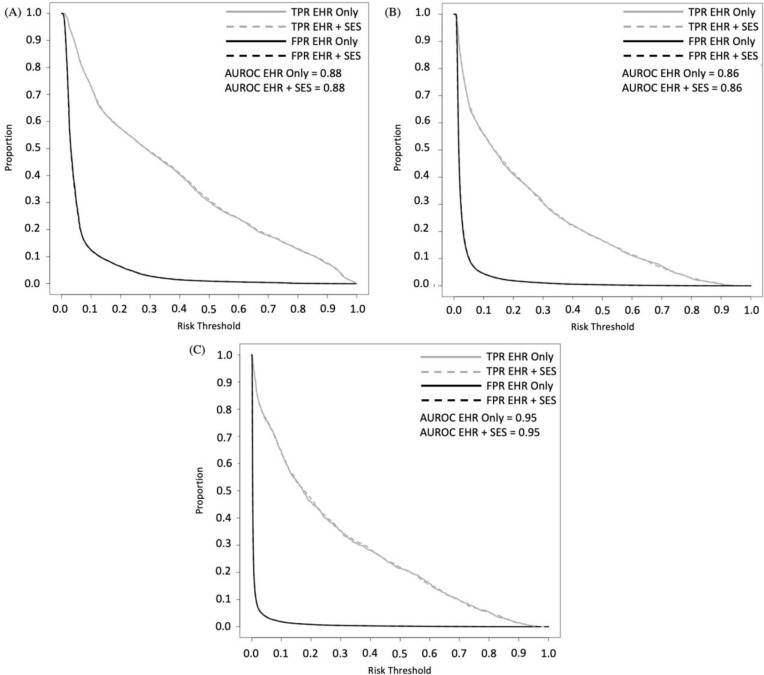
Predictors from the structured data in the electronic health record (EHR) have previously been used for case-identification in substance misuse. We aim to examine the added benefit from census-tract data, a proxy for socioeconomic status, to improve identification. A cohort of 186,611 hospitalizations was derived between 2007 and 2017. Reference labels included alcohol misuse only, opioid misuse only, and both alcohol and opioid misuse. Baseline models were created using 24 EHR variables, and enhanced models were created with the addition of 48 census-tract variables from the United States American Community Survey. The absolute net reclassification index (NRI) was applied to measure the benefit in adding census-tract variables to baseline models. The baseline models already had good calibration and discrimination. Adding census-tract variables provided negligible improvement to sensitivity and specificity and NRI was less than 1% across substance groups. Our results show the census-tract added minimal value to prediction models.
©2021 AMIA - All rights reserved.
Figures
References
-
- Fingar KR, Barrett ML, Jiang JH. Comparison of All-Cause 7-Day and 30-Day Readmissions, 2014. The HCUP Report : Healthcare Cost and Utilization Project (HCUP): Statistical Briefs. 2017. ASI 4186-20.230;Statistical Brief No. 230. 2017.
MeSH terms
Grants and funding
LinkOut - more resources
Full Text Sources
Medical