. 2022 Feb 21:2021:265-274.
eCollection 2021.

Using Machine Learning to Support Transfer of Best Practices in Healthcare

Affiliations

Using Machine Learning to Support Transfer of Best Practices in Healthcare

Sebastian Caldas et al. AMIA Annu Symp Proc. .

Abstract

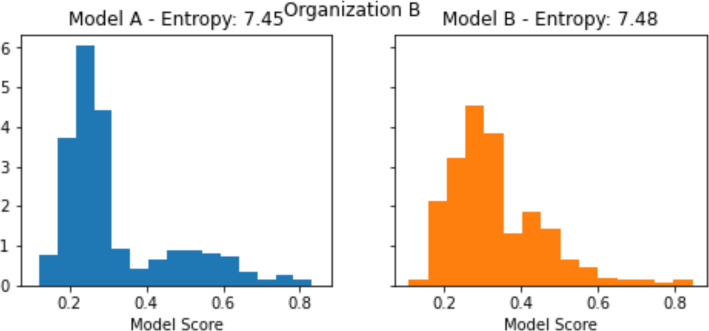
The adoption of best practices has been shown to increase performance in healthcare institutions and is consistently demanded by both patients, payers, and external overseers. Nevertheless, transferring practices between healthcare organizations is a challenging and underexplored task. In this paper, we take a step towards enabling the transfer of best practices by identifying the likely beneficial opportunities for such transfer. Specifically, we analyze the output of machine learning models trained at different organizations with the aims of (i) detecting the opportunity for the transfer of best practices, and (ii) providing a stop-gap solution while the actual transfer process takes place. We show the benefits ofthis methodology on a dataset ofmedical inpatient claims, demonstrating our abilityto identify practice gaps and to support the transfer processes that address these gaps.


Figures

Figure 1.
Figure 1.
Illustration of our proposed strategy to identify potential practice gaps. Consider two organizations, A and B, each one with its own classification model of some practice: model A and model B, respectively. When we use both models on the data from organization A, the resulting distribution of scores will have different entropies. We use this difference in entropy as a proxy to indicate a potential knowledge or practice gap. In this example, the entropy from model A is greater than the entropy from model B. Thus, we will consider organization B to have a more consistent practice than organization A, and we will recommend a transfer of B’s practice to A.
Figure 2.
Figure 2.
ROC curves for our motivating example. We plot the false positive rate in logarithmic scale for visibility.
Figure 3.
Figure 3.
Score distributions for our motivating example. Model A is more confident in its predictions than model B when evaluating both models at Organization B. This is reflected in a lower entropy for model A.
Figure 4.
Figure 4.
TNR @ 90% TPR for the trained models. Each model is tested on data from the organization where it was trained. The error bars reflect 95% bootstrap confidence intervals, for which we performed 1,000 resamplings. Note that except for a couple of DRGs, results of these models on their own data are not statistically discernible.
Figure 5.
Figure 5.
Differences in performance when model A and model B are used in the same organization. The presented differences correspond to the performance of the local model minus the performance of the external one. Error bars correspond to bootstrap confidence intervals. We maintain an overall confidence coefficient of 95%, using Bonferroni’s method to correct for making multiple comparisons.
Figure 6.
Figure 6.
Confidence intervals for difference in entropy. The presented differences correspond to the entropy of the local model minus the entropy of the external one. Error bars were drawn in a similar fashion as in Figure 5. We do not plot DRG 392 - Organization A nor DRG 765 - Organization B, as we had already discarded the potential existence of a knowledge gap for these cases due to a difference in model performance.
Figure 7.
Figure 7.
Differences in performance and differences in entropy when controlling for sample size. Differences shown correspond to the output of the local model minus the output of the external one. Error bars correspond to confidence intervals where we maintain an overall confidence coefficient of 95% and apply a Bonferroni correction. We construct these intervals by assuming normality in the distribution of the differences. We only plot those DRGs and organizations for which we had identified a potential knowledge or practice gap, as shown in Table 2.

Similar articles

References

    1. Berta WB, Baker R. Factors that impact the transfer and retention of best practices for reducing error in hospitals. Health Care Management Review. 2004 Apr 1;29(2):90–7. - PubMed
    1. Tsoukas H, Vladimirou E. What is organizational knowledge? J. Management Studies. 2001 Nov;38(7):973–93.
    1. Guzman G, Fitzgerald JA, Fulop L, Hayes K, Poropat A, Avery M, Campbell S, Fisher R, Gapp R, Herington C, McPhail R. How best practices are copied, transferred, or translated between health care facilities: a conceptual framework. Health Care Management Review. 2015 Jul 1;40(3):193–202. - PubMed
    1. Elwyn G, Taubert M, Kowalczuk J. Sticky knowledge: a possible model for investigating implementation in healthcare contexts. Implementation Science. 2007 Dec;2(1):1–8. - PMC - PubMed
    1. Perleth M, Jakubowski E, Busse R. What is ‘best practice’ in health care? State of the art and perspectives in improving the effectiveness and efficiency of the European health care systems. Health Policy. 2001 Jun 1;56(3):235–50. - PubMed