

Unpacking the Drop in COVID-19 Case Fatality Rates: A Study of National and Florida Line-Level Data
- PMID: 35308980
- PMCID: PMC8861724
Unpacking the Drop in COVID-19 Case Fatality Rates: A Study of National and Florida Line-Level Data
Abstract
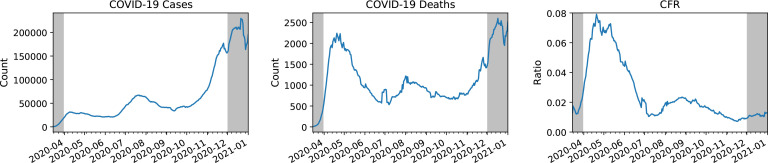
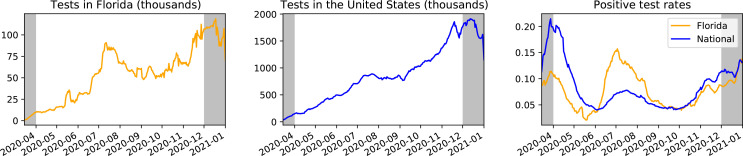
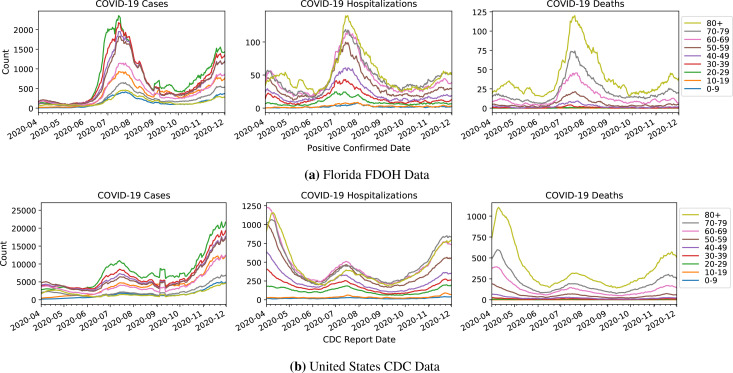
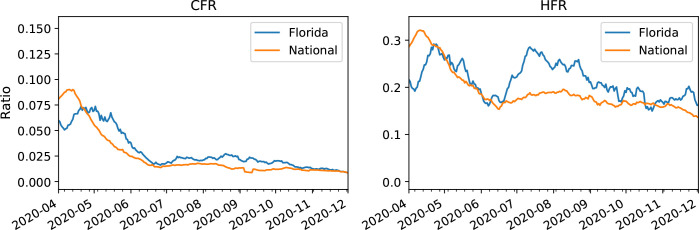
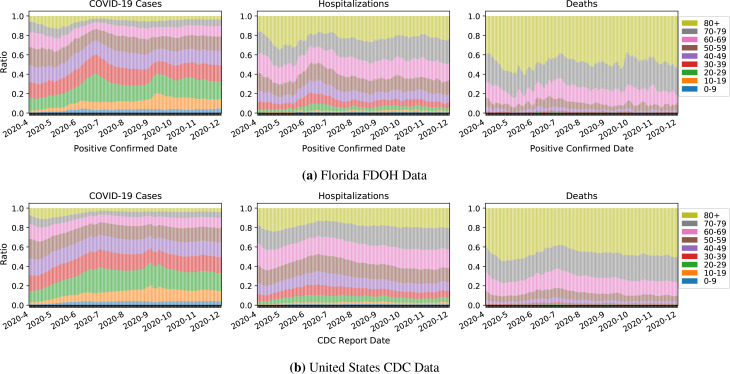
Since the COVID-19 pandemic began, the United States's case fatality rate (CFR) has plummeted. Using national and Florida data, we unpack the drop in CFR between April and December 2020, accounting for such confounders as expanded testing, age distribution shift, and detection-to-death lags. Guided by the insight that treatment improvements in this period should correspond to decreases in hospitalization fatality rate (HFR), and using a block-bootstrapping procedure to quantify uncertainty, we find that although treatment improvements do not follow the same trajectory in Florida and nationally (with Florida undergoing a comparatively severe second peak), by December, significant improvements are observed both in Florida and nationally (at least 17% and 55% respectively). These estimates paint a more realistic picture of improvements than the drop in aggregate CFR (70.8%-91.1%). We publish a website where users can apply our analyses to selected demographics, regions, and dates of interest.
©2021 AMIA - All rights reserved.
Figures
Similar articles
-
Changing COVID-19 cases and deaths detection in Florida.PLoS One. 2024 Mar 28;19(3):e0299143. doi: 10.1371/journal.pone.0299143. eCollection 2024. PLoS One. 2024. PMID: 38547145 Free PMC article.
-
Geographic disparities in COVID-19 testing and outcomes in Florida.BMC Public Health. 2023 Jan 11;23(1):79. doi: 10.1186/s12889-022-14450-9. BMC Public Health. 2023. PMID: 36631768 Free PMC article.
-
Decreased Case Fatality Rate of COVID-19 in the Second Wave: A study in 53 countries or regions.Transbound Emerg Dis. 2021 Mar;68(2):213-215. doi: 10.1111/tbed.13819. Epub 2020 Sep 17. Transbound Emerg Dis. 2021. PMID: 32892500
-
Health related factors contributing to COVID-19 fatality rates in various communities across the world.J Infect Dev Ctries. 2021 Sep 30;15(9):1263-1272. doi: 10.3855/jidc.13876. J Infect Dev Ctries. 2021. PMID: 34669594 Review.
-
Early epidemiological indicators, outcomes, and interventions of COVID-19 pandemic: A systematic review.J Glob Health. 2020 Dec;10(2):020506. doi: 10.7189/jogh.10.020506. J Glob Health. 2020. PMID: 33110589 Free PMC article.
Cited by
-
SARS-CoV-2 serology across scales: a framework for unbiased seroprevalence estimation incorporating antibody kinetics and epidemic recency.medRxiv [Preprint]. 2021 Sep 14:2021.09.09.21263139. doi: 10.1101/2021.09.09.21263139. medRxiv. 2021. Update in: Am J Epidemiol. 2023 Sep 1;192(9):1562-1575. doi: 10.1093/aje/kwad106. PMID: 34545373 Free PMC article. Updated. Preprint.
-
SARS-CoV-2 Serology Across Scales: A Framework for Unbiased Estimation of Cumulative Incidence Incorporating Antibody Kinetics and Epidemic Recency.Am J Epidemiol. 2023 Sep 1;192(9):1562-1575. doi: 10.1093/aje/kwad106. Am J Epidemiol. 2023. PMID: 37119030 Free PMC article.
References
-
- Thompson Derek. Covid-19 cases are rising, so why are deaths flatlining? 2020.
-
- Whet M. Why Changing COVID-19 Demographics in the US Make Death Trends Harder to Understand. 2020.
-
- Horwitz Leora, et al. Trends in covid-19 risk-adjusted mortality rates in a single health system. medRxiv. 2020. - PubMed
-
- Fan Guihong, et al. Decreased case fatality rate of covid-19 in the second wave: A study in 53 countries or regions. Transboundary and emerging diseases. 2020. - PubMed
MeSH terms
LinkOut - more resources
Full Text Sources
Medical
Miscellaneous