. 2022 Mar 3:9:780626.
doi: 10.3389/fchem.2021.780626. eCollection 2021.

Lipid Analysis of Fracture Hematoma With MALDI-MSI: Specific Lipids are Associated to Bone Fracture Healing Over Time

Affiliations

Lipid Analysis of Fracture Hematoma With MALDI-MSI: Specific Lipids are Associated to Bone Fracture Healing Over Time

Rald V M Groven et al. Front Chem. .

Abstract

Background: Fracture healing is a complex process, involving cell-cell interactions, various cytokines, and growth factors. Although fracture treatment improved over the last decades, a substantial part of all fractures shows delayed or absent healing. The fracture hematoma (fxh) is known to have a relevant role in this process, while the exact mechanisms by which it influences fracture healing are poorly understood. To improve strategies in fracture treatment, regulatory pathways in fracture healing need to be investigated. Lipids are important molecules in cellular signaling, inflammation, and metabolism, as well as key structural components of the cell. Analysis of the lipid spectrum in fxh may therefore reflect important events during the early healing phase. This study aims to develop a protocol for the determination of lipid signals over time, and the identification of lipids that contribute to these signals, with matrix-assisted laser desorption/ionization mass spectrometry imaging (MALDI-MSI) in fxh in healthy fracture healing. Methods: Twelve fxh samples (6 porcine; 6 human) were surgically removed, snap frozen, sectioned, washed, and analyzed using MALDI-MSI in positive and negative ion mode at different time points after fracture (porcine: 72 h; human samples: range 1-19 days). A tissue preparation protocol for lipid analysis in fxh has been developed with both porcine and human fxh. Data were analyzed through principal component- and linear discriminant analyses. Results: A protocol for the preparation of fxh sections was developed and optimized. Although hematoma is a heterogeneous tissue, the intra-variability within fxh was smaller than the inter-variability between fxh. Distinctive m/z values were detected that contributed to the separation of three different fxh age groups: early (1-3 days), middle (6-10 days), and late (12-19 days). Identification of the distinctive m/z values provided a panel of specific lipids that showed a time dependent expression within fxh. Conclusion: This study shows that MALDI-MSI is a suitable analytical tool for lipid analysis in fxh and that lipid patterns within fxh are time-dependent. These lipid patterns within fxh may serve as a future diagnostic tool. These findings warrant further research into fxh analysis using MALDI-MSI and its possible clinical implications in fracture treatment.

Keywords: MALDI-MSI; fracture healing; fracture hematoma; lipids; sample preparation.


Conflict of interest statement

The authors declare that the research was conducted in the absence of any commercial or financial relationships that could be construed as a potential conflict of interest.

Figures

FIGURE 1
FIGURE 1
General MALDI-MSI workflow, applied to fracture hematoma analysis. The fxh was surgically removed and snap frozen in liquid nitrogen. The fxh was cryo-sectioned and thaw mounted on ITO slides. The slides were washed by submerging them in either ammonium formate or acetone. Afterwards, norharmane was homogenously sprayed onto the slides. The coated slides were analyzed by MALDI-MSI after which the data were processed and visualized.
FIGURE 2
FIGURE 2
Comparison of the ratios between heme and selected m/z values for different washing methods for negative and positive ion mode for porcine and human fracture hematoma. The ratios represent the ion intensities of selected m/z values over the heme ion intensity. The m/z values were selected based on the highest intensities (excluding isotopes) and to cover the mass range of lipids (m/z 650–950). (A) Ratios for 10 m/z values for the six washing methods and the control (no washing) for porcine fxh in negative ion mode. (B) Ratios for 10 m/z values for the three washing methods and the control (no washing) for porcine fxh in positive ion mode. (C) Ratios for 10 m/z values for the six washing methods and the control (no washing) for human fxh in negative ion mode. (D) Ratios for 10 m/z values for the three washing methods and the control (no washing) for human fxh in positive ion mode.
FIGURE 3
FIGURE 3
H&E stained and MALDI-MSI distribution images for three different washing methods for human fxh. MALDI-MSI images are shown for the distribution of heme (m/z 615.2) and lipids with m/z values 885.6 and 788.6 in negative ion mode for the washing methods: ammonium formate for 30 s (left column), ammonium formate for 15 s twice (middle column), and acetone for 30 s twice (right column). All shown intensities are total ion current (TIC) normalized.
FIGURE 4
FIGURE 4
DF-1 scores for comparison of the intra-variability of fracture hematoma for negative and positive ion mode. The DF-1 score explains the biggest variance in the data set as determined by a PCA-LDA of the mass spectra of the outside and center sections of different porcine fxh. (A) DF-1 score for the outside and center sections of four porcine fxh in negative ion mode. (B) DF-1 score for the outside and center sections of four porcine fxh in positive ion mode.
FIGURE 5
FIGURE 5
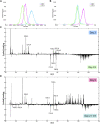
Results of the PCA-LDA of the human fxh of different fxh age (2, 9, and 19 days) for negative ion mode. DF-scores and their corresponding scaled loading plots are shown. The scaled loading is a combination of the intensity of the m/z value with how much the molecule contributes to the separation of classes across the specified discriminant function. The positive side for the DF-score plot is related to the positive side of the scaled loading plots. This indicates that the m/z values at a certain side have a higher contribution in the class at that side. (A) DF-1 score representing the first discriminant function, which corresponds to the highest variance in the dataset. (B) The DF-2 score representing the second discriminant function. (C) Scaled loading plot of the full mass range for DF-1. (D) Scaled loading plot of the full mass range for DF-2.
FIGURE 6
FIGURE 6
Results of the PCA-LDA of the human fxh of different fxh age (2, 9, and 19 days) for positive ion mode. DF-scores and their corresponding scaled loading plots are shown. The scaled loading is a combination of the intensity of the m/z value with how much the molecule contributes to the separation of classes across the specified discriminant function. The positive side for the DF-score plot is related to the positive side of the scaled loading plots. This indicates that the m/z values at a certain side have a higher contribution in the class at that side. (A) DF-1 score representing the first discriminant function, which corresponds to the highest variance in the dataset. (B) The DF-2 score representing the second discriminant function. (C) Scaled loading plot of the full mass range for DF-1. (D) Scaled loading plot of the full mass range for DF-2.

Similar articles

Cited by

References

    1. Aichler M., Walch A. (2015). MALDI Imaging Mass Spectrometry: Current Frontiers and Perspectives in Pathology Research and Practice. Lab. Invest. 95 (4), 422–431. 10.1038/labinvest.2014.156 - DOI - PubMed
    1. Albaugh V. L., Mukherjee K., Barbul A. (2017). Proline Precursors and Collagen Synthesis: Biochemical Challenges of Nutrient Supplementation and Wound Healing. J. Nutr. 147 (11), jn256404–7. 10.3945/jn.117.256404 - DOI - PMC - PubMed
    1. Alekos N. S., Moorer M. C., Riddle R. C. (2020). Dual Effects of Lipid Metabolism on Osteoblast Function. Front. Endocrinol. 11, 578194. 10.3389/fendo.2020.578194 - DOI - PMC - PubMed
    1. Angel P. M., Spraggins J. M., Baldwin H. S., Caprioli R. (2012). Enhanced Sensitivity for High Spatial Resolution Lipid Analysis by Negative Ion Mode Matrix Assisted Laser Desorption Ionization Imaging Mass Spectrometry. Anal. Chem. 84 (3), 1557–1564. 10.1021/ac202383m - DOI - PMC - PubMed
    1. Antal C. E., Newton A. C. (2013). Spatiotemporal Dynamics of Phosphorylation in Lipid Second Messenger Signaling. Mol. Cel. Proteomics 12 (12), 3498–3508. 10.1074/mcp.R113.029819 - DOI - PMC - PubMed

LinkOut - more resources