. 2022 Mar 3:13:835766.
doi: 10.3389/fphys.2022.835766. eCollection 2022.

Muscle Fatigue and Swimming Efficiency in Behind and Lateral Drafting

Affiliations

Muscle Fatigue and Swimming Efficiency in Behind and Lateral Drafting

Luca Puce et al. Front Physiol. .

Abstract

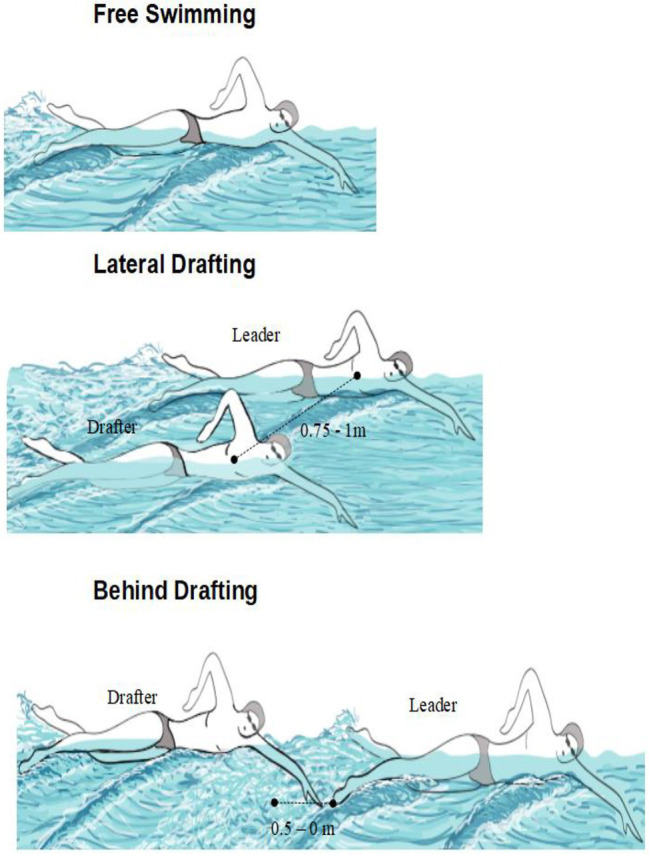
Drafting in swimming is a tactic in which an athlete (drafter) swims in the wave of another athlete (leader). Our aim was to compare the effects of this tactic on the drafter, as far as muscle fatigue, muscle activity, and swimming efficiency are concerned. Fifteen drafters performed three 200 m front crawl trials at a controlled submaximal pace in three configurations: Behind Drafting (BD), Lateral Drafting (LD), and Free Swimming (FS). Muscle fatigue, muscle activity, and swimming efficiency were obtained by surface electromyography (EMG) and video analysis from flexor carpi radialis, triceps brachii, latissimus dorsi, and rectus femoris muscles. The outcome measures were: time slope of Mean Frequency (MNF), for muscle fatigue; time slope of Root Mean Square (RMS), for muscle activity; and Stroke Index (SI) for swimming efficiency. Negative variations of MNF were 5.1 ± 1.7%, 6.6 ± 4.1%, and 11.1 ± 2.7% in BD, LD, and FS, respectively. Statistical significance was found for all cases except for the rectus femoris. Positive variations of RMS were 3.4 ± 1.2%, 4.7 ± 2.7%, and 7.8 ± 4.6% in BD, LD, and FS, respectively. Statistical significance was found only for the slopes of latissimus dorsi in FS and LD. The largest mean in SI was measured in the BD (2.01 m2/s), while the smallest was measured in the FS (1.86 m2/s). BD was found to be the best swimming configuration, in terms of lower muscle fatigue and higher swimming efficiency. Also, LD resulted to be advantageous with respect to FS.

Keywords: hydrodynamic interactions; motor units; open water; surface electromyography; training; triathlon.


Conflict of interest statement

The authors declare that the research was conducted in the absence of any commercial or financial relationships that could be construed as a potential conflict of interest.

Figures

Figure 1
Figure 1
Sketch of experimental design. The timeline of the study is the following: (1) week-long training to learn to follow the metronome pace and keep the correct position in the drafting configurations; (2) randomization of the participants in the different swimming configurations; (3) three 200 m front crawl trials, each trial in different swimming configurations. Each trial was preceded by a warm-up with a 30-min recovery between successive trials.
Figure 2
Figure 2
Sketch of the reciprocal position of drafter and leader in the three configurations of the experiment.
Figure 3
Figure 3
Normalized slopes of Mean Frequency (MNF) for each of the four muscles and for each of the three swimming configurations, averaged over the participants. In the right-hand axis, the corresponding percent variations in the 200 m test are indicated. Statistical significance of average slopes and of difference between average slopes among two or three configurations is indicated by asterisks (* for p < 0.05, ** for p < 0.001, and *** for p < 0.0001).
Figure 4
Figure 4
Normalized slopes of Root Mean Square (RMS) for each of the four muscles and for each of the three swimming configurations, averaged over the participants. In the right-hand axis, the corresponding percent variations in the 200 m test are indicated. Statistical significance of average slopes is indicated by asterisks (* for p < 0.05).
Figure 5
Figure 5
Stroke Index (SI) for each of the three swimming configurations, averaged determined in the free-swimming segment (i.e., from the 10th to the 20th m of the pool).

Similar articles

Cited by

References

    1. Arfaoui A., Polidori G. (2014). Swimming drafting simulation using a k-ω turbulence model. Comput. Methods Biomech. Biomed. Engin. 17, 156–157. doi: 10.1080/10255842.2014.931620, PMID: - DOI - PubMed
    1. Bassett D. R., Flohr J., Duey W. J., Howley E. T., Pein R. L. (1991). Metabolic responses to drafting during front crawl swimming. Med. Sci. Sports Exerc. 23, 744–747. doi: 10.1249/00005768-199106000-00015, PMID: - DOI - PubMed
    1. Bentley D. J., Libicz S., Jougla A., Coste O., Manetta J., Chamari K., et al. . (2007). The effects of exercise intensity or drafting during swimming on subsequent cycling performance in triathletes. J. Sci. Med. Sport 10, 234–243. doi: 10.1016/j.jsams.2006.05.004, PMID: - DOI - PubMed
    1. Bigland-Ritchie B., Johansson R., Lippold O. C., Woods J. J. (1983). Contractile speed and EMG changes during fatigue of sustained maximal voluntary contractions. J. Neurophysiol. 50, 313–324. doi: 10.1152/jn.1983.50.1.313, PMID: - DOI - PubMed
    1. Brody L. R., Pollock M. T., Roy S. H., De Luca C. J., Celli B. (1991). pH-induced effects on median frequency and conduction velocity of the myoelectric signal. J. Appl. Physiol. 71, 1878–1885. doi: 10.1152/jappl.1991.71.5.1878, PMID: - DOI - PubMed