

Tissue Cytometry With Machine Learning in Kidney: From Small Specimens to Big Data
- PMID: 35309077
- PMCID: PMC8931540
- DOI: 10.3389/fphys.2022.832457
Tissue Cytometry With Machine Learning in Kidney: From Small Specimens to Big Data
Abstract
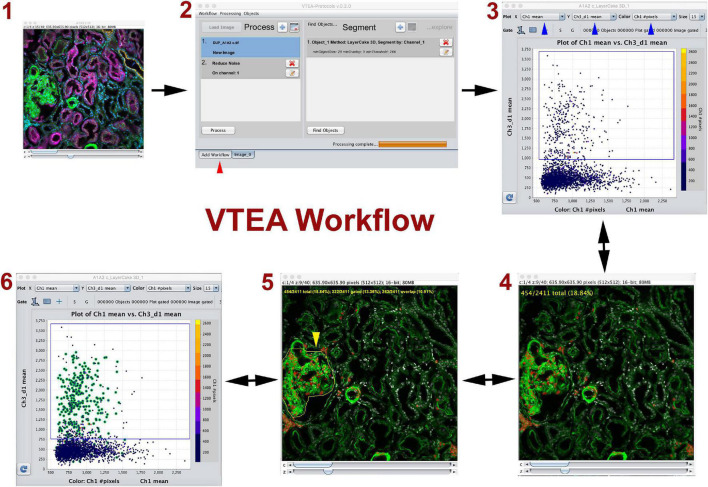
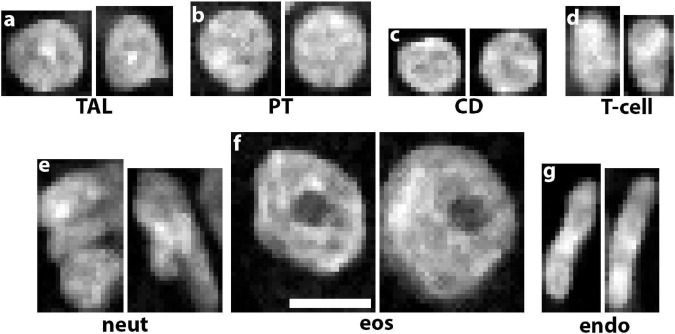
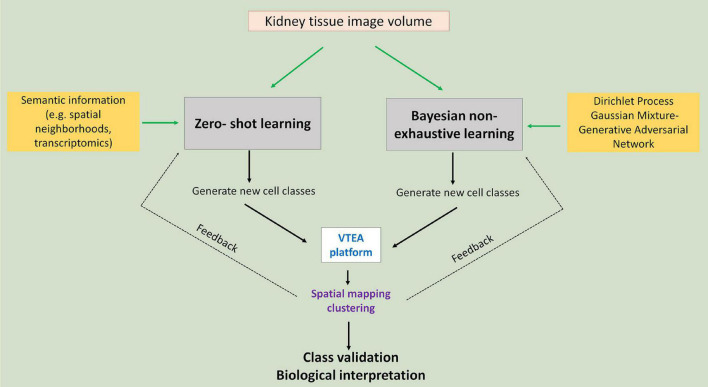
Advances in cellular and molecular interrogation of kidney tissue have ushered a new era of understanding the pathogenesis of kidney disease and potentially identifying molecular targets for therapeutic intervention. Classifying cells in situ and identifying subtypes and states induced by injury is a foundational task in this context. High resolution Imaging-based approaches such as large-scale fluorescence 3D imaging offer significant advantages because they allow preservation of tissue architecture and provide a definition of the spatial context of each cell. We recently described the Volumetric Tissue Exploration and Analysis cytometry tool which enables an interactive analysis, quantitation and semiautomated classification of labeled cells in 3D image volumes. We also established and demonstrated an imaging-based classification using deep learning of cells in intact tissue using 3D nuclear staining with 4',6-diamidino-2-phenylindole (DAPI). In this mini-review, we will discuss recent advancements in analyzing 3D imaging of kidney tissue, and how combining machine learning with cytometry is a powerful approach to leverage the depth of content provided by high resolution imaging into a highly informative analytical output. Therefore, imaging a small tissue specimen will yield big scale data that will enable cell classification in a spatial context and provide novel insights on pathological changes induced by kidney disease.
Keywords: 3D imaging; artificial intelligence; cytometry analysis; deep learning; kidney injury.
Copyright © 2022 El-Achkar, Winfree, Talukder, Barwinska, Ferkowicz and Al Hasan.
Conflict of interest statement
The authors declare that the research was conducted in the absence of any commercial or financial relationships that could be construed as a potential conflict of interest.
Figures
References
-
- Ben-Yosef M., Weinshall D. (2018). Gaussian mixture generative adversarial networks for diverse datasets, and the unsupervised clustering of images. arXiv preprint arXiv 1808.10356. [preprint]
-
- Berry M. R., Mathews R. J., Ferdinand J. R., Jing C., Loudon K. W., Wlodek E., et al. (2017). Renal Sodium Gradient Orchestrates a Dynamic Antibacterial Defense Zone. Cell 170 860–874.e19. - PubMed
Publication types
Grants and funding
LinkOut - more resources
Full Text Sources