. 2022 Mar 3:3:827360.
doi: 10.3389/froh.2022.827360. eCollection 2022.

Mass Spectrometry-Based Differentiation of Oral Tongue Squamous Cell Carcinoma and Nontumor Regions With the SpiderMass Technology

Affiliations

Mass Spectrometry-Based Differentiation of Oral Tongue Squamous Cell Carcinoma and Nontumor Regions With the SpiderMass Technology

Nina Ogrinc et al. Front Oral Health. .

Abstract

Oral cavity cancers are the 15th most common cancer with more than 350,000 new cases and ~178,000 deaths each year. Among them, squamous cell carcinoma (SCC) accounts for more than 90% of tumors located in the oral cavity and on oropharynx. For the oral cavity SCC, the surgical resection remains the primary course of treatment. Generally, surgical margins are defined intraoperatively using visual and tactile elements. However, in 15-30% of cases, positive margins are found after histopathological examination several days postsurgery. Technologies based on mass spectrometry (MS) were recently developed to help guide surgical resection. The SpiderMass technology is designed for in-vivo real-time analysis under minimally invasive conditions. This instrument achieves tissue microsampling and real-time molecular analysis with the combination of a laser microprobe and a mass spectrometer. It ultimately acts as a tool to support histopathological decision-making and diagnosis. This pilot study included 14 patients treated for tongue SCC (T1 to T4) with the surgical resection as the first line of treatment. Samples were first analyzed by a pathologist to macroscopically delineate the tumor, dysplasia, and peritumoral areas. The retrospective and prospective samples were sectioned into three consecutive sections and thaw-mounted on slides for H&E staining (7 μm), SpiderMass analysis (20 μm), and matrix-assisted laser desorption ionization (MALDI) MS imaging (12 μm). The SpiderMass microprobe collected lipidometabolic profiles of the dysplasia, tumor, and peritumoral regions annotated by the pathologist. The MS spectra were then subjected to the multivariate statistical analysis. The preliminary data demonstrate that the lipidometabolic molecular profiles collected with the SpiderMass are significantly different between the tumor and peritumoral regions enabling molecular classification to be established by linear discriminant analysis (LDA). MALDI images of the different samples were submitted to segmentation for cross instrument validation and revealed additional molecular discrimination within the tumor and nontumor regions. These very promising preliminary results show the applicability of the SpiderMass to SCC of the tongue and demonstrate its interest in the surgical treatment of head and neck cancers.

Keywords: decision support; head and neck cancer; lipidomics; mass spectrometry; precision surgery; real-time diagnosis; surgical margin; tongue squamous cell carcinoma.


Conflict of interest statement

MS and IF are inventors of the patent (priority number WO2015IB57301 20150922) related to part of the described protocol. The remaining authors declare that the research was conducted in the absence of any commercial or financial relationships that could be construed as a potential conflict of interest.

Figures

Figure 1
Figure 1
Formalin-fixed paraffin-embedded (FFPE) tissue analysis by the SpiderMass. (A) Principal component analysis-linear discriminant analysis (PCA-LDA) classification model based on the tumor, nontumor, and dysplasia annotated regions of the tissue. (B) Cross-validation results. Cross-validation results of the 3-class model with model type, cross-validation type, N of classes, N spectra, N of passes as well as N of failures, N outliers, and % of correct classification accuracies after cross-validation. (C) Relative intensity boxplots of the selected peaks showing a discrimination in LD1 for the nontumor and tumor regions, respectively. The intensities were normalized to the total ion chromatogram and represented as boxplots with the Tukey method whisker definition.
Figure 2
Figure 2
The prospective cohort SpiderMass analysis and classification models. (A) Examples of optical images of histopathological stains and annotations from fresh-frozen squamous cell carcinoma (SCC) samples. The annotations for patients A, B, C, D, E, and F delineate between the tumor and nontumor regions analyzed by the SpiderMass. Random spots were analyzed from each region. The multivariate statistical analysis of mass spectrometry (MS) data from the SCC samples in (B) positive and (C) negative ion mode; tumor (red) and nontumor (blue). PCA plot of 2 tissue types (left) and LDA model representation with a two-class scheme (right). The markers A-F indicate each patient.
Figure 3
Figure 3
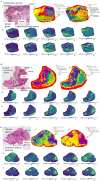
Optical images and MS imaging data of the prospective cohort. Matrix-assisted laser desorption ionization at 50 μm spatial resolutions was used to measure sections in both the positive and negative ion modes. All the data were subjected to the bisecting K-means segmentation. Each part of the figure presents the: (i) detailed histopathological annotations, (ii) image segmentation and cluster tree in positive ion mode, (iii) image segmentation and the cluster tree in negative ion mode, (iv) selected ion images in positive ion mode m/z ± 0.3 and (v) selected ion images in negative ion mode m/z ± 0.3 for (A) patient A, (B) patient C and (C) patient F. All of the selected ion images were found discriminative with the prior SpiderMass analysis.

References

    1. Sung H, Ferlay J, Siegel RL, Laversanne M, Soerjomataram I, Jemal A, et al. . Global Cancer Statistics 2020: GLOBOCAN Estimates of Incidence and Mortality Worldwide for 36 Cancers in 185 Countries. CA Cancer J Clin. (2021) 71:209–49. 10.3322/caac.21660 - DOI - PubMed
    1. Dyba T, Randi G, Bray F, Martos C, Giusti F, Nicholson N, et al. . The European cancer burden in 2020: incidence and mortality estimates for 40 countries and 25 major cancers. Eur J Cancer. (2021) 157:308–47. 10.1016/j.ejca.2021.07.039 - DOI - PMC - PubMed
    1. Ligier K, Belot A, Launoy G, Velten M, Bossard N, Iwaz J, et al. . Descriptive epidemiology of upper aerodigestive tract cancers in France: incidence over 1980–2005 and projection to 2010. Oral Oncol. (2011) 47:302–7. 10.1016/j.oraloncology.2011.02.013 - DOI - PubMed
    1. Johnson DE, Burtness B, Leemans CR, Lui VWY, Bauman JE, Grandis JR. Head and neck squamous cell carcinoma. Nat Rev Dis Primers. (2020) 6:92. 10.1038/s41572-020-00224-3 - DOI - PMC - PubMed
    1. Jéhannin-Ligier K, Dejardin O, Lapôtre-Ledoux B, Bara S, Coureau G, Grosclaude P, et al. . Oral cancer characteristics in France: descriptive epidemiology for early detection. J Stomatol Oral Maxillofac Surg. (2017) 118:84–9. 10.1016/j.jormas.2017.02.003 - DOI - PubMed