. 2022 Mar 2:13:858494.
doi: 10.3389/fimmu.2022.858494. eCollection 2022.

Blockade of Autophagy Prevents the Progression of Hyperuricemic Nephropathy Through Inhibiting NLRP3 Inflammasome-Mediated Pyroptosis

Affiliations

Blockade of Autophagy Prevents the Progression of Hyperuricemic Nephropathy Through Inhibiting NLRP3 Inflammasome-Mediated Pyroptosis

Yan Hu et al. Front Immunol. .

Abstract

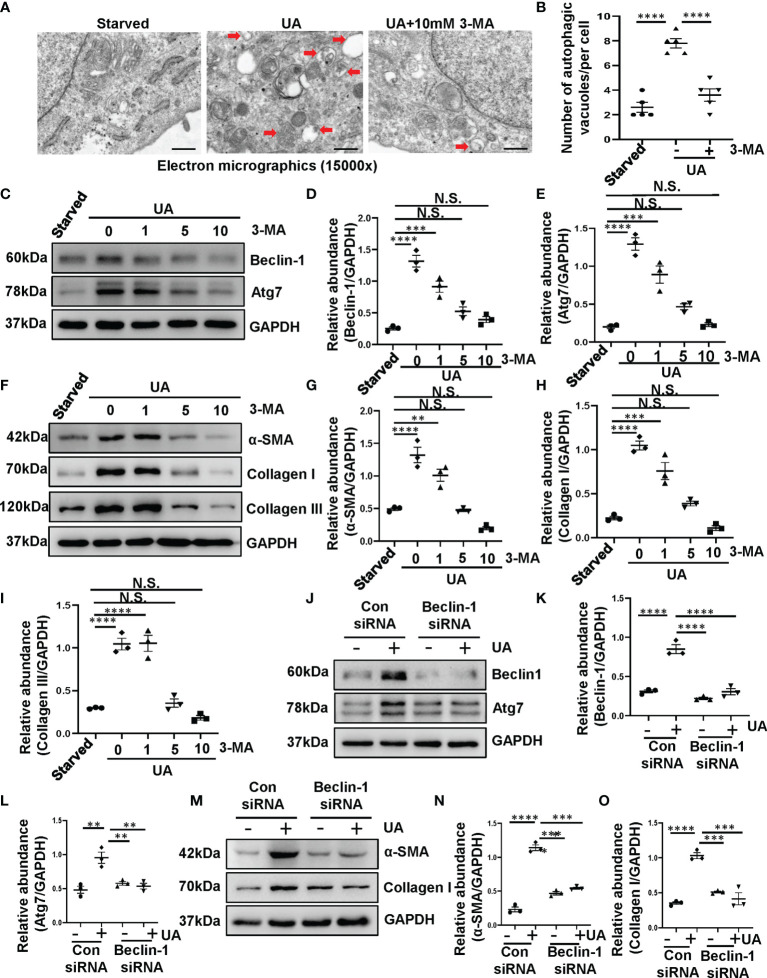
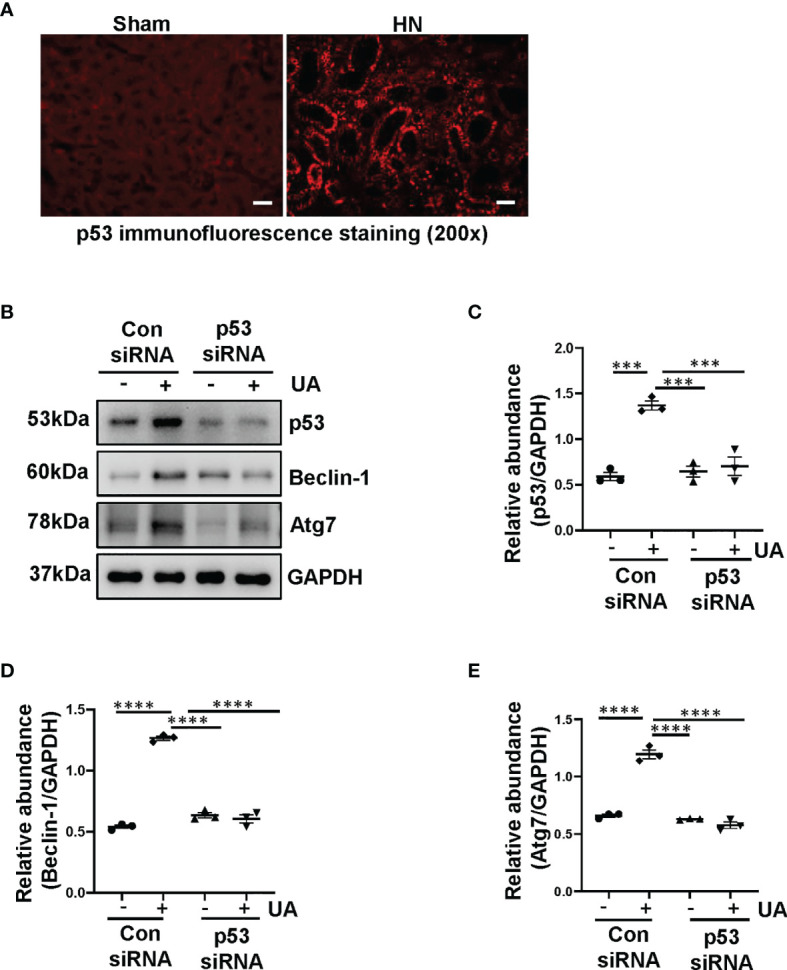
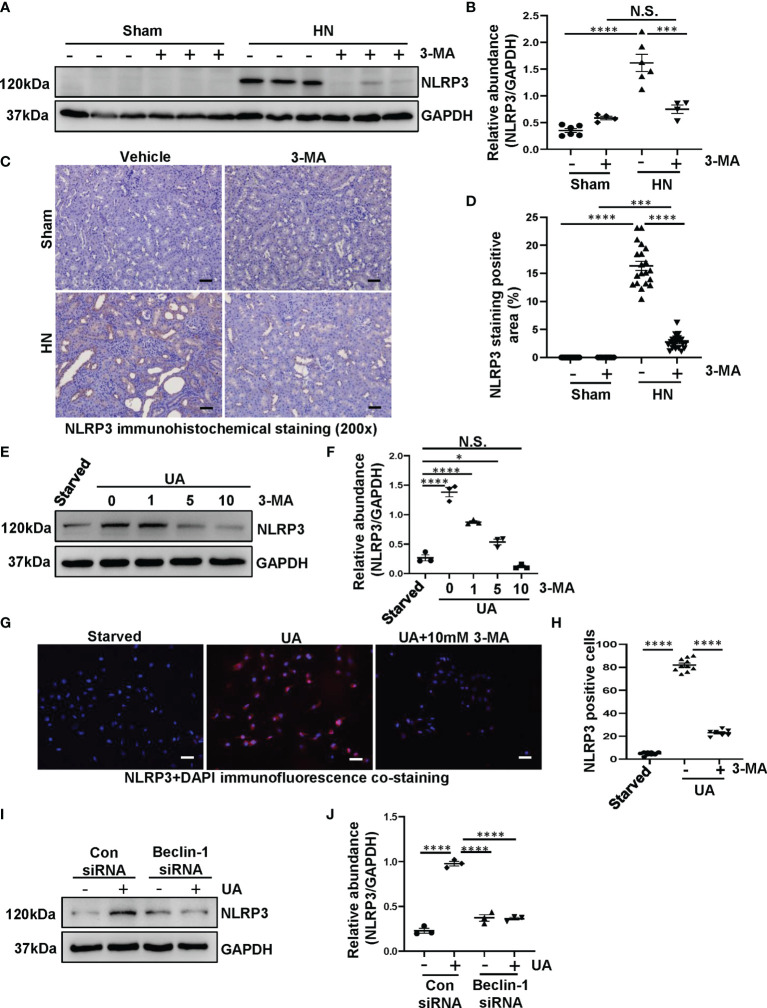
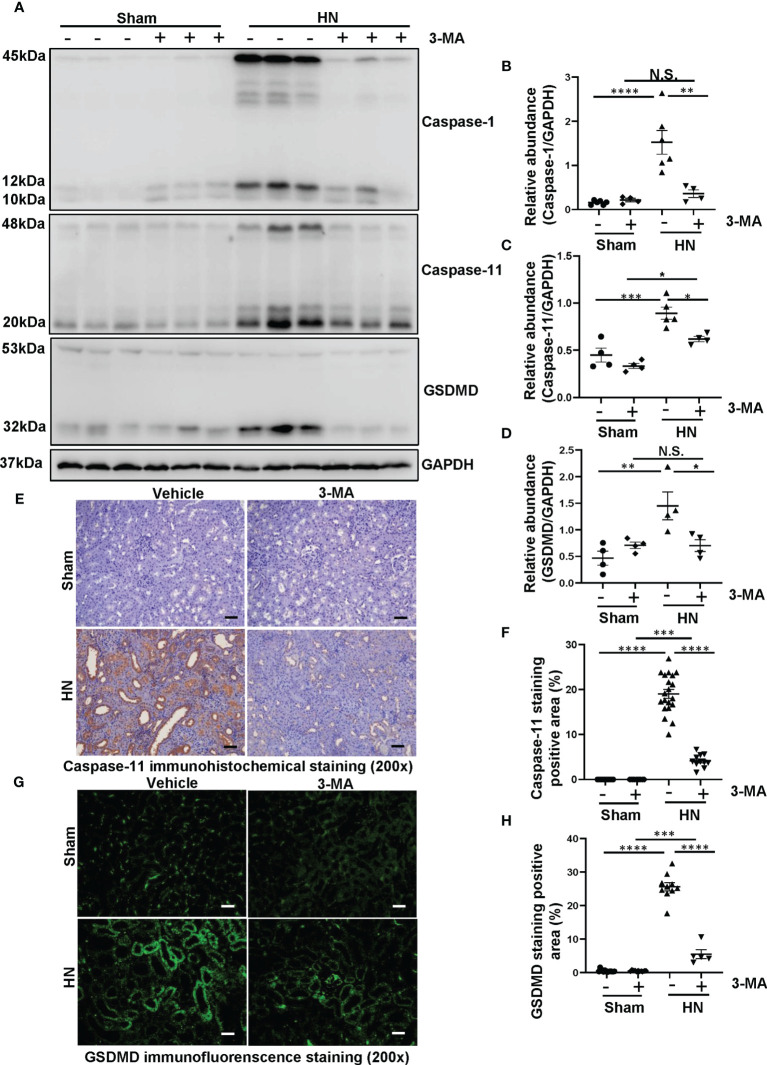
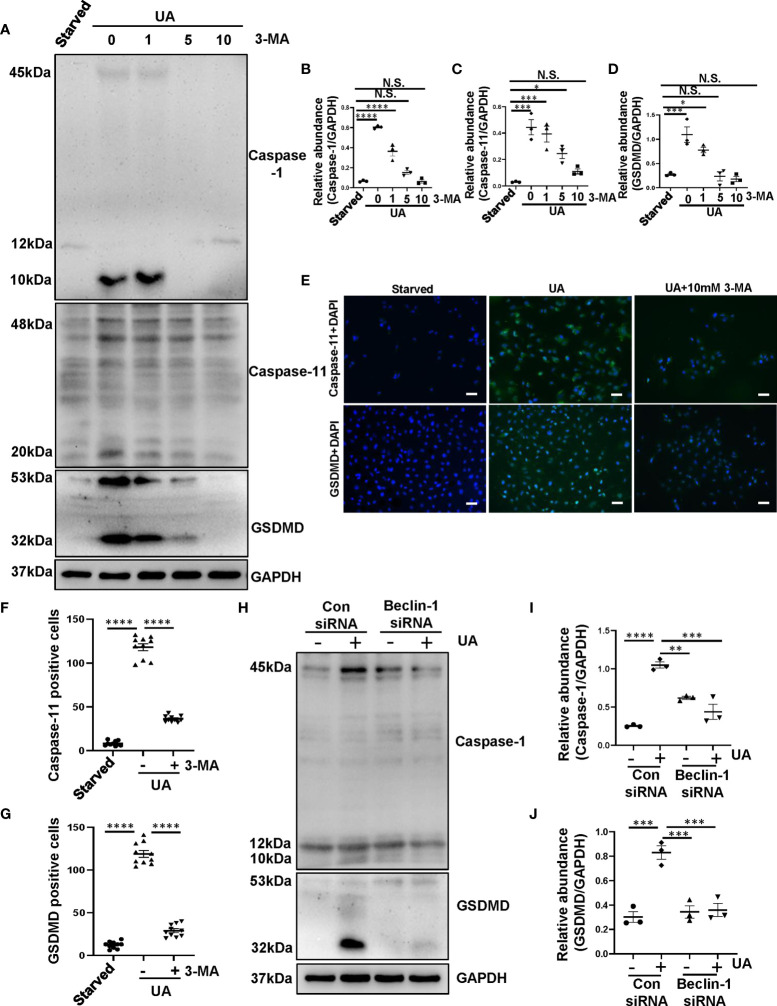
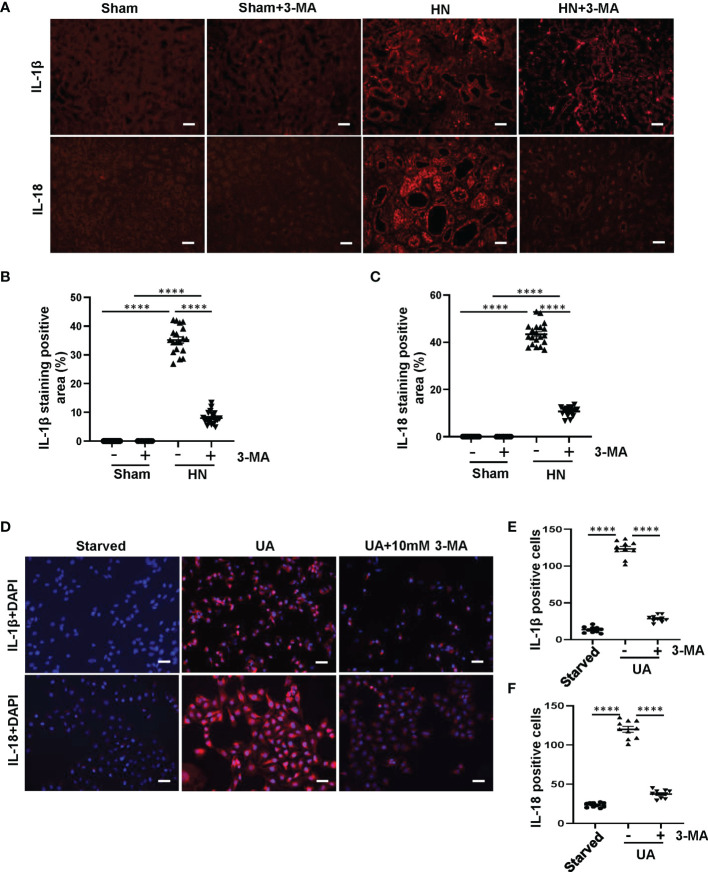
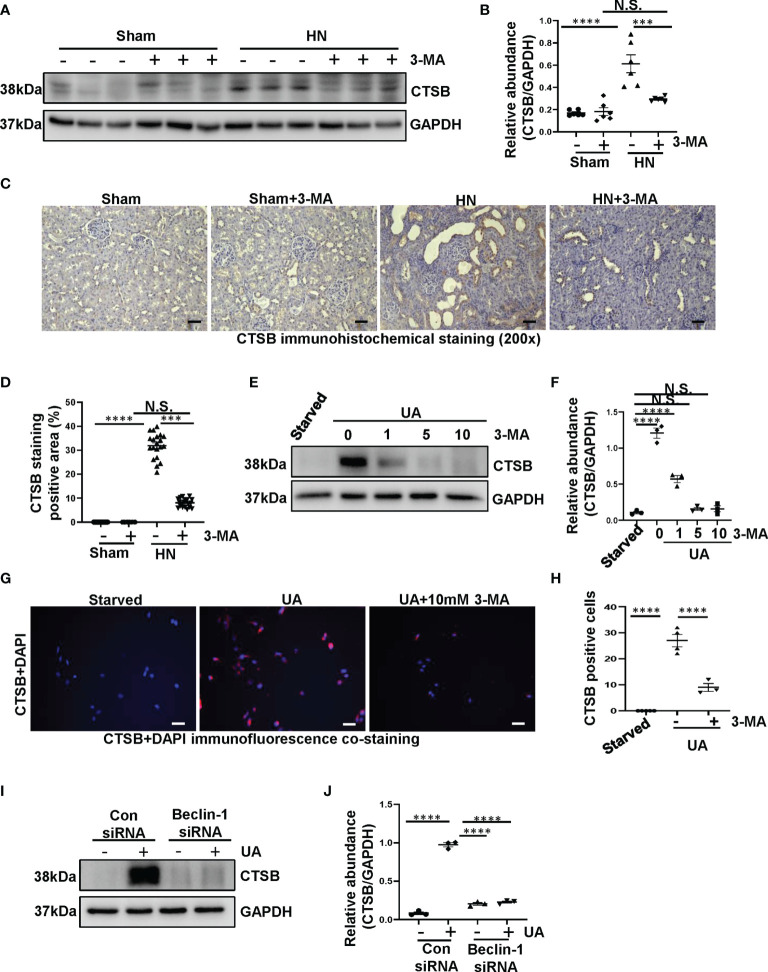
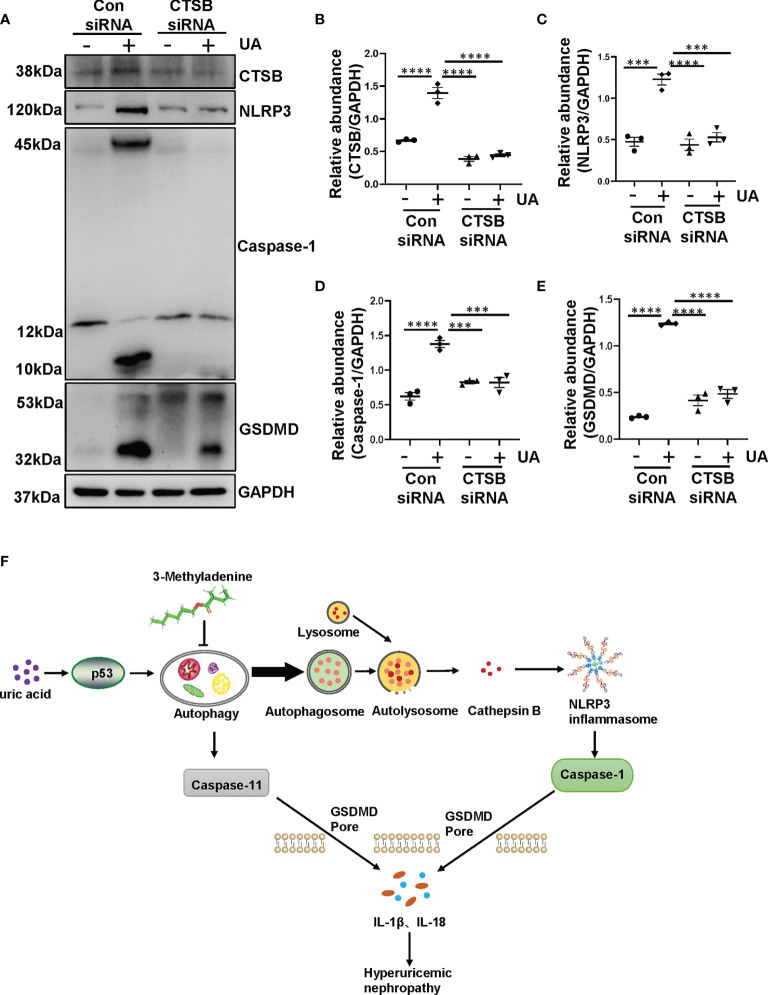
Hyperuricemia has become a common metabolic disease, and is a risk factor for multiple diseases, including chronic kidney disease. Our recent study indicated that following persistent uric acid stimulation, autophagy was activated in rats of hyperuricemic nephropathy (HN) and facilitated the development of renal fibrosis. Nevertheless, the potential mechanism by which autophagy promoted the progression of HN is still not fully elucidated. Thus, in the current study, we investigated the mechanisms of autophagy inhibition on the development of HN. Our data showed that autophagy was activated in human renal tubular cell lines (HK-2) exposure to uric acid. Inhibition of autophagy with 3-methyladenine (3-MA) and transfected with Beclin-1 siRNA prevented uric acid-induced upregulation of α-SMA, Collagen I and Collagen III in HK-2 cells. Moreover, uric acid upregulated autophagy via promoting the p53 pathway. In vivo, we showed that hyperuricemic injury induced the activation of NLRP3 inflammasome and pyroptosis, as evidenced by cleavage of caspase-1 and caspase-11, activation of gasdermin D (GSDMD) and the release of IL-1β and IL-18. Treatment with autophagy inhibitor 3-MA alleviated aforementioned phenomenon. Stimulation with uric acid in HK-2 cells also resulted in NLRP3 inflammasome activation and pyroptotic cell death, however treatment with 3-MA prevented all these responses. Mechanistically, we showed that the elevation of autophagy and degradation of autophagolysosomes resulted in the release of cathepsin B (CTSB), which is related to the activation of NLRP3 inflammasome. CTSB siRNA can inhibit the activation of NLRP3 inflammasome and pyroptosis. Collectively, our results indicate that autophagy inhibition protects against HN through inhibiting NLRP3 inflammasome-mediated pyroptosis. What's more, blockade the release of CTSB plays a crucial role in this process. Thus, inhibition of autophagy may be a promising therapeutic strategy for hyperuricemic nephropathy.

Keywords: NLRP3 inflammasome; autophagy; cathepsin B; hyperuricemic nephropathy; pyroptosis.


Conflict of interest statement

The authors declare that the research was conducted in the absence of any commercial or financial relationships that could be construed as a potential conflict of interest.

Figures

Figure 1
Figure 1
Exposure of HK-2 cells to uric acid results in the activation of autophagy and the upregulation of α-SMA, Collagen I and Collagen III. (A) Transmission electron microscopy showed the ultrastructural feature of autophagosome (Red arrows) in HK-2 cells following uric acid (800 μM) stimulation in the presence/absence of 3-MA. (B) Quantitation analysis of the number of autophagic vacuoles per cell was performed. (C) Western blot was conducted to evaluate the protein level of Beclin-1, Atg7 and GAPDH in HK-2 cell lysates. (D, E) Scatter plots showing the densitometry analysis of Beclin-1 and Atg7 normalized by GAPDH. (F) Western blot was conducted to evaluate the protein level of α-SMA, Collagen I, Collagen III and GAPDH in HK-2 cell lysates. (G–I) Scatter plots showing the densitometry analysis of α-SMA, Collagen I, Collagen III normalized by GAPDH. (J) Western blot was conducted to evaluate the protein level of Beclin-1, Atg7 and GAPDH in HK-2 cell lysates. (K, L) Scatter plots showing the densitometry analysis of Beclin-1 and Atg7 normalized by GAPDH. (M) Western blot was conducted to evaluate the protein level of α-SMA, Collagen I and GAPDH in HK-2 cell lysates. (N, O) Scatter plots showing the densitometry analysis of α-SMA and Collagen I normalized by GAPDH. Data are expressed as mean ± SEM. **P<0.01; ***P<0.001; ****P<0.0001. N.S., statistically not significant, with the comparisons labeled. Scale bars in (A) = 500 nm.
Figure 2
Figure 2
Uric acid induces autophagy mediated by p53 signaling pathway. (A) Photomicrographs illustrating immunofluorescence staining of p53. (B) Western blot was conducted to evaluate the protein level of p53, Beclin-1, Atg7 and GAPDH in HK-2 cell lysates. (C–E) Scatter plots showing the densitometry analysis of p53, Beclin-1 and Atg7 normalized by GAPDH. Data are expressed as mean ± SEM. ***P<0.001; ****P<0.0001. Scale bars in (A) = 50 μm.
Figure 3
Figure 3
Inhibition of autophagy prevents the activation of NLRP3 inflammasome both in HN rats and in HK-2 cells. (A) Western blot was conducted to evaluate the protein level of NLRP3 and GAPDH in the kidney tissue lysates. (B) Scatter plot showing the densitometry analysis of NLRP3 normalized by GAPDH. (C) Immunohistochemistry staining was used to detect the level of NLRP3. (D) Positive area of NLRP3. (E) Western blot was conducted to evaluate the protein level of NLRP3 and GAPDH in HK-2 cell lysates. (F) Scatter plot showing the densitometry analysis of NLRP3 normalized by GAPDH. (G) Immunofluorescence co-staining was used to detect the level of NLRP3. (H) The count of NLRP3-positive cells. (I) Western blot was conducted to evaluate the protein level of NLRP3 and GAPDH in HK-2 cell lysates. (J) Scatter plot showing the densitometry analysis of NLRP3 normalized by GAPDH. Data are expressed as mean ± SEM. *P<0.05; ***P<0.001; ****P<0.0001. N.S., statistically not significant, with the comparisons labeled. All scale bars = 50 μm.
Figure 4
Figure 4
Administration of 3-MA inhibits the process of pyroptosis in a rat model of HN. (A) Western blot was conducted to evaluate the protein level of caspase-1, caspase-11, GSDMD and GAPDH in the kidney tissue lysates. (B–D) Scatter plots showing the densitometry analysis of caspase-1, caspase-11 and GSDMD normalized by GAPDH. (E) Immunohistochemistry staining was used to detect the level of caspase-11. (F) Positive area of caspase-11. (G) Immunofluorescence staining was used to detect the level of GSDMD. (H) Positive area of GSDMD. Data are expressed as mean ± SEM. *P<0.05; **P<0.01; ***P<0.001; ****P<0.0001. N.S., statistically not significant, with the comparisons labeled. All scale bars = 50 μm.
Figure 5
Figure 5
Inhibition of autophagy prevents the process of pyroptosis in HK-2 cells exposed to uric acid. (A) Western blot was conducted to evaluate the protein level of caspase-1, caspase-11, GSDMD and GAPDH in HK-2 cell lysates. (B–D) Scatter plots showing the densitometry analysis of caspase-1, caspase-11 and GSDMD normalized by GAPDH. (E) Photomicrographs illustrating immunofluorescence of caspase-11 and GSDMD, respectively, costained with DAPI. (F, G) Positive cells of caspase-11 and GSDMD were quantitatively analyzed. (H) Western blot was conducted to evaluate the protein level of caspase-1, GSDMD and GAPDH in HK-2 cell lysates. (I, J) Scatter plots showing the densitometry analysis of caspase-1 and GSDMD normalized by GAPDH. Data are expressed as mean ± SEM. *P<0.05; **P < 0.01.; ***P<0.001; ****P<0.0001. N.S., statistically not significant, with the comparisons labeled. All scale bars = 50 μm.
Figure 6
Figure 6
Inhibition of autophagy with 3-MA prevents the release of IL-1β and IL-18 both in HN rats and in HK-2 cells. (A) Photomicrographs illustrating immunofluorescence of IL-1β and IL-18 from kidney tissues. (B, C) Positive areas of IL-1β and IL-18 were quantitatively analyzed. (D) Photomicrographs illustrating immunofluorescence of IL-1β and IL-18, respectively, costained with DAPI. (E, F) Positive cells of IL-1β and IL-18 were quantitatively analyzed. ****P<0.0001. All scale bars = 50 μm.
Figure 7
Figure 7
Uric acid upregulated the expression of CTSB both in HN rats and in HK-2 cells. (A) Western blot was conducted to evaluate the protein level of CTSB and GAPDH in the kidney tissue lysates. (B) Scatter plot showing the densitometry analysis of CTSB normalized by GAPDH. (C) Immunohistochemistry staining was used to detect the level of CTSB. (D) Positive area of CTSB. (E) Western blot was conducted to evaluate the protein level of CTSB and GAPDH in HK-2 cell lysates. (F) Scatter plot showing the densitometry analysis of CTSB normalized by GAPDH. (G) Immunofluorescence staining was used to detect the level of CTSB. (H) The count of CTSB-positive cells. (I) Western blot was conducted to evaluate the protein level of CTSB and GAPDH in HK-2 cell lysates. (J) Scatter plot showing the densitometry analysis of CTSB normalized by GAPDH. Data are expressed as mean ± SEM. ***P<0.001; ****P<0.0001. N.S., statistically not significant, with the comparisons labeled. All scale bars = 50 μm.
Figure 8
Figure 8
Uric acid-induced NLRP3 inflammasome activation and pyroptosis are regulated by CTSB. (A) Western blot was conducted to evaluate the protein level of CTSB, NLRP3, caspase-1, GSDMD and GAPDH in HK-2 cell lysates. (B–E) Scatter plots showing the densitometry analysis of CTSB, NLRP3, caspase-1 and GSDMD normalized by GAPDH. (F) Mechanisms of uric acid-induced autophagy promotes HN. Chronic exposure to uric acid induces dysregulation of autophagy, which is mediated by p53 pathway. The activation of autophagy further activated NLRP3 inflammasome and pyroptosis. The release of CTSB from autolysosome plays a crucial role in the activation of NLRP3 inflammasome and pyroptosis, which leads to the release of IL-1β and IL-18. Blockade of autophagy inhibits the aforementioned responses so that prevents the occur of hyperuricemic nephropathy. Data are expressed as mean ± SEM. ***P<0.001; ****P<0.0001.

Similar articles

Cited by

References

    1. Liu R, Han C, Wu D, Xia X, Gu J, Guan H, et al. . Prevalence of Hyperuricemia and Gout in Mainland China From 2000 to 2014: A Systematic Review and Meta-Analysis. BioMed Res Int (2015) 2015:762820. doi: 10.1155/2015/762820 - DOI - PMC - PubMed
    1. Trifirò G, Morabito P, Cavagna L, Ferrajolo C, Pecchioli S, Simonetti M, et al. . Epidemiology of Gout and Hyperuricaemia in Italy During the Years 2005-2009: A Nationwide Population-Based Study. Ann Rheum Dis (2013) 72:694–700. doi: 10.1136/annrheumdis-2011-201254 - DOI - PubMed
    1. Jalal DI, Chonchol M, Chen W, Targher G. Uric Acid as a Target of Therapy in CKD. Am J Kidney Dis (2013) 61:134–46. doi: 10.1053/j.ajkd.2012.07.021 - DOI - PMC - PubMed
    1. Shi M, Guo F, Liao D, Huang R, Feng Y, Zeng X, et al. . Pharmacological Inhibition of Fatty Acid-Binding Protein 4 Alleviated Kidney Inflammation and Fibrosis in Hyperuricemic Nephropathy. Eur J Pharmacol (2020) 887:173570. doi: 10.1016/j.ejphar.2020.173570 - DOI - PubMed
    1. Lu J, Dalbeth N, Yin H, Li C, Merriman TR, Wei WH. Mouse Models for Human Hyperuricaemia: A Critical Review. Nat Rev Rheumatol (2019) 15:413–26. doi: 10.1038/s41584-019-0222-x - DOI - PubMed

Publication types