. 2022 Mar 4:13:833254.
doi: 10.3389/fimmu.2022.833254. eCollection 2022.

Tear miRNAs Identified in a Murine Model of Sjögren's Syndrome as Potential Diagnostic Biomarkers and Indicators of Disease Mechanism

Affiliations

Tear miRNAs Identified in a Murine Model of Sjögren's Syndrome as Potential Diagnostic Biomarkers and Indicators of Disease Mechanism

Shruti Singh Kakan et al. Front Immunol. .

Abstract

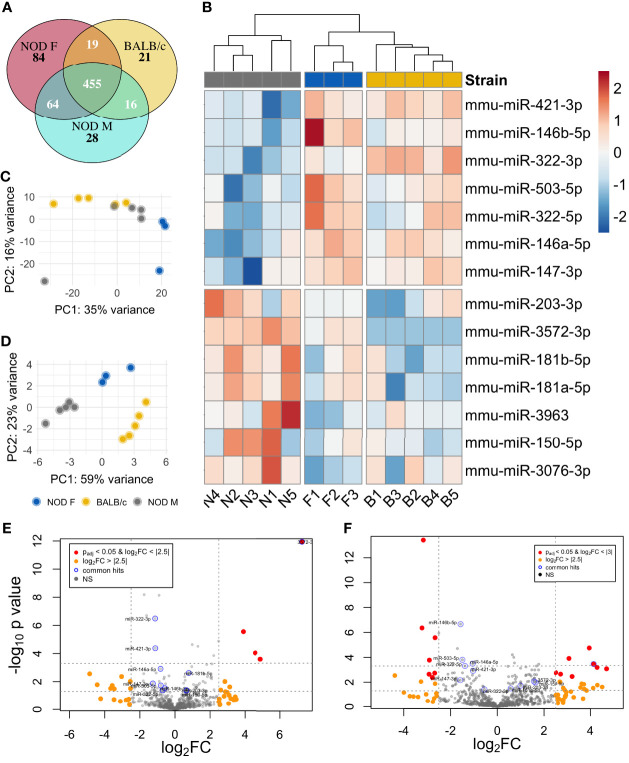
Objective: The tear miRNAome of the male NOD mouse, a model of ocular symptoms of Sjögren's syndrome (SS), was analyzed to identify unique miRNAs.

Methods: Male NOD mice, aged 12-14 weeks, were used to identify tear miRNAs associated with development of autoimmune dacryoadenitis. Age- and sex-matched male BALB/c mice served as healthy controls while age-matched female NOD mice that do not develop the autoimmune dacryoadenitis characteristic of SS were used as additional controls. Total RNA was isolated from stimulated tears pooled from 5 mice per sample and tear miRNAs were sequenced and analyzed. Putative miRNA hits were validated in additional mouse cohorts as well as in tears of SS patients versus patients with another form of dry eye disease, meibomian gland disease (MGD) using qRT-PCR. The pathways influenced by the validated hits were identified using Ingenuity Pathway Analysis.

Results: In comparison to tears from both healthy (male BALB/c) and additional control (female NOD) mice, initial analy1sis identified 7 upregulated and 7 downregulated miRNAs in male NOD mouse tears. Of these, 8 were validated by RT-qPCR in tears from additional mouse cohorts. miRNAs previously implicated in SS pathology included mmu-miR-146a/b-5p, which were significantly downregulated, as well as mmu-miR-150-5p and mmu-miR-181a-5p, which were upregulated in male NOD mouse tears. All other validated hits including the upregulated miR-181b-5p and mmu-miR-203-3p, as well as the downregulated mmu-miR-322-5p and mmu-miR-503-5p, represent novel putative indicators of autoimmune dacryoadenitis in SS. When compared to tears from patients with MGD, miRNAs hsa-miR-203a-3p, hsa-miR-181a-5p and hsa-miR-181b-5p were also significantly increased in tears of SS patients.

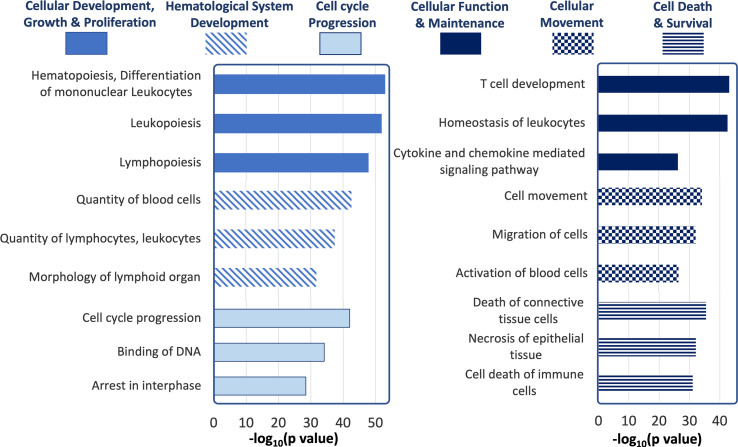
Conclusions: A panel of differentially expressed miRNAs were identified in tears of male NOD mice, with some preliminary validation in SS patients, including some never previously linked to SS. These may have potential utility as indicators of ocular symptoms of SS; evaluation of the pathways influenced by these dysregulated miRNAs may also provide further insights into SS pathogenesis.

Keywords: NOD mouse; Sjögren’s syndrome; autoimmune dacryoadenitis; autoimmune diseases; dry eye; miRNA; next gen sequencing.


Conflict of interest statement

The authors declare that the research was conducted in the absence of any commercial or financial relationships that could be construed as a potential conflict of interest.

Figures

Figure 1
Figure 1
Schematic overview of experiments and data analysis. Tears were collected by stimulating both LG from each mouse with 50 μM Carbachol. Tears were pooled from n=5 mice for each sample, with N=5 samples for male NOD and BALB/c mice and N=3 for female NOD mice. In total, 13 samples were sent for RNA sequencing, and raw data was analyzed as follows: (A1) Quality assessment by FASTqc showed presence of 3’ adapters in the reads; (B) Using cutadapt (33), 3’ adapters were trimmed and reads with quality scores <20 or length <15 were removed; (C) Trimmed reads were aligned to mouse genome GRCm38 using Bowtie (34); and (D) Aligned reads were annotated using featureCounts (35). Additionally, (A2) raw FASTQ files were also run through our internal miRGrepp pipeline (36) and (E) miRNA counts were normalized, and plotted to assess the quality of the data with statistics on these read counts performed using R package, DESEq2 (37); (F) Shortlisted hits were validated by qPCR in a separate cohort of mice; and and (G) Pathway analysis of the hits was done in Ingenuity Pathway Analysis (Qiagen). Graphic created with BioRender.com.
Figure 2
Figure 2
Representative H & E-stained images of LG from 12 -14-week-old female NOD, male BALB/c or male NOD mice. No lymphocytic infiltration is observed in LG from (A) female NOD mice or (B) male BALB/c mice. Marked lymphocytic infiltration is observed in LG from (C) male NOD mice. Scalebar, 25 μm. The percentage of total area of infiltrating lymphocytes in LG calculated in both the (D) discovery cohort and (E) validation cohort of age-matched female NOD mice (blue), male BALB/c mice (yellow) and male NOD mice (grey). Points represent the percentage lymphocytic infiltration for one LG per mice. Data are plotted as a boxplot with whiskers showing range. (***p < 10-3, ****p < 10-4, One-Way ANOVA). The correlation between percentage lymphocytic infiltration and tear production for male NOD mice was calculated in both (F) discovery and (G) validation cohorts. Pearson’s correlation coefficient (r) is shown. Points in D-G represent individual mouse LG (D, E) or mouse tears (F, G) with N=25 for male NOD and BALB/c and N=15 for female NOD for discovery cohorts and N=12 for all mouse groups in the validation cohort.
Figure 3
Figure 3
Differential miRNA expression analysis of NOD mouse tears. (A) Venn diagram showing the overlap of miRNA in the three strains. miRNA that had normalized read counts > 0 in at least 4 out of 5 samples of NOD and BALB/c and 2 out of 3 samples for the female NOD were included for calculations. (B) Heatmap of 14 miRNA that are differentially expressed in male NOD mouse tears as compared to tears of male BALB/c and female NOD. Principal component analysis (PCA) plot of the (C) complete miRNA data and (D) top miRNA hits, characterizes the trends exhibited by the expression profiles of the 3 strains. Each dot represents a sample, and each color represents the type of the sample. Volcano plot of differentially expressed miRNA in NOD mouse tears as compared to (E) that of male BALB/c and (F) female NOD.
Figure 4
Figure 4
Multiple miRNAs are differentially expressed in tears of diseased male NOD mice. (A) 7 miRNAs were identified as upregulated in tears of 12-14 week male NOD mice while (B) 7 more miRNAs were found to be downregulated in tears of 12-14 week male NOD mice as compared to both age-matched female NOD and male BALB/c mice. Log10 Normalized miRNA counts as calculated by DESeq2 are plotted for each strain. N=5 samples for male NOD and BALB/c, and N=3 samples for female NOD mice; n=5 mice per sample for each strain. miRNA were considered differentially expressed if the fold change trended in the same direction for NOD M vs BALB/c and NOD M vs NOD F; had a mean expression value of 10 reads or higher and had a significant unadjusted p value in at least one of the two comparisons. (*p < 0.05; **p < 0.01, ***p < 0.001, ****p < 0.0001, DESeq2; ns, not significant).
Figure 5
Figure 5
qRT-PCR validation of miRNA hits in mice tears. In a separate cohort of age-matched mice, 13 miRNA hits from the sequencing data set were tested by qPCR to confirm the initial observation. Data was first normalized for plate to plate variation using a spike-in RNA and then to two internal controls, miR-93-3p and miR-25-3p. Of the 13 original hits, 8 miRNA were confirmed as differentially expressed. Statistics were performed on average ΔCt values; data are plotted as ΔΔCt. qPCR was performed with N=4 biological replicate samples, n=3 mice per sample, with 3 technical replicates per sample. (*p < 0.05, **p < 0.01, ***p < 10-3, ****p < 10-4, Kruskal-Wallis ANOVA in Graph-Pad Prism; ns, not significant).
Figure 6
Figure 6
Quality assessment of RNA isolated from patients using Tapestation. (A) There was no significant difference in the age of patients from the two groups. (B) Schirmer’s test score was higher for SS patients than MGD patients. (C) Normalized to tear volume, SS patient tears had significantly higher amounts of total RNA than tears of MGD patients. (D) There was no significant difference in the RIN values of RNA from SS and MGD patient tears. N=6 samples each for SS and MGD patients. Samples were analyzed using a Mann-Whitney U test with p<0.05 considered significantly different.
Figure 7
Figure 7
qRT-PCR validation of miRNA hits in human tears from patients with SS or MGD. In a small cohort of patients, miRNAs hsa-miR-181a-5p, hsa-miR-181b-5p and hsa-miR-203a-3p were significantly upregulated in tears of SS patients when compared to tears of patients with MGD. Data were first normalized for variation arising from RT and PCR using spiked-in control. Statistics were performed on ΔCt values normalized to hsa-miR-25-3p. Mean ΔΔCt values are plotted as boxplots showing the mean with 75% to 25% IQR and whiskers depicting the range. (N=6 samples each for SS and MGD patients; unpaired t-test with equal variances assumed; p=0.05).
Figure 8
Figure 8
Ingenuity Pathway Analysis of tear miRNA hits. The most statistically significant biological functions and processes generated by IPA for the genes targeted by the differentially expressed tear miRNA hits, grouped by function categories (p values calculated by IPA based on Table 1 ).
Figure 9
Figure 9
IPA Network analysis of targeted miRNAs. (A) IPA Network map of miRNA hits and their mRNA targets. Genes targeted by >1 miRNA hits are shown according to their subcellular localization. Arrows represent post-transcriptional silencing of genes by connected miRNA. Downregulated miRNA hits are shown in red, upregulated ones are in green, whereas gene targets likely to be upregulated are shaded in green, and those likely to be downregulated are shaded in orange. Gene icons shaded in white are targeted by both up and downregulated miRNA. (B) Pathway analysis results suggest upregulation of IL-6 family cytokines and those transcribed through the IL-6-response element (IL6RE). In the NF-κB signaling, TRAF6 and TAK1 are targets of hits miR-146a-5p and miR-322-5p. Downregulation of these hits may lead to upregulation of TRAF6 and TAK1 and increase the transcription of the IL6RE, resulting in increased mRNA levels of cytokines. Of these, IL-8 is directly targeted by miR-146a-5p and its levels could be particularly upregulated with depletion of this miRNA. Also of key import is the targeting of SOCS3 by the upregulated miRNA miR-203-3p. SOCS3 is a negative regulator of the JAK2/STAT3 pathway and is required to turn off the pathway to prevent excessive production of cytokines.

References

    1. Vitali C, Bombardieri S, Jonsson R, Moutsopoulos HM, Alexander EL, Carsons SE, et al. . Classification Criteria for Sjögren's Syndrome: A Revised Version of the European Criteria Proposed by the American-European Consensus Group. Ann Rheum Dis (2002) 61(6):554–8. doi: 10.1136/ard.61.6.554 - DOI - PMC - PubMed
    1. Cornec D, Devauchelle-Pensec V, Mariette X, Jousse-Joulin S, Berthelot JM, Perdriger A, et al. . Severe Health-Related Quality of Life Impairment in Active Primary Sjögren's Syndrome and Patient-Reported Outcomes: Data From a Large Therapeutic Trial. Arthritis Care Res (Hoboken) (2017) 69(4):528–35. doi: 10.1002/acr.22974 - DOI - PubMed
    1. Kassan SS, Thomas TL, Moutsopoulos HM, Hoover R, Kimberly RP, Budman DR, et al. . Increased Risk of Lymphoma in Sicca Syndrome. Ann Intern Med (1978) 89(6):888–92. doi: 10.7326/0003-4819-89-6-888 - DOI - PubMed
    1. Zufferey P, Meyer OC, Grossin M, Kahn MF. Primary Sjogren's Syndrome (SS) and Malignant Lymphoma. A Retrospective Cohort Study of 55 Patients With SS. Scand J Rheumatol (1995) 24(6):342–5. doi: 10.3109/03009749509095178 - DOI - PubMed
    1. Radfar L, Kleiner DE, Fox PC, Pillemer SR. Prevalence and Clinical Significance of Lymphocytic Foci in Minor Salivary Glands of Healthy Volunteers. Arthritis Rheum (2002) 47(5):520–4. doi: 10.1002/art.10668 - DOI - PubMed

Publication types