. 2022 Mar 2:13:830773.
doi: 10.3389/fimmu.2022.830773. eCollection 2022.

Monitoring of Circulating CAR T Cells: Validation of a Flow Cytometric Assay, Cellular Kinetics, and Phenotype Analysis Following Tisagenlecleucel

Affiliations

Monitoring of Circulating CAR T Cells: Validation of a Flow Cytometric Assay, Cellular Kinetics, and Phenotype Analysis Following Tisagenlecleucel

Andreas Peinelt et al. Front Immunol. .

Abstract

Chimeric antigen receptor (CAR) T cell therapy is a potent new treatment option for relapsed or refractory hematologic malignancies. As the monitoring of CAR T cell kinetics can provide insights into the activity of the therapy, appropriate CAR T cell detection methods are essential. Here, we report on the comprehensive validation of a flow cytometric assay for peripheral blood CD19 CAR T cell detection. Further, a retrospective analysis (n = 30) of CAR T cell and B cell levels over time has been performed, and CAR T cell phenotypes have been characterized. Serial dilution experiments demonstrated precise and linear quantification down to 0.05% of T cells or 22 CAR T cell events. The calculated detection limit at 13 events was confirmed with CAR T cell negative control samples. Inter-method comparison with real-time PCR showed appreciable correlation. Stability testing revealed diminished CAR T cell values already one day after sample collection. While we found long-term CAR T cell detectability and B cell aplasia in most patients (12/17), some patients (5/17) experienced B cell recovery. In three of these patients the coexistence of CAR T cells and regenerating B cells was observed. Repeat CAR T cell infusions led to detectable but limited re-expansions. Comparison of CAR T cell subsets with their counterparts among all T cells showed a significantly higher percentage of effector memory T cells and a significantly lower percentage of naïve T cells and T EMRA cells among CAR T cells. In conclusion, flow cytometric CAR T cell detection is a reliable method to monitor CAR T cells if measurements start without delay and sufficient T cell counts are given.

Keywords: acute lymphoblastic leukemia; chimeric antigen receptor (CAR); flow cytometry; immune monitoring; immunotherapy.


Conflict of interest statement

PB declares research grants from Neovii, Riemser, Medac (to Institution); advisory board for Novartis, Cellgene, Amgen, Medac, Servier (personal and to Institution); Speakers Bureau of Miltenyi, Jazz, Riemser, Novartis, Amgen (to Institution), and patent and royalties from Medac. The remaining authors declare that the research was conducted in the absence of any commercial or financial relationships that could be construed as a potential conflict of interest.

Figures

Figure 1
Figure 1
High signal-to-noise ratio with optimally titrated CAR T cell detection reagent. (A) Representative flow cytometry plot of a CAR T cell patient sample on day 13 post infusion (left) and a control sample without CAR T cells (right). Plots were gated on viable T cells (7-AAD-/CD45+/mononuclear cells/CD3+). (B) Exemplary CAR T cell detection reagent titration series. Six dot plots of flow cytometric measurements with 0.25 µl, 0.5 µl, 1 µl, 2.5 µl, 5 µl, and 10 µl reagent volume, respectively, are depicted in a single concatenated plot. Cells were gated on viable T cells. (C) The titration curve, obtained from five independent experiments, shows the maximal signal-to-noise ratio in the range between 1 µl and 5 µl reagent volume. Mean and standard deviation are indicated.
Figure 2
Figure 2
Sample stability. (A) Percentage of 7-AAD- viable white blood cells on the day of specimen collection and up to 5 following days. Box plots indicate median, interquartile range, and minimum and maximum. (B) The relative percent difference (RPD) of the CAR T cell percentage measured on the day of sample collection compared with the CAR T cell percentages on the following days is shown. Due to limited specimen volumes, the number of days on which stability measurements could be performed varied between 2 and 6 days. Each individual patient sample is represented by one symbol and color. Dashed lines mark the limits of acceptable variation. Median RPDs (columns) and range (error bars) are shown. (C) To illustrate the impact of increasing deviations from the d0 value, which is presumed to be the most accurate value, all stability test results are plotted on the respective day of sample collection in the graph and overlayed by the CAR T cell monitoring curves of the patients. The curves run through the d0 value. Colors and symbols match the patients in panel (B).
Figure 3
Figure 3
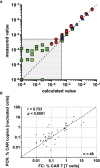
CAR T cell detection shows high precision, linearity, and inter-method agreement down to a lower limit of quantification (LLOQ) of 0.05% CAR T cells. (A) CAR-T cells were spiked into CAR T cell negative whole blood, and a dilution series was performed. Based on the percentage of CAR T cells in the undiluted spike-in sample, the “calculated value” was determined by dividing by the dilution factor and plotted against the “measured value”. Data was obtained in three independent experiments (indicated by colors and symbols) with varying amounts of CAR T cells spiked in and different dilution schemes. The region below the assay’s LLOQ is displayed as dotted area. (B) 46 post-infusion CAR T cell monitoring samples were concurrently assessed by flow cytometry and real-time PCR. The results show clear inter-method concordance by spearman’s correlation.
Figure 4
Figure 4
CAR T cell monitoring curves match well with common models of CAR T cell cellular kinetics. CAR T cell cellular kinetics can be broken up into an initial period of exponential growth (expansion), a period of rapidly falling CAR T cell numbers (contraction), and a gradual decline over months or years (persistence). Flow cytometry plots and the bottom right curve depict the CAR T cell monitoring course of the same individual patient. Cellular kinetic phases can be easily identified and are indicated in the bottom right curve.
Figure 5
Figure 5
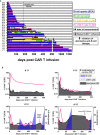
CAR T cell detectability and functional persistence. (A) Each lane illustrates the CAR T cell (upper sublane) and B cell (lower sublane) monitoring results for the follow-up of one individual patient. Measurement time points are represented by black diamonds in the center. Periods of CAR T cell frequencies above LOD (pink) and below LOD (yellow) were distinguished to evaluate detectability. Functional CAR T cell persistence was assessed by monitoring B cell levels. Periods with B cells ≤ 0.2% were regarded as BCA (blue). B cell recovery (green) was defined as an increase of the percentage of B cells > 0.2%, starting from the first result with detectable B cells ≥ 0.1%. Red arrows indicate repeat CAR T cell infusions. Green arrows denote the initiation of an alternative anti-B cell therapy. In two patients, day 0 is marked as repeat infusion because our monitoring began at their second infusion. (B) Representative curves of CAR T cell monitoring results and their current detection limit as calculated based on our experimentally established LOD of 13 flow cytometric events. Blue overlay areas indicate the recovery of B cells if applicable.
Figure 6
Figure 6
Phenotypic analysis. CD4 and CD8 positive subsets (A) and subsets positive for central memory, effector memory, EMRA, and naïve marker signatures (B) were compared between T cells (black squares) and CAR T cells (grey triangles) for 11 patients in their initial expansion phase. (C) Representative gating of naïve CAR T cells in subpopulation analyses of tisagenlecleucel product cells (left) and patient samples during the period of exponential expansion (middle) as compared to one patient’s sample 4 years after CAR T cell infusion (right). (D) subpopulation analysis was performed four times within the first 90 days (uncolored symbols) and once 205 days (red symbols) and 379 days (pink symbols) post CAR T cell infusion of patient #11. Horizontal bars represent the mean. Vertical error bars indicate the standard deviation. ns, not significant; *p < 0.05; **p < 0.01.

References

    1. Möricke A, Zimmermann M, Reiter A, Henze G, Schrauder A, Gadner H, et al. . Long-Term Results of Five Consecutive Trials in Childhood Acute Lymphoblastic Leukemia Performed by the ALL-BFM Study Group From 1981 to 2000. Leukemia (2010) 24:265–84. doi: 10.1038/leu.2009.257 - DOI - PubMed
    1. Hunger SP, Lu X, Devidas M, Camitta BM, Gaynon PS, Winick NJ, et al. . Improved Survival for Children and Adolescents With Acute Lymphoblastic Leukemia Between 1990 and 2005: A Report From the Children's Oncology Group. J Clin Oncol (2012) 30:1663–9. doi: 10.1200/JCO.2011.37.8018 - DOI - PMC - PubMed
    1. Tallen G, Ratei R, Mann G, Kaspers G, Niggli F, Karachunsky A, et al. . Long-Term Outcome in Children With Relapsed Acute Lymphoblastic Leukemia After Time-Point and Site-of-Relapse Stratification and Intensified Short-Course Multidrug Chemotherapy: Results of Trial ALL-REZ BFM 90. J Clin Oncol (2010) 28:2339–47. doi: 10.1200/JCO.2009.25.1983 - DOI - PubMed
    1. Sadelain M, Brentjens R, Rivière I. The Basic Principles of Chimeric Antigen Receptor Design. Cancer Discov (2013) 3:388–98. doi: 10.1158/2159-8290.CD-12-0548 - DOI - PMC - PubMed
    1. Finney HM, Lawson AD, Bebbington CR, Weir AN. Chimeric Receptors Providing Both Primary and Costimulatory Signaling in T Cells From a Single Gene Product. J Immunol (1998) 161:2791–7. - PubMed

Publication types

Substances