

Multi-Omics Analysis Reveals Aberrant Gut-Metabolome-Immune Network in Schizophrenia
- PMID: 35309369
- PMCID: PMC8927969
- DOI: 10.3389/fimmu.2022.812293
Multi-Omics Analysis Reveals Aberrant Gut-Metabolome-Immune Network in Schizophrenia
Abstract
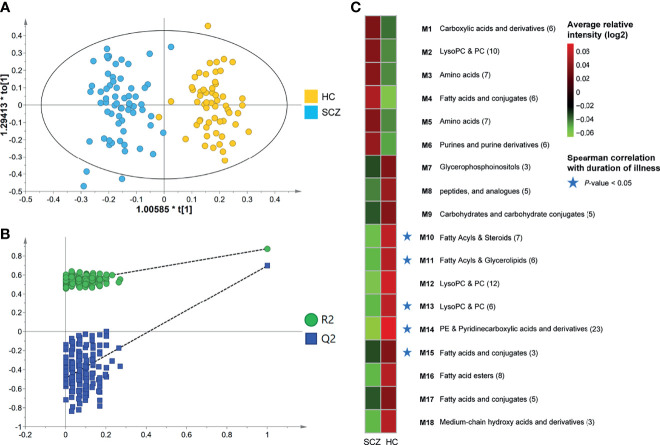
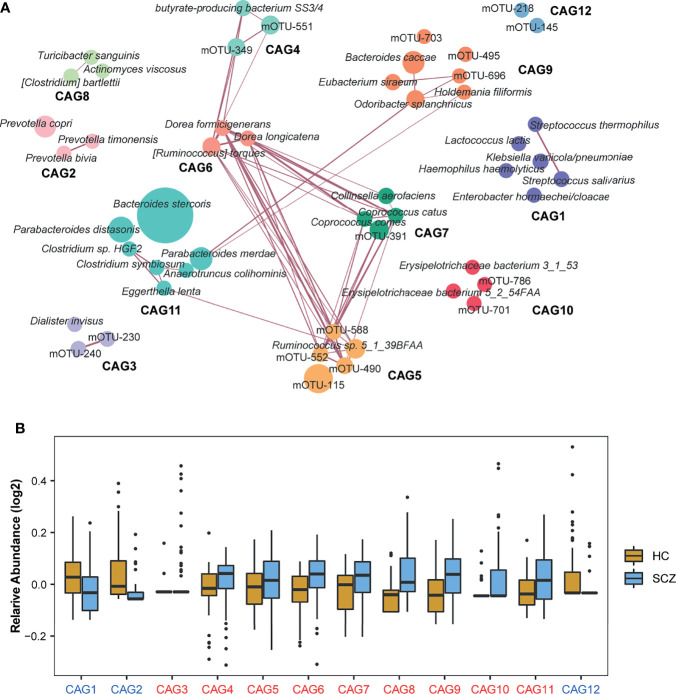
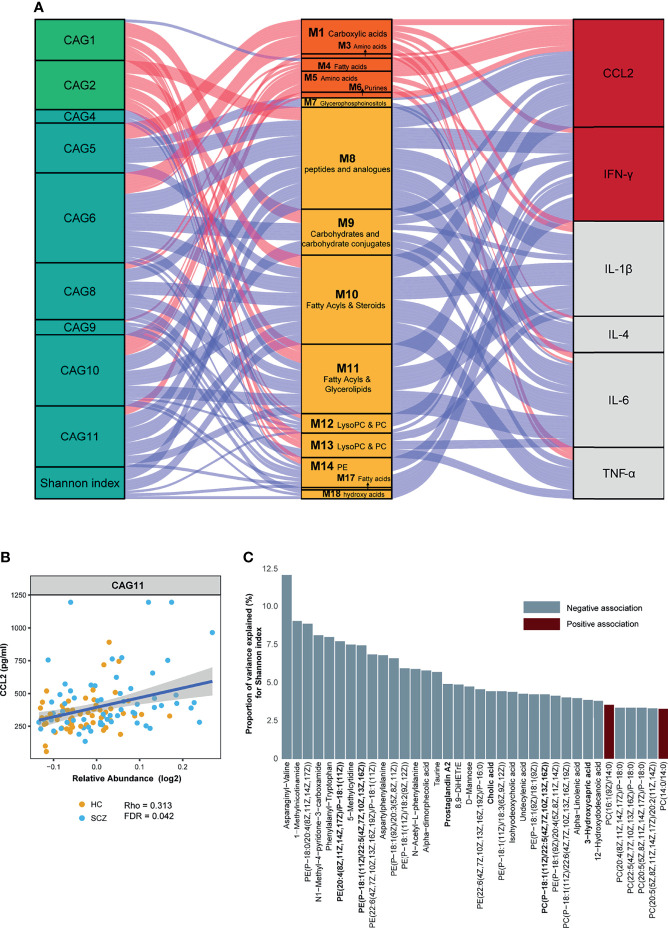
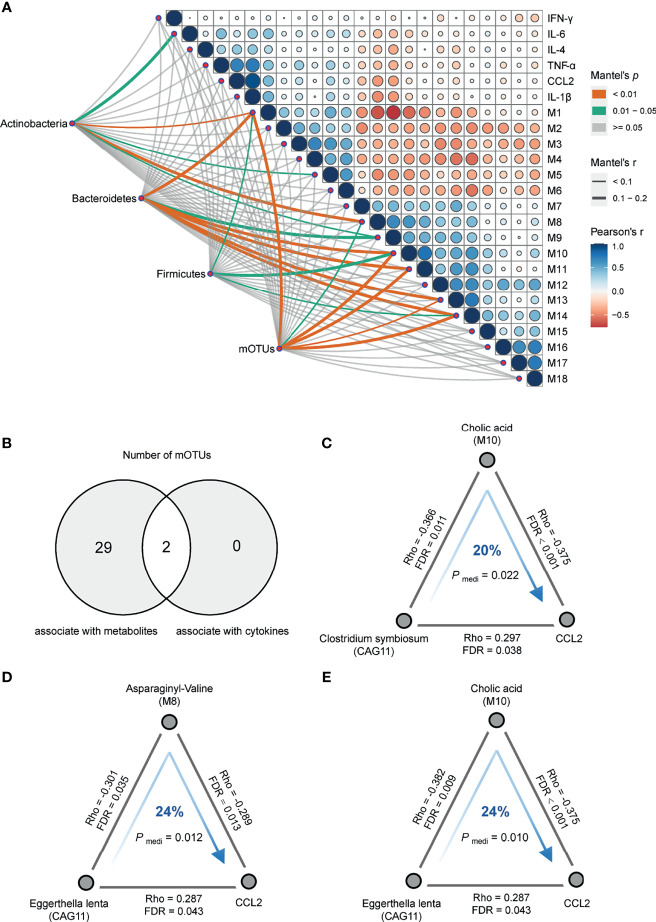
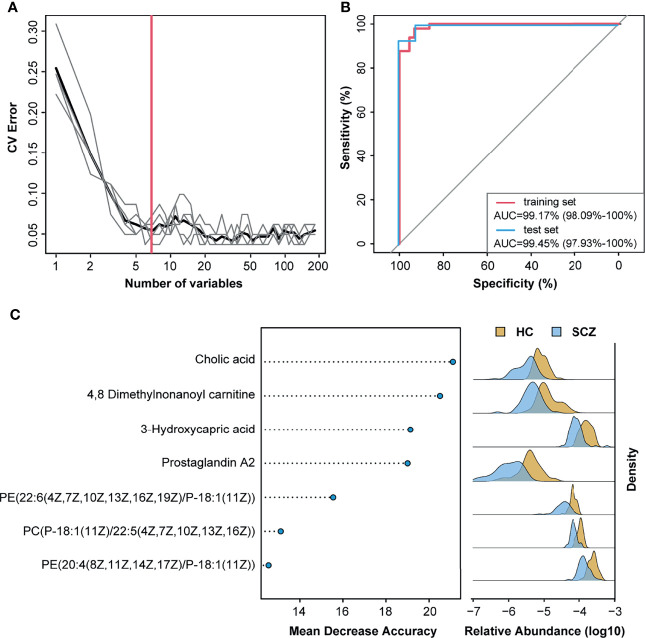
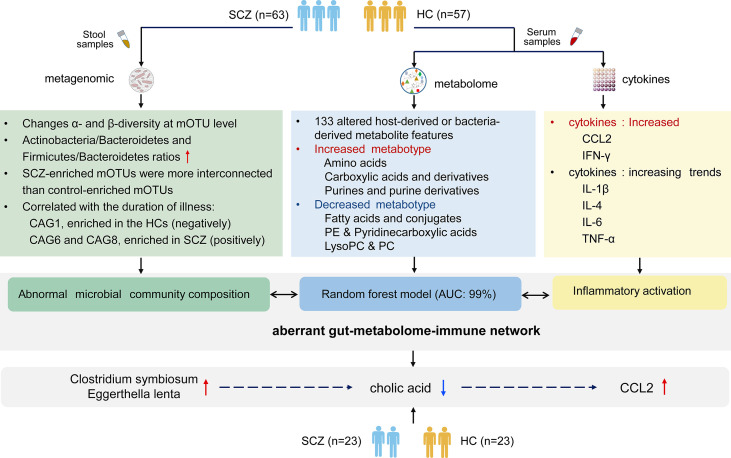
Schizophrenia (SCZ) is associated with several immune dysfunctions, including elevated levels of pro-inflammatory cytokines. Microorganisms and their metabolites have been found to regulate the immune system, and that intestinal microbiota is significantly disturbed in schizophrenic patients. To systematically investigate aberrant gut-metabolome-immune network in schizophrenia, we performed an integrative analysis of intestinal microbiota, serum metabolome, and serum inflammatory cytokines in 63 SCZ patients and 57 healthy controls using a multi-omics strategy. Eighteen differentially abundant metabolite clusters were altered in patients displayed higher cytokine levels, with a significant increase in pro-inflammatory metabolites and a significant decrease in anti-inflammatory metabolites (such as oleic acid and linolenic acid). The bacterial co-abundance groups in the gut displayed more numerous and stronger correlations with circulating metabolites than with cytokines. By integrating these data, we identified that certain bacteria might affect inflammatory cytokines by modulating host metabolites, such as amino acids and fatty acids. A random forest model was constructed based on omics data, and seven serum metabolites significantly associated with cytokines and α-diversity of intestinal microbiota were able to accurately distinguish the cases from the controls with an area under the receiver operating characteristic curve of 0.99. Our results indicated aberrant gut-metabolome-immune network in SCZ and gut microbiota may influence immune responses by regulating host metabolic processes. These findings suggest a mechanism by which microbial-derived metabolites regulated inflammatory cytokines and insights into the diagnosis and treatment of mental disorders from the microbial-immune system in the future.
Keywords: cytokines; gut microbiota; metabolism; metagenomics; schizophrenia.
Copyright © 2022 Fan, Gao, Ma, Yang, Zhao, He, Yang, Yan, Gao, Qian, Wang, Zhu and Ma.
Conflict of interest statement
The authors declare that the research was conducted in the absence of any commercial or financial relationships that could be construed as a potential conflict of interest.
Figures
Similar articles
-
Multi-omics analysis reveals the associations between altered gut microbiota, metabolites, and cytokines during pregnancy.mSystems. 2024 Mar 19;9(3):e0125223. doi: 10.1128/msystems.01252-23. Epub 2024 Feb 7. mSystems. 2024. PMID: 38323818 Free PMC article.
-
Machine learning-causal inference based on multi-omics data reveals the association of altered gut bacteria and bile acid metabolism with neonatal jaundice.Gut Microbes. 2024 Jan-Dec;16(1):2388805. doi: 10.1080/19490976.2024.2388805. Epub 2024 Aug 21. Gut Microbes. 2024. PMID: 39166704 Free PMC article.
-
Alterations in fecal bacteriome virome interplay and microbiota-derived dysfunction in patients with schizophrenia.Transl Psychiatry. 2025 Jan 29;15(1):35. doi: 10.1038/s41398-025-03239-0. Transl Psychiatry. 2025. PMID: 39880843 Free PMC article.
-
Gut microbiota-derived metabolites in the regulation of host immune responses and immune-related inflammatory diseases.Cell Mol Immunol. 2021 Apr;18(4):866-877. doi: 10.1038/s41423-021-00661-4. Epub 2021 Mar 11. Cell Mol Immunol. 2021. PMID: 33707689 Free PMC article. Review.
-
Understanding the Role of the Gut Microbiome and Microbial Metabolites in Obesity and Obesity-Associated Metabolic Disorders: Current Evidence and Perspectives.Curr Obes Rep. 2019 Sep;8(3):317-332. doi: 10.1007/s13679-019-00352-2. Curr Obes Rep. 2019. PMID: 31175629 Review.
Cited by
-
A preliminary metabolomics study of the database for biological samples of schizophrenia among Chinese ethnic minorities.BMC Psychiatry. 2024 Apr 9;24(1):262. doi: 10.1186/s12888-024-05660-z. BMC Psychiatry. 2024. PMID: 38594695 Free PMC article.
-
Uncovering metabolic dysregulation in schizophrenia and cannabis use disorder through untargeted plasma lipidomics.Sci Rep. 2024 Dec 28;14(1):31492. doi: 10.1038/s41598-024-83288-5. Sci Rep. 2024. PMID: 39733019 Free PMC article.
-
Alterations in innate immune defense distinguish first-episode schizophrenia patients from healthy controls.Front Psychiatry. 2022 Oct 13;13:1024299. doi: 10.3389/fpsyt.2022.1024299. eCollection 2022. Front Psychiatry. 2022. PMID: 36311523 Free PMC article.
-
Altered oral microbiota and immune dysfunction in Chinese elderly patients with schizophrenia: a cross-sectional study.Transl Psychiatry. 2023 Dec 9;13(1):383. doi: 10.1038/s41398-023-02682-1. Transl Psychiatry. 2023. PMID: 38071192 Free PMC article.
-
Plasma linoelaidyl carnitine levels positively correlated with symptom improvement in olanzapine-treated first-episode drug-naïve schizophrenia.Metabolomics. 2022 Jul 11;18(7):50. doi: 10.1007/s11306-022-01909-4. Metabolomics. 2022. PMID: 35819637
References
Publication types
MeSH terms
Substances
LinkOut - more resources
Full Text Sources
Medical