Review
. 2022 Mar 2:9:800152.
doi: 10.3389/fmolb.2022.800152. eCollection 2022.

UPMaBoSS: A Novel Framework for Dynamic Cell Population Modeling

Affiliations
Review

UPMaBoSS: A Novel Framework for Dynamic Cell Population Modeling

Gautier Stoll et al. Front Mol Biosci. .

Abstract

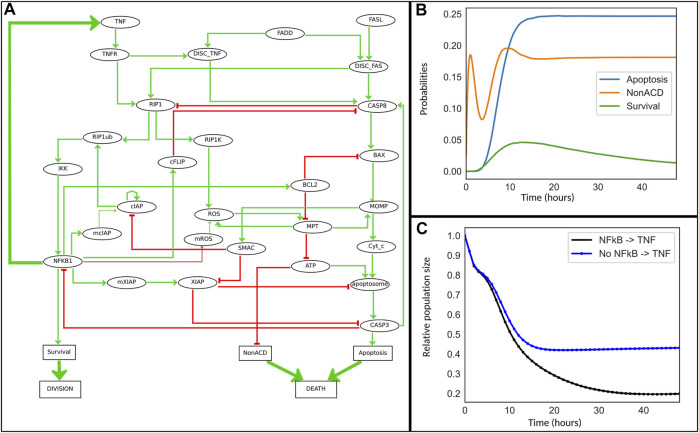
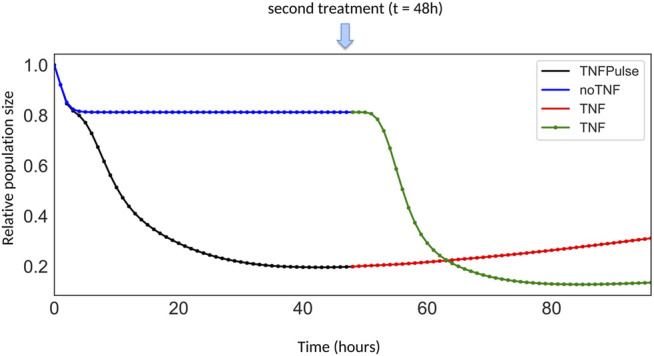
Mathematical modeling aims at understanding the effects of biological perturbations, suggesting ways to intervene and to reestablish proper cell functioning in diseases such as cancer or in autoimmune disorders. This is a difficult task for obvious reasons: the level of details needed to describe the intra-cellular processes involved, the numerous interactions between cells and cell types, and the complex dynamical properties of such populations where cells die, divide and interact constantly, to cite a few. Another important difficulty comes from the spatial distribution of these cells, their diffusion and motility. All of these aspects cannot be easily resolved in a unique mathematical model or with a unique formalism. To cope with some of these issues, we introduce here a novel framework, UPMaBoSS (for Update Population MaBoSS), dedicated to modeling dynamic populations of interacting cells. We rely on the preexisting tool MaBoSS, which enables probabilistic simulations of cellular networks. A novel software layer is added to account for cell interactions and population dynamics, but without considering the spatial dimension. This modeling approach can be seen as an intermediate step towards more complex spatial descriptions. We illustrate our methodology by means of a case study dealing with TNF-induced cell death. Interestingly, the simulation of cell population dynamics with UPMaBoSS reveals a mechanism of resistance triggered by TNF treatment. Relatively easy to encode, UPMaBoSS simulations require only moderate computational power and execution time. To ease the reproduction of simulations, we provide several Jupyter notebooks that can be accessed within the CoLoMoTo Docker image, which contains all software and models used for this study.

Keywords: cell interactions; heterogeneous cell population; logical model; pathway modeling; stochastic simulation.


Conflict of interest statement

The authors declare that the research was conducted in the absence of any commercial or financial relationships that could be construed as a potential conflict of interest.

Figures

FIGURE 1
FIGURE 1
Generic cell. A generic cellular network is constructed by assembling all the signaling pathways that can be activated in different cell types (here 3 cell types are considered: Type I, II, and III), including ligand-receptor interactions. Cells can die, divide or interact through ligand-receptor interactions.
FIGURE 2
FIGURE 2
Inputs and Outputs of an UPMaBoSS model. The notation is related to Figure 1: A, B, C, K, L, M represent genes/proteins; T_I, T_II, T_III represent cell types. (A) Inputs of UPMaBoSS: Transition rates for nodes: for each node (here K and L of Figure 1), a logical rule, the rate up and rate down are written; Formulas for updating receptors rates values: the update rules, starting by u = …, depend on the population state and regulate the value of the external variable $Receptor_rate of cell type I and II; and initial states: they can be defined such that cell types, proteins, etc. can be characterized as present (+) or absent (−) with a probability for this model state to be active initially. Colors correspond to cell types of Figure 1. Note that names starting with a $ correspond to external variables, specific to MaBoSS/UPMaBoSS, listed in bnd file, set up in cfg file and updated in upp file. (B) Ouputs of UPMaBoSS: time-dependent probabilities of cell types (upper panel, example of cell type II from Figure 1), with the corresponding model states (middle panel), and the time-dependent population size (lower panel).
FIGURE 3
FIGURE 3
Simple cell differentiation model. (A) Definition of the toy model with logical rules (upper panel) and conditional rule for R depending on the value of the external parameter innerOn. If innerOn is equal to 1, then A is able to activate L in all cells (middle panel). If innerOn is set to 0, then the value of R will depend on the population status of L (lower panel). (B) Model simulations of the two cases: when innerOn = 1, only T1 cell type can be reached; when innerOn = 0, a proportion of cells can differentiate into T2 cell type.
FIGURE 4
FIGURE 4
Cell fate model for TNFα resistance. (A) This model is an extension of the model reported in (Calzone et al., 2010). Some nodes representing the mRNA of cIAP, ROS and XIAP family members have been added. The ellipsoid nodes represent genes, mRNA, proteins, or complexes, while the rectangular nodes denote phenotypes. Green and red arrows represent positive and negative influences, respectively. The thick green arrows denote activating interactions added to the initial model: a feedback from NFκB to TNFα encodes the ligand-receptor activation, while the “Division” and “Death” nodes have been introduced specifically for UPMaBoSS population updates. (B) Simulation of the cell fate model with MaBoSS for 48 h. (C) Simulation of the model with UPMaBoSS: temporal evolution of population sizes with (black) and without (blue) the TNF paracrine signaling.
FIGURE 5
FIGURE 5
Growth curves for different TNF treatment scenarios. The first scenario corresponds to the simulation of cells initially treated by a pulse of TNF (black segment), followed by a constitutive TNF treatment at t = 48 h (red segment). The other scenario corresponds to the simulation of cells initially untreated (blue segment), but receiving a constitutive TNF treatment at t = 48 h (green segment).
FIGURE 6
FIGURE 6
Population ratio at from t = 48–96 h for three models. Population ratios for the four conditions in (A) wild type, (B) IKK knock-down, and (C) RIP1K knock-down.

References

    1. Abou-Jaoudé W., Traynard P., Monteiro P. T., Saez-Rodriguez J., Helikar T., Thieffry D., et al. (2016). Logical Modeling and Dynamical Analysis of Cellular Networks. Front. Genet. 7, 94. 10.3389/fgene.2016.00094 - DOI - PMC - PubMed
    1. Albert I., Thakar J., Li S., Zhang R., Albert R. (2008). Boolean Network Simulations for Life Scientists. Source Code Biol. Med. 3, 16. 10.1186/1751-0473-3-16 - DOI - PMC - PubMed
    1. Altinok A., Gonze D., Lévi F., Goldbeter A. (2011). An Automaton Model for the Cell Cycle. Interf. Focus. 1, 36–47. 10.1098/rsfs.2010.0009 - DOI - PMC - PubMed
    1. Anderson A. R. A., Weaver A. M., Cummings P. T., Quaranta V. (2006). Tumor Morphology and Phenotypic Evolution Driven by Selective Pressure from the Microenvironment. Cell 127, 905–915. 10.1016/j.cell.2006.09.042 - DOI - PubMed
    1. Baxevanis C. N., Sofopoulos M., Fortis S. P., Perez S. A. (2019). The Role of Immune Infiltrates as Prognostic Biomarkers in Patients with Breast Cancer. Cancer Immunol. Immunother. 68, 1671–1680. 10.1007/s00262-019-02327-7 - DOI - PMC - PubMed