. 2022 Mar 17;11(1):2049486.
doi: 10.1080/2162402X.2022.2049486. eCollection 2022.

QPCTL regulates macrophage and monocyte abundance and inflammatory signatures in the tumor microenvironment

Affiliations

QPCTL regulates macrophage and monocyte abundance and inflammatory signatures in the tumor microenvironment

Kaspar Bresser et al. Oncoimmunology. .

Abstract

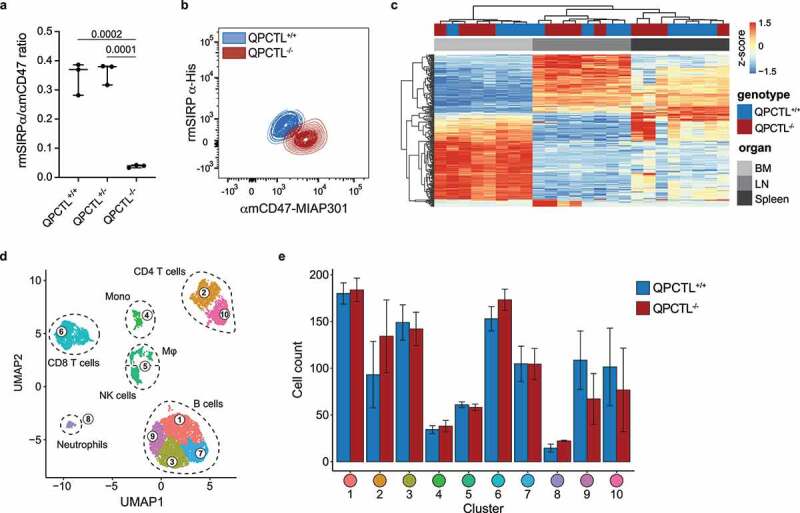
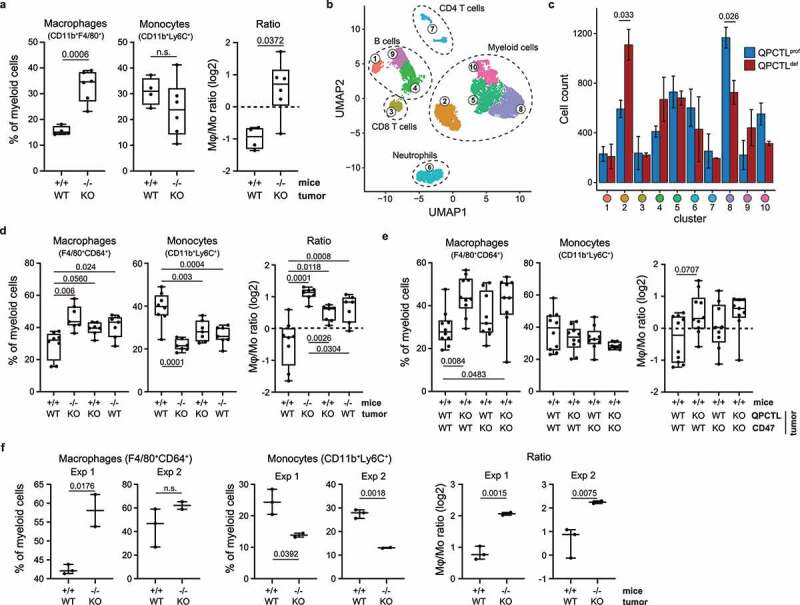
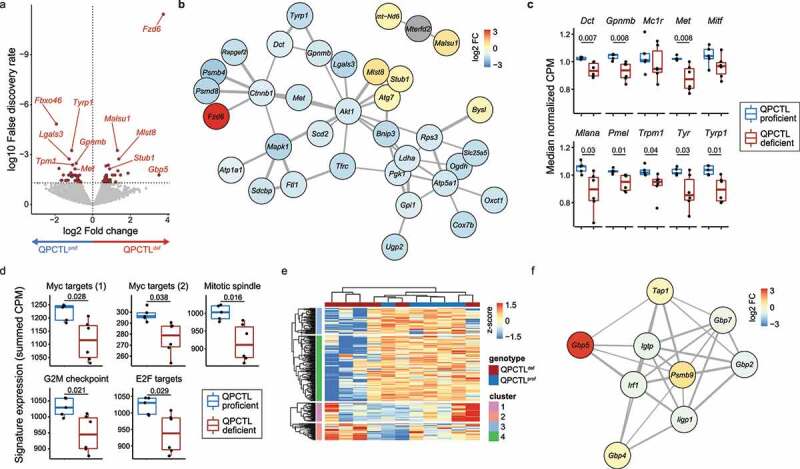
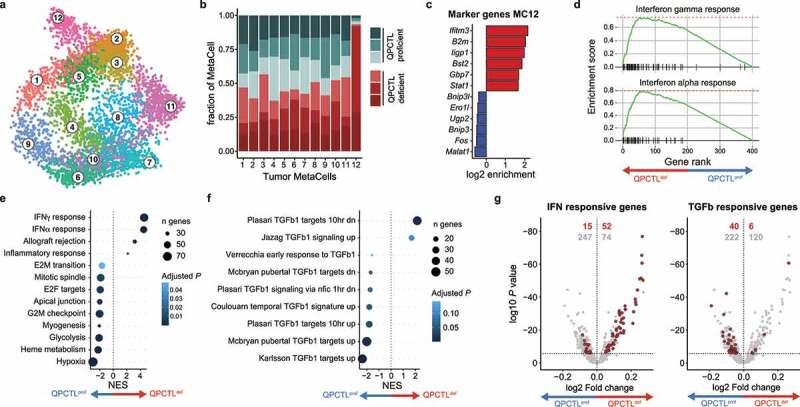
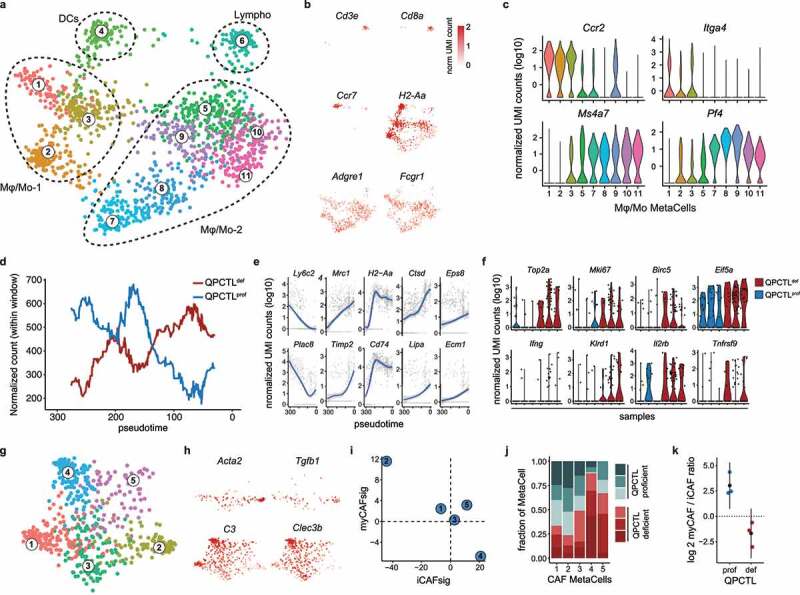
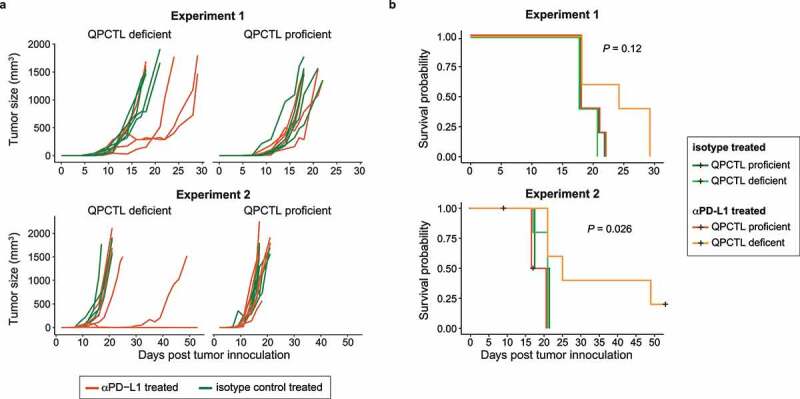
The enzyme glutaminyl-peptide cyclotransferase-like protein (QPCTL) catalyzes the formation of pyroglutamate residues at the NH2-terminus of proteins, thereby influencing their biological properties. A number of studies have implicated QPCTL in the regulation of chemokine stability. Furthermore, QPCTL activity has recently been shown to be critical for the formation of the high-affinity SIRPα binding site of the CD47 "don't-eat-me" protein. Based on the latter data, interference with QPCTL activity -and hence CD47 maturation-may be proposed as a means to promote anti-tumor immunity. However, the pleiotropic activity of QPCTL makes it difficult to predict the effects of QPCTL inhibition on the tumor microenvironment (TME). Using a syngeneic mouse melanoma model, we demonstrate that QPCTL deficiency alters the intra-tumoral monocyte-to-macrophage ratio, results in a profound increase in the presence of pro-inflammatory cancer-associated fibroblasts (CAFs) relative to immunosuppressive TGF-β1-driven CAFs, and leads to an increased IFN and decreased TGF-β transcriptional response signature in tumor cells. Importantly, the functional relevance of the observed TME remodeling is demonstrated by the synergy between QPCTL deletion and anti PD-L1 therapy, sensitizing an otherwise refractory melanoma model to anti-checkpoint therapy. Collectively, these data provide support for the development of strategies to interfere with QPCTL activity as a means to promote tumor-specific immunity.

Keywords: QPCTL; cancer-associated fibroblasts; genetically modified mouse model; tumor micro-environment.


Conflict of interest statement

M.E.W.L. and T.N.S. are inventors on a patent application that covers manipulation of the CD47-SIRPα axis via QPCTL. M.E.W.L. is a consultant for Third Rock Ventures, outside of this work. T.N.S. is advisor to and holds equity in Scenic Biotech that develops QPCTL inhibitors. T.N.S. is consultant for Third Rock Ventures and advisor to and stockholder in Allogene Therapeutics, Asher Bio, Merus, and Neogene Therapeutics, all outside of this work.

Figures

Figure 1.
Figure 1.
Generation and characterization of QPCTL-deficient mice. (a) Ratio of recombinant mouse (rm)SIRPα-His and anti-mouse (αm)CD47 antibody (clone MIAP301) binding to blood cells from QPCTL+/+, QPCTL+/-, and QPCTL−/− mice, as measured by flow cytometry. Dots depict the ratio of rmSIRPα-His/αmCD47-MIAP301 mean fluorescence intensity (MFI) on blood cells from individual mice, group medians are indicated and whiskers represent min/max, n = 3 mice per group. (b) Flow cytometry plot depicting data described in panel a for blood cells from a representative QPCTL+/+ and QPCTL−/− mouse. (c) Heatmap depicting hierarchical clustering performed on the 1,000 most differentially expressed genes in bone marrow (BM), lymph node (LN) and spleen samples from QPCTL+/+ and QPCTL−/− mice. (d-e) Unbiased Euclidean distance-based clustering of immune cells obtained from spleens of QPCTL+/+ and QPCTL−/− mice. UMAP 2-dimensional projection (d) depicts the obtained clusters. Cell counts of both genotypes within each cluster are depicted (e). Bars indicate group means, error bars represent standard error of the mean. P values were determined by one-way ANOVA followed by Tukey’s HSD test (a) or by two-sided Student’s T test with Bonferroni correction for multiple testing (e). Significant P values (< 0.05) are indicated in the plots. Data are representative of 3 independent experiments (a-b), or were obtained in a single experiment (c-d). UMAP, Uniform Manifold Approximation and Projection.
Figure 2.
Figure 2.
Tumor and host QPCTL deficiency alters the Mφ-Mo ratio in the TME. (a) Frequency of macrophages and monocytes of myeloid cells (CD11b+), and Mφ-Mo ratio, in the TME of QPCTL+/+ (n = 4) and QPCTL−/− (n = 6) mice inoculated with QPCTL-WT or QPCTL-KO B16F10 melanoma cells, respectively. Tumors were analyzed between 14–16 days post inoculation. (b) UMAP visualizing 30,000 cells sampled from the data shown in a. 5,000 cells were randomly drawn from each sample (n = 3 mice per group) prior to analysis. Colors indicate clusters obtained by Euclidean distance-based hierarchical clustering, cluster phenotype is shown in Supplementary Fig 2 f. (c) Contribution of cells from QPCTL-proficient (n = 3) and QPCTL-deficient (n = 3) TMEs to each cluster shown in panel b. Bars indicate group means, error bars represent standard error of the mean. (d) Frequency of macrophages and monocytes of myeloid cells (CD11b+), and Mφ-Mo ratio, in the TME of QPCTL+/+ and QPCTL−/− mice inoculated with either QPCTL-WT or QPCTL-KO B16F10 melanoma cells (n = 7–8 per group). Tumors were analyzed between 12–14 days post inoculation. (e) Frequency of macrophages and monocytes of myeloid cells (CD11b+), and Mφ-Mo ratio, in the TME of QPCTL+/+ mice inoculated with QPCTL-WT, QPCTL-KO, CD47-KO, or CD47/QPCTL double-KO (dKO) B16F10 cells. Tumors were analyzed between 14–16 days post inoculation. (f) Frequency of macrophages and monocytes of myeloid cells (CD11b+), and Mφ-Mo ratio, in the TME of QPCTL+/+ and QPCTL−/− mice inoculated with QPCTL-WT and QPCTL-KO MC38 cells, respectively. Data from 2 independent experiments are shown (n = 5 per experiment). Tumors were analyzed at 22 (experiment 1) or 29 (experiment 2) days post inoculation. Dots indicate measurements from individual mice, group medians are indicated and whiskers represent min/max. P values were determined by two-sided Student’s T test without (a, f) or with Bonferroni correction for multiple testing (c), or by one-way ANOVA followed by Tukey’s HSD test (d, e). Significant P values (< 0.05) are indicated in the plots. For all boxplots, dots represent individual mice, group median and 25th/ 75th percentiles are indicated by the box, whiskers indicate min/max. Data are representative of at least 2 independent experiments (a, d, f), or were obtained in a single experiment (b, c, e). UMAP, uniform manifold approximation and projection.
Figure 3.
Figure 3.
QPCTL deficiency results in suppression of melanogenesis and cell metabolism. mRNA sequencing was performed on sorted CD45-negative cells from QPCTL-proficient (n = 5) and QPCTL-deficient (n = 6) B16F10 TMEs. Tumors were harvested at day 14 post inoculation. (a) Differential gene expression analysis comparing CD45-negative cells obtained from QPCTL deficient versus QPCTL-proficient TMEs. Genes with a false discovery rate (FDR) < 0.05 are indicated in red. Selected genes are indicated in the plot. (b) network analysis (StringDB) performed on all significantly (FDR < 0.05) differentially expressed genes. Genes with a medium interaction strength (> 0.4) are included. Line thickness indicates interaction strength. Nodes are colored based on log2 fold differences obtained in a. (c) Transcript abundance of selected genes in the melanogenesis pathway. Boxplots indicate group median and 25th /75th percentiles, whiskers indicate the interquartile range multiplied by 1.5, dots signify individual samples. (d) Signature expression of cell cycle-associated hallmark signatures from MSigDB, calculated as the summed CPM of all genes within each signature. Boxplots indicate group median and 25th /75th percentiles, whiskers indicate the interquartile range multiplied by 1.5, dots signify individual samples. (e) Hierarchical clustering of the 1,000 most differentially expressed genes across all samples, depicted as a row-normalized heatmap. (f) Network analysis (StringDB) performed on genes from cluster 2 (e). Genes with a medium interaction strength (> 0.4) are included. Line thickness indicates interaction strength. Nodes are colored based on log2 fold differences obtained in panel a. P values were determined by one-way ANOVA followed by Tukey’s HSD test (c, d). Significant P values (< 0.05) are indicated in the plots. Data are representative of 2 independent experiments. CPM, counts per million; MSigDB, Molecular Signatures Database.
Figure 4.
Figure 4.
QPCTL deficiency leads to an increased IFN- and decreased TGF-β-response signature in tumor cells. scRNA sequencing was performed on sorted live cells from QPCTL-proficient (n = 3) and QPCTL-deficient (n = 3) B16F10 TMEs. Tumors were harvested at day 14 post inoculation. (a) 2-dimensional MetaCell projection of the tumor cell compartment. Single cells are colored by MetaCell. (b) Stacked bar chart depicting the sample composition of each tumor cell MetaCell. Cell counts from each sample were normalized to 1,000 cells. (c) Enrichment of marker genes (6 highest and lowest expressed) in tumor cell MetaCell 12. (d) Gene set enrichment analysis performed on the top and bottom 200 genes expressed by MC12 (see Supplementary Fig. 7b). Gene-enrichment plots for the IFNγ and IFNα response gene-sets are depicted. (e-f) Differential gene expression analysis comparing tumor cells derived from QPCTL-proficient and QPCTL-deficient TMEs, followed by gene set enrichment analysis using either hallmark (e) or immunologic signature (f) gene sets from MSigDB. Results obtained from the immunologic signature gene sets were filtered for those containing “TGFb”. Gene sets with a P < .05 are shown. (g) Volcano plots depicting differential gene expression analysis. Horizontal line indicates an adjusted P value cutoff of 0.05. IFN (left) or TGF-β (right) signature genes are highlighted in red (see Supplementary Table 1 for signature genes). Red numbers denote quantity of significant differentially expressed genes within the signature, gray numbers denote the quantity of remaining differentially expressed genes. Depicted data were obtained in a single experiment, consisting of 6 mice. NES, normalized enrichment score; MSigDB, Molecular Signatures Database.
Figure 5.
Figure 5.
QPCTL deficiency alters the immune cell compartment and CAF polarization in the TME. scRNA sequencing was performed on sorted live cells from QPCTL-proficient (n = 3) and QPCTL-deficient (n = 3) B16F10 TMEs. Tumors were harvested at day 14 post inoculation. (a, b) 2-dimensional MetaCell projection of the immune cell compartment. Single cells are colored by metacell (a), or normalized UMI count (b) of selected genes. (c) Violin plots depicting normalized UMI counts of selected genes across Mφ/Mo MCs. (d,e) Slingshot trajectory analysis performed on Mφ/Mo subset 1 (MC1, 2 and 3). (d) QPCTL-deficient or QPCTL-proficient TMEs replicates were pooled, and normalized cell counts were tallied within windows of 60 cells wide, sliding 1 cell per frame. Lines indicate normalized cell counts within each window. (e) Normalized UMI counts of selected genes that are significantly associated with pseudotime. Blue lines indicate general additive linear models, grayed areas indicate confidence intervals, gray dots represent single cells. (f) Violin plots depicting normalized UMI counts of selected genes within the CD3+ lymphoid cell MetaCell (MC6). (g, h) 2-dimensional metacell projection of the fibroblast compartment. Single cells are colored by MetaCell (g), or normalized UMI count (h) of selected genes. (i) Enrichment of iCAF and myCAF signatures (Supplementary Table 2) in each CAF MetaCell. Signature values represent summed log2 transformed enrichment values, calculated using the MetaCell algorithm. (j) Stacked bar chart depicting sample composition of each CAF MetaCell. Cell counts from each sample were normalized to 1,000 cells. (k) myCAF/iCAF ratio detected in QPCTL-proficient and -deficient TMEs. Colored dots indicate individual mice, black dots indicate means, whiskers indicate the standard deviation. Depicted data were obtained in a single experiment, consisting of 6 mice. iCAF, inflammatory cancer-associated fibroblast; myCAF, myofibroblastic cancer-associated fibroblast; UMI, unique molecular identifier.
Figure 6.
Figure 6.
QPCTL deficiency sensitizes the tumor microenvironment to anti-PD-L1 treatment. QPCTL+/+ and QPCTL−/− mice were inoculated with QPCTL-WT and QPCTL-KO B16F10 melanoma cells, respectively. Each group subsequently received either anti-PD-L1 or isotype control antibody treatment at day 7, 9 and 11 post tumor inoculation. (a) Tumor growth curves, assessed until day 50 post tumor inoculation. Lines represent individual mice. Data from two experiments are depicted (n = 5 per group). (a) Survival probabilities of mice treated with anti-PD-L1 or isotype control antibody in a QPCTL-proficient and -deficient setting. Black plus-signs indicate censored events. Data from two experiments are depicted (n = 5 per group). Global P values were determined by log-rank test (b). Data from 2 independent experiments are depicted.

References

    1. Rumpret M, Drylewicz J, Ackermans L.J, et al. Functional categories of immune inhibitory receptors. Nat Rev Immunol. 2020;20(12):771–14. doi: 10.1038/s41577-020-0352-z. - DOI - PubMed
    1. Jaiswal S, Jamieson CHM, Pang WW, Park CY, Chao MP, Majeti R, Traver D, van Rooijen N, Weissman IL.. CD47 Is upregulated on circulating hematopoietic stem cells and leukemia cells to avoid phagocytosis. Cell. 2009;138(2):271–285. doi: 10.1016/j.cell.2009.05.046. - DOI - PMC - PubMed
    1. Majeti R, Chao MP, Alizadeh AA, Pang WW, Jaiswal S, Gibbs KD, van Rooijen N, Weissman IL. CD47 is an adverse prognostic factor and therapeutic antibody target on human acute myeloid leukemia stem cells. Cell. 2009;138(2):286–299. doi: 10.1016/j.cell.2009.05.045. - DOI - PMC - PubMed
    1. Zhao XW, van Beek E.M, Schornagel K, et al. CD47–signal regulatory protein-α (SIRPα) interactions form a barrier for antibody-mediated tumor cell destruction. Proc National Acad Sci. 2011;108(45):18342–18347. doi: 10.1073/pnas.1106550108. - DOI - PMC - PubMed
    1. Cynis H, Rahfeld J-U, Stephan A, Kehlen A, Koch B, Wermann M, Demuth H-U, Schilling S. Isolation of an Isoenzyme of human glutaminyl cyclase: retention in the golgi complex suggests involvement in the protein maturation machinery. J Mol Biol. 2008;379(5):966–980. doi: 10.1016/j.jmb.2008.03.078. - DOI - PubMed

Publication types