. 2022 Mar 16;11(1):2052418.
doi: 10.1080/2162402X.2022.2052418. eCollection 2022.

Neutrophil extracellular traps induce tumor metastasis through dual effects on cancer and endothelial cells

Affiliations

Neutrophil extracellular traps induce tumor metastasis through dual effects on cancer and endothelial cells

Ze-Zhou Jiang et al. Oncoimmunology. .

Abstract

Neutrophils constitute a major component in human hepatocellular carcinoma (HCC) and can facilitate disease progression via poorly understood mechanisms. Here, we show that neutrophil extracellular traps (NETs) formation was increased in human HCC tumor tissues than in paired non-tumor liver tissues. Mechanism study revealed that tumor-induced metabolic switch toward glycolysis and pentose phosphate pathway in tumor infiltrating neutrophils promoted NETs formation in a reactive oxygen species dependent-manner. NETs subsequently induced the migration of cancer cells and down-regulation of tight junction molecules on adjacent endothelial cells, thus facilitating tumor intravasation and metastasis. Accordingly, NETs depletion could inhibit tumor metastasis in mice in vivo, and the infiltration levels of NETs-releasing neutrophils were negatively associated with patient survival and positively correlated with tumor metastasis potential of HCC patients. Our results unveiled a pro-metastatic role of NETs in the milieu of human HCC, and pointed to the importance of metabolic reprogramming in shaping their characteristics, thus providing an applicable efficient target for anti-cancer therapies.

Keywords: Neutrophils; hepatocellular carcinoma; metabolic switch; neutrophil-extracellular traps; tumor metastasis.


Conflict of interest statement

The authors declare no competing financial interests.

Figures
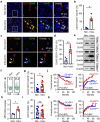
Figure 1.
Figure 1.
Elevated NETs released by tumor neutrophils predict poor survival of patients with HCC. (a, b) Paraffin-embedded HCC samples were double-stained with anti-human CD15 antibody (red) and anti-human Cit-H3 antibody (green). The distribution of CD15+ Cit-H3+ cells was analyzed by confocal microscopy (n = 4). Blue: DAPI. (c, d) Neutrophils were purified from paired non-tumor (Non-) and tumor tissue (Intra-) of human HCC, and seeded to cover slides before being stained with anti-human CD15 antibody (red), anti-human Cit-H3 antibody (green), and DAPI (blue). Their release of DNA and levels of Cit-H3 expression were visualized and evaluated via confocal microscopy (n = 4). (e-h) Neutrophils were purified from paired non-tumor and tumor tissue of human HCC, and their levels of Cit-H3 expression were evaluated by western blotting (e, n = 4; patients 1–3 have metastasis while patient 4 not) and flow cytometry analysis (f, g, n = 13). Levels of MPO-DNA complex were measured by MPO-DNA complex ELISA kit (h, n = 3). (i) Levels of CD15+ neutrophils infiltration in paired non-tumor and tumor tissues of HCC were analyzed by flow cytometry (n = 13). (j, k) HCC patients, who received curative resection with follow-up data, were divided into two groups according to the median value of Cit-H3+ cell density in tumor (j) or non-tumor (k) tissues (Cit-H3+ cell: low, ≤ 8 cells per high powered field [n = 40]; high, > 8 cells per high powered field [n = 40] in tumor tissues; Cit-H3+ cell: low, ≤ 1 cells per high powered field [n = 40]; high, > 1 cells per high powered field [n = 40] in non-tumor tissues). The overall survival rate (OS) and recurrence of these patients were analyzed with Kaplan–Meier method and Log-rank test. Results shown in b, d, g, h and i are expressed as the means ± SEMs. The following statistical analyses were performed: Mann–Whitney test (b), Student’s t-test (d, g, h, i), Log-rank test (j, k). * P < .05, ** P < .01, ns, not significant.
Figure 2.
Figure 2.
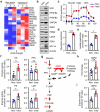
Glycolysis is significantly enhanced in neutrophils infiltrating HCC tumor tissues. CD15+ cells were purified from paired non-tumor (Non-) and tumor tissues (Intra-) of HCC patients. (a, b) The mRNA and protein levels of key glycolysis-related enzymes in these cells were quantified by Q-PCR and western blotting, respectively (n = 3). (c, d) The extracellular acidification rate (ECAR) of these cells was measured with a seahorse analyzer (n = 3). (e) The levels of lactate production by these cells after 12 hours of ex vivo culture was measured with a lactate assay kit (n = 3). (f, g) The enzyme activity of HK, PFK, PK, and LDH in these cells was quantified after purification (n = 3). (h) The levels of G6PD gene expression by these cells were quantified by Q-PCR (n = 5). (i) The enzyme activity of G6PD in these cells was evaluated after purification (n = 3). Results shown in d to i are expressed as the means ± SEMs. The following statistical analyses were performed: Student’s t-test (d, e, f, h, i), * P < .05, ** P < .01, *** P < .001, ns, not significant.
Figure 3.
Figure 3.
Glycolytic activation mediates the release of NETs by tumor neutrophils. (a) CD15+ cells were purified from paired non-tumor and tumor tissues of HCC patients, and their levels of Cit-H3 and GLUT1 expression were quantified by western blotting (n = 3). (b-d) CD15+ cells were purified from tumor tissues of HCC patients. The levels of and correlations between Cit-H3 and GLUT1 expression in these cells were analyzed by flow cytometry (n = 6 in b, c; n = 14 in d). (e) Paraffin-embedded HCC samples were stained with anti-human CD15 antibody (red), anti-human Cit-H3 antibody (white), anti-human GLUT1 antibody (green), and DAPI (blue). The co-expression of Cit-H3 and GLUT1 on CD15+ tumor-infiltrating neutrophils was analyzed by confocal microscopy (n = 3). (f, g) CD15+ cells were purified from peripheral blood of healthy donors and treated with 30% primary HCC cancer cell supernatants (T-SN) or paired non-tumor liver cell supernatants (N-SN) for 12 hours, in the presence or absence of glycolytic inhibitor 2DG or G6PD inhibitor 6AN. These cells were then stained with anti-human Cit-H3 antibody (green), and their release of DNA and levels of Cit-H3 expression were visualized and evaluated by confocal microscopy (n = 3). Blue: DAPI. Results shown in c, f, and g are expressed as the means ± SEMs. The following statistical analyses were performed: Student’s t-test (c), Pearson correlation and linear regression analysis (d), one-way ANOVA with Bonferroni posttest (f, g). * P < .05, ** P < .01, *** P < .001.
Figure 4.
Figure 4.
Glycolytic activation induced the release of NETs via NOX-ROS pathway. CD15+ cells were purified from peripheral blood of healthy donors and treated with 30% primary HCC cancer cell supernatants (T-SN) or paired non-tumor liver cell supernatants (N-SN) for 12 hours, in the presence or absence of 2DG, or 6AN, or DPI. (a) The enzyme activity of NOX in these cells was quantified (n = 3). (b-d) Levels of ROS production by these cells were evaluated by flow cytometry (n = 6). (e, f) Levels of Cit-H3 expression in these cells were analyzed by confocal microscopy (n = 6). Green: Cit-H3; Blue: DAPI. (g, h) CD15+ cells were purified from tumor tissues of HCC patients. Correlations between levels of ROS, GLUT1, and Cit-H3 expression in these cells were determined by flow cytometry (n = 12). Results shown in a, c, d, and f are expressed as the means ± SEMs. The following statistical analyses were performed: Student’s t-test (a), Kruskal–Wallis test followed by Dunn’s posttest (c, d), one-way ANOVA with Bonferroni posttest (f), Pearson correlation and linear regression analysis (g, h). * P < .05, ** P < .01, *** P < .001.
Figure 5.
Figure 5.
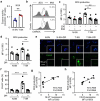
NETs up-regulate the migratory ability of cancer cells. CD15+ neutrophils were purified from peripheral blood of healthy donors. (a, b) CD15+ neutrophils were treated with 30% primary HCC cancer cell supernatants (T-SN) or paired non-tumor liver cell supernatants (N-SN) for 12 hours, in the presence or absence of DNase I, before being stained with anti-human Cit-H3 antibody. Their release of DNA (blue) and levels of Cit-H3 expression (green) in total CD15+ cells were visualized and evaluated by confocal microscopy (n = 3 to 4). (c, d) CFSE-stained HepG2 cells were added to the upper chamber of an endothelial-cell-pre-seeded transwell system, with the combination of N-SN-pretreated neutrophils (N-Neu) or T-SN-pretreated neutrophils (T-Neu), in the presence or absence of DNase I. The trans-endothelial migration of HepG2 cells were calculated after 10 hours culture (n = 4). The data of “HepG2 + N-Neu” group was normalized to 100%. (e) HepG2 cells were cultured with N-Neu or T-Neu in the presence or absence of DNase I for 12 hours before being washed and seeded into the upper chamber of a transwell system. The transmembrane migration ability of HepG2 cells were calculated after 10 hours culture (n = 4). (f) CD15+ cells were pre-treated with 30% N-SN, or T-SN for 12 hours. These cells were then washed and cultured for another 4 hours before their NETs were harvested (designated as N-NET or T-NET, respectively). Levels of PR3, MPO and Cit-H3 expression in NETs were analyzed by western blotting (n = 3). (g) HepG2 cancer cells were pre-treated with N-NET or T-NET for 12 hours before being seeded into the upper chamber of a transwell system. The transmembrane migration ability of HepG2 cancer cells were calculated after 10 hours’ culture (n = 5). (h) Statistics of e and g were shown, and data of the “HepG2 + N-Neu” group was normalized to 100%. Results shown in b, d, and h are expressed as the means ± SEMs. The following statistical analyses were performed: one-way ANOVA with Bonferroni posttest (b, d, h), Student’s t-test (comparison between N-NET and T-NET groups in h). * P < .05, ** P < .01, *** P < .001.
Figure 6.
Figure 6.
NETs induce the down-regulation of VE-cadherin on endothelial cells and correlate with tumor vasculature integrity. (a-c) CD15+ neutrophils were purified from peripheral blood of healthy donors. These cells were pre-treated with 30% non-tumor liver cell supernatants (N-SN) or primary HCC cancer cell supernatants (T-SN) for 12 hours, and then washed and cultured for another 4 hours to harvested NET (N-NET or T-NET, respectively). HUVEC cells were left untreated or treated with N-NET or T-NET for 12 hours. Their levels of p120 expression were quantified by western blotting. Levels of VE-cad expression in HUVEC were analyzed by both western blotting (a) and confocal microscopy (b) (n = 5). Red: VE-cad; Blue: DAPI. (d-f) CD15+ neutrophils were purified from peripheral blood of healthy donors and treated with 30% N-SN or T-SN for 12 hours (designated as N-Neu and T-Neu respectively) before being washed and co-cultured with HUVEC cells, in the presence or absence of DNase I. The wells were washed after 12 hours’ co-culture to remove neutrophils, and levels of p120 expression in HUVEC cells were quantified by western blotting. Levels of VE-cad expression in HUVEC cells were analyzed by both western blotting (d) and confocal microscopy (e) (n = 5). Red: VE-cad; Blue: DAPI. (g, h) Paraffin-embedded HCC samples were stained with anti-human CD31 antibody (yellow), anti-human CD15 antibody (red), anti-human Cit-H3 antibody (green), anti-human VE-cad antibody (white), and DAPI (blue). The distribution of different signals was determined by confocal microscopy (g). The micrograph of each patient was divided into 100 μm×100 μm grids. 8 grids with positive VE-cad expression on CD31+ cells (VE-cad+) and 8 grids with negative VE-cad expression on CD31+ cells (VE-cad) were randomly selected, and the infiltration levels of Cit-H3+ cells in these grids were calculated (h). (n = 3). Results shown in c, f, and h are expressed as the means ± SEMs. The following statistical analyses were performed: one-way ANOVA with Bonferroni posttest (c, f), Student’s t-test (h). * P < .05, *** P < .001.
Figure 7.
Figure 7.
NETs depletion inhibits tumor growth in mice in vivo. (a-d) Neutrophils purified from the peripheral blood of healthy donors were treated with or without HepG2 tumor supernatants (30%) in the presence or absence of DNase I or GSK484 (PAD4 inhibitor) for 12 hours. Cells were then gently washed and intravenously injected into NOD/SCID mice with established intra-hepatic HepG2 tumors every 2 days. After 14 days, mice were sacrificed. (a, b) Paraffin-embedded hepatoma samples were stained with Cit-H3 antibodies, and tumor sizes (d) and lung metastasis (c) were measured and counted respectively. (e-g) DNase I, GSK484, or DMSO were intraperitoneal injected into C57BL/6 wildtype mice with established intra-hepatic Hepa1-6 tumors daily for 14 days. (f) Paraffin-embedded hepatoma samples were stained with Cit-H3 antibodies, and tumor sizes (e) and lung metastasis (g) were measured and counted respectively. There were 4 representatives for each group in a-g. Results shown in b to g were expressed as the means ± SEMs. The following statistical analyses were performed: one-way ANOVA with Bonferroni posttest (b, e, f), Kruskal–Wallis test followed by Dunn’s posttest (c, d, g). * P < .05, ** P < .01, ns, not significant.

References

    1. Brinkmann V, Reichard U, Goosmann C, Fauler B, Uhlemann Y, Weiss DS, Weinrauch Y, Zychlinsky A.. Neutrophil extracellular traps kill bacteria. Science. 2004;303(5663):1532–16. doi:10.1126/science.1092385. - DOI - PubMed
    1. Urban CF, Reichard U, Brinkmann V, Zychlinsky A. Neutrophil extracellular traps capture and kill Candida albicans yeast and hyphal forms. Cell Microbiol. 2006;8(4):668–676. doi:10.1111/j.1462-5822.2005.00659.x. - DOI - PubMed
    1. Zawrotniak M, Rapala-Kozik M. Neutrophil extracellular traps (NETs) - formation and implications. Acta Biochim Pol. 2013;60(3):277–284. doi:10.18388/abp.2013_1983. - DOI - PubMed
    1. Papayannopoulos V, Metzler KD, Hakkim A, Zychlinsky A. Neutrophil elastase and myeloperoxidase regulate the formation of neutrophil extracellular traps. J Cell Biol. 2010;191(3):677–691. doi:10.1083/jcb.201006052. - DOI - PMC - PubMed
    1. Wang Y, Li M, Stadler S, Correll S, Li P, Wang D, Hayama R, Leonelli L, Han H, Grigoryev SA, et al. Histone hypercitrullination mediates chromatin decondensation and neutrophil extracellular trap formation. J Cell Biol. 2009;184(2):205–213. doi:10.1083/jcb.200806072. - DOI - PMC - PubMed

Publication types