. 2022 Mar 2:10:769853.
doi: 10.3389/fcell.2022.769853. eCollection 2022.

Abnormalities in Cortical GABAergic Interneurons of the Primary Motor Cortex Caused by Lis1 (Pafah1b1) Mutation Produce a Non-drastic Functional Phenotype

Affiliations

Abnormalities in Cortical GABAergic Interneurons of the Primary Motor Cortex Caused by Lis1 (Pafah1b1) Mutation Produce a Non-drastic Functional Phenotype

E Domínguez-Sala et al. Front Cell Dev Biol. .

Abstract

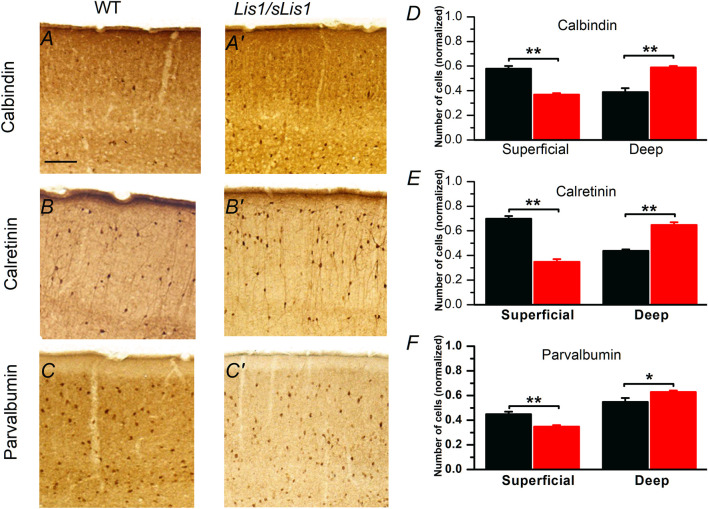
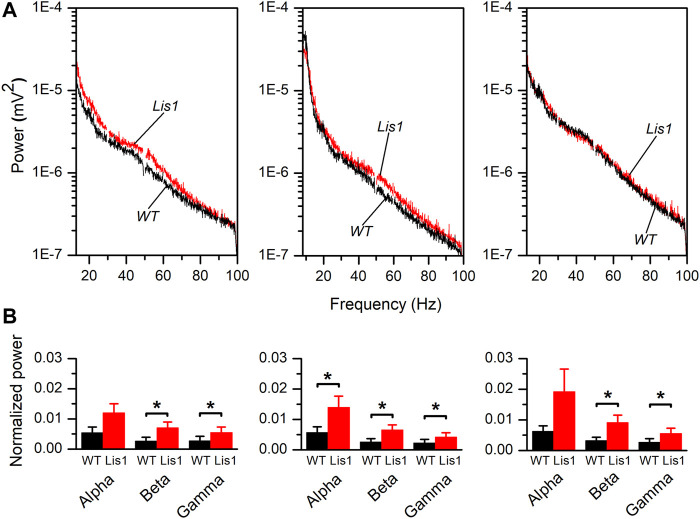
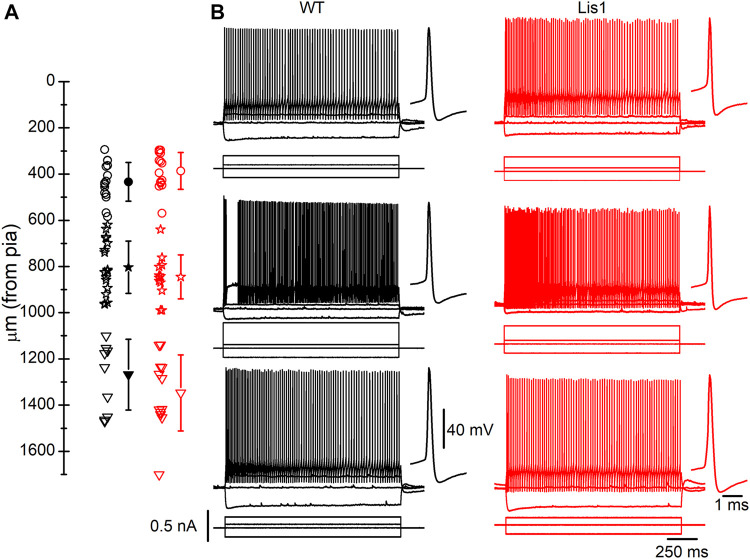
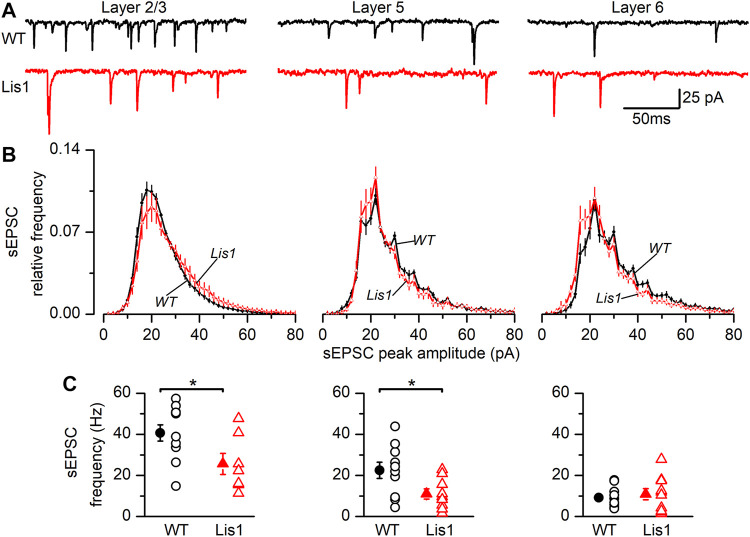
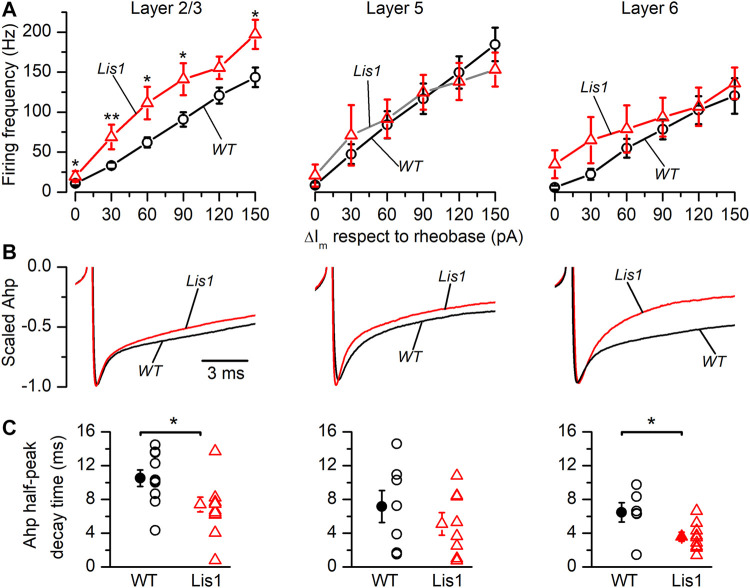
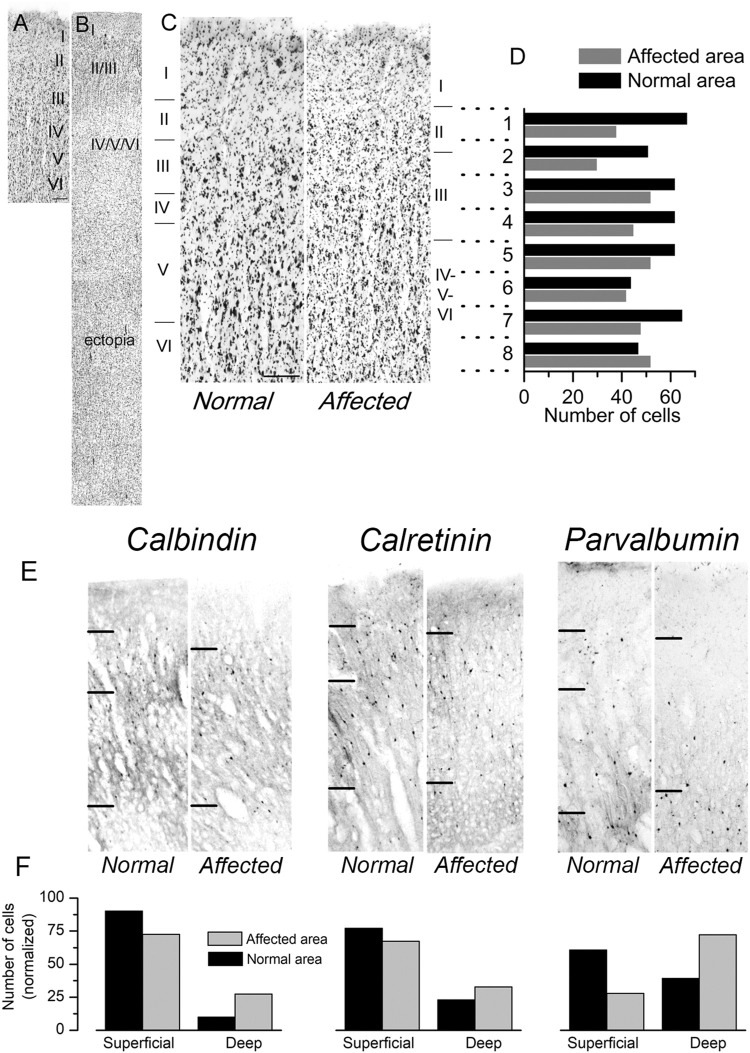
LIS1 (PAFAH1B1) plays a major role in the developing cerebral cortex, and haploinsufficient mutations cause human lissencephaly type 1. We have studied morphological and functional properties of the cerebral cortex of mutant mice harboring a deletion in the first exon of the mouse Lis1 (Pafah1b1) gene, which encodes for the LisH domain. The Lis1/sLis1 animals had an overall unaltered cortical structure but showed an abnormal distribution of cortical GABAergic interneurons (those expressing calbindin, calretinin, or parvalbumin), which mainly accumulated in the deep neocortical layers. Interestingly, the study of the oscillatory activity revealed an apparent inability of the cortical circuits to produce correct activity patterns. Moreover, the fast spiking (FS) inhibitory GABAergic interneurons exhibited several abnormalities regarding the size of the action potentials, the threshold for spike firing, the time course of the action potential after-hyperpolarization (AHP), the firing frequency, and the frequency and peak amplitude of spontaneous excitatory postsynaptic currents (sEPSC's). These morphological and functional alterations in the cortical inhibitory system characterize the Lis1/sLis1 mouse as a model of mild lissencephaly, showing a phenotype less drastic than the typical phenotype attributed to classical lissencephaly. Therefore, the results described in the present manuscript corroborate the idea that mutations in some regions of the Lis1 gene can produce phenotypes more similar to those typically described in schizophrenic and autistic patients and animal models.

Keywords: cortical inhibition; fast-spiking interneuron; mental disorders; motor cortex; oscillatory activity.


Conflict of interest statement

The authors declare that the research was conducted in the absence of any commercial or financial relationships that could be construed as a potential conflict of interest.

Figures

FIGURE 1
FIGURE 1
Cytoarchitectonics of the primary motor cortex of the wild type and mutant Lis1/sLis1 mice. (A–B) Representative cresyl-violet staining of the primary motor cortex from wild type (A,B) and mutant (A′, B′) mice. Cortical layers indicated with dotted lines. ACA: anterior cingulate cortex, CC: corpus callosum, cing: cingulum MO: motor cortex, SS: somatosensory cortex. Section are from two antero-posterior levels (A, A′ anterior; B, B′ posterior). Scale bar in A: 0.5 mm. (C) Total thickness of the primary motor cortex measured from the cresyl-violet staining from wild type (black; n = 3 animals) and Lis1/sLis1 (red; n = 3 animals) animals. (D) NeuN staining of the primary motor cortex of the wild type (D) and mutant (D′) mouse. (E–F) Staining of cortical layers using specific markers (Cux1, layer 2/3; FoxP2, layer 6). (G) relative thickness of the primary motor cortex layers from wild type (black; n = 3 animals) and Lis1/sLis1 (red; n = 3 animals). To calculate the total thickness of the cortex and the thickness of cortical layers we measured these values in three stained slices in each animal (wild type or Lis1/sLis1) and used the mean values from these three slices to make comparisons between genotypes.
FIGURE 2
FIGURE 2
Distribution of calbindin, calretinin and parvalbumin positive cells in P30 mouse primary motor cortex of wild type and mutant Lis1/sLis1 mice. (A–C’). Immunohistochemical staining for calbindin (CB), calretinin (CR) and parvalbumin (PV) in wild type (A–C) and mutant (A’–C’) cortex. Scale bar in A (100 μm) applies to (A–C’). (D–F) Normalized number (respect to the total cell number of each type) of CB, CR and PV positive cells in superficial and deep layers in wild type (black; n = 4) and mutant mice (red; n = 4). Superficial layers correspond to layer 2/3 while deep layers correspond to layers 5 and 6. The division of the cortical area between superficial and deep layers was based on the actual layering of the cortex and was done only as a way to count neurons. *p < 0.5, **p < 0.01, Student’s t-test.
FIGURE 3
FIGURE 3
Frequency bands in the electrical activity recorded in vivo in the primary motor cortex of wild type and mutant Lis1/sLis1 mice. (A). Averaged power spectra of the LFP recorded in the primary motor cortex from layer 2/3 (left panel), layer 5 (center panel), and layer 6 (right panel) in wild type (black; n = 8) and mutant (red; n = 11) animals. The area between 49.5 and 50.5 Hz has been removed to avoid the artifact that appears due to the 50 Hz notch filter. The frequency bands were: alpha: 8–13 Hz, beta: 13–30 Hz, gamma: 30–100 Hz. (B). Power values of each frequency band normalized for the power of the delta band in layer 2/3 (left panel), layer 5 (center panel), and layer 6 (right panel). Normalization of the values obtained from each animal was performed before calculating the group means. To calculate the average normalized power value, the whole frequency range of each band was used. Averaged values are given as mean ± s.e.m. *p < 0.5, Student’s t-test.
FIGURE 4
FIGURE 4
Spectral coherence between layers of the electrical activity in the primary motor cortex of wild type and mutant Lis1/sLis1 mice. (A) The figure shows the averaged coherence along the frequency spectrum between layer 2/3 and 5 (left panels), layer 2/3 and 6 (middle panels), and layer 5 and 6 (right panels) of the electrical activity recorded in wild type (black traces; n = 8) and mutant mice (red traces; n = 11). (B) Comparison of the coherence among genotypes in different frequency bands between layers 2/3 and 5 (left panels), layers 2/3 and 6 (middle panels), and layers 5 and 6 (right panels). The frequency spectrum was divided into the following bands; alpha (8–13 Hz), beta (13–20 Hz), low-gamma (30–60 Hz), and high gamma (60–100 Hz). All data are presented as a mean ± s.e.m. *p < 0.5, Student’s t-test.
FIGURE 5
FIGURE 5
Fast-spiking (FS) interneurons recorded in Lis1/sLis1-GAD67-GFP wild type and mutant mice primary motor cortex. (A) Position of the soma of all recorded FS interneurons within the cortical layers; Open circles, stars, and triangles represent layers 2/3, 5, and 6 individual positions of FS interneurons for wild type (black) and mutant (red) mice. The filled symbols indicate the average position of the soma of the recorded FS interneurons in each cortical layer of wild type (layer 2/3 433.6 ± 21.58 µm, n = 15; layer 5 803.06 ± 26.63 µm, n = 18; layer 61,267.9 ± 48.45 µm, n = 10) and mutant mice (layer 2/3 386.6 ± 21.27 µm, n = 14; layer 5 845 ± 27.54 µm, n = 12; layer 61,346.9 ± 46.32 µm, n = 12). The limits between layers were placed as follows: layer 1, pia surface to 300 μm; layer 2/3, 300–550 μm; layer 5, 550–950 μm; layer 6, deeper than 950 μm; these limits were based on the cortical layers depicted in the Allen Brain Atlas (www.brain-maps.org) and our data in Figure 1. (B) Examples of the responses to hyper- and depolarizing current pulses of FS interneurons. Top to bottom: a representative recording of layer 2-3, layer 5, and layer 6 FS interneurons. The first action potential of the train is shown, at a larger time scale, next to each response to the supra-threshold current pulses. Scale bars apply to all panels. The resting membrane potential of the FS interneurons shown were (left to right, top to bottom): −71.5 mV, −63 mV, −58 mV, −70 mV, −64 mV, −74 mV.
FIGURE 6
FIGURE 6
Properties of the sEPSCs recorded in Fast-Spiking (FS) interneurons in the GAD67-GFP-Lis1/sLis1 wild type and mutant mice. The figure shows the properties of the sEPSCs of wild type (black) and mutant (red) FS interneurons recorded from left to right in layer 2/3, layer 5, and layer 6, respectively. (A) Sample traces of the membrane current where sEPSCs were detected. (B) Averaged relative frequency distribution of the peak amplitude of the sEPSCs (2 pA bins). (C) sEPSCs frequency values from FS interneurons. Panels (B–C) averaged values are given as mean ± s.e.m. (wild type n = 12, mutant n = 7; layer 5: wild type n = 10, mutant n = 9; layer 6: wild type n = 12, mutant n = 10). *p < 0.5, Student’s t-test.
FIGURE 7
FIGURE 7
Firing frequency in response to depolarizing current pulses and properties of the action potential after-hyperpolarization (AHP) in Fast-Spiking (FS) interneurons in Lis1/sLis1-GAD67-GFP wild type and mutant mice. Panels (A–C) from left to right show layer 2/3, layer 5, and layer 6 FS interneurons values from wild type (black) and mutant (red) animals. (A) Relationship between the firing frequency and the strength of the depolarizing current pulses obtained in wild type (Layer 2/3 n = 10; Layer 5, n = 18; Layer 6, n = 14) and mutant FS interneurons (Layer 2/3, n = 12; Layer 5, n = 13; Layer 6, n = 12) using the same protocol as that shown in Figure 5B. The strength of the depolarizing current pulses is shown as current increments with respect to the rheobase. (B) Averaged time course of the AHP (wild type: Layer 2/3, n = 9; Layer 5, n = 8; Layer 6, n = 10. Mutants: Layer 2/3, n = 9; Layer 5, n = 9; Layer 6, n = 9). The traces are scaled between the threshold and the peak to compare the time course of the AHP. (C) Half-amplitude decay time of the action potential AHP of wild type and mutant FS interneurons.
FIGURE 8
FIGURE 8
Cytoarchitectonics of the primary motor cortex in a case of human lissencephaly. (A,B) Nissl-stained sections of the dysplastic frontal cortex (primary motor cortex; B) and a normal area of the same cortical region (A). The cortical layers are indicated on each panel. In the affected area (B), a sizeable cortical ectopia is evident below the cortex. The normal area shown in panel A had approximately 4 mm in thickness. (C) Examples of the normal cortex and the affected cortex from the same subject are shown at a larger scale. Scale bar: 0.4 mm. In panels (A–C), the cortical layers are indicated. (D) Cortical areas shown in panel C were divided into eight horizontal bands of the same thickness (dotted lines). The cells in each band were detected and counted with the Image-J software (NIH, USA). The number of cells detected in each horizontal band is shown in the plot. (E) Distribution of calbindin, calretinin, and parvalbumin-positive interneurons in the same patient’s regular and dysplasic cortical areas. Upper layer cortical interneurons (layers II and III) of the lissencephalic motor cortex showed an apparent reduction of interneurons (calbindin, calretinin, and parvalbumin-positive cells) compared to deep layers. (F) Count of calbindin, calretinin, and parvalbumin-positive interneurons (left, center, and right panels, respectively). The cell counting was made in superficial layers (I-IV), deep layers (V-VI), and the values are given are relative to the total number of positive cells in all layers. The values shown in each column are the average of three consecutive sections.

Similar articles

References

    1. Allegra M., Genovesi S., Maggia M., Cenni M. C., Zunino G., Sgadò P., et al. (2014). Altered GABAergic Markers, Increased Binocularity and Reduced Plasticity in the Visual Cortex of Engrailed-2 Knockout Mice. Front. Cel. Neurosci. 8. 10.3389/fncel.2014.00163 - DOI - PMC - PubMed
    1. Ascoli G. A., Ascoli G. A., Alonso-Nanclares L., Anderson S. A., Barrionuevo G., Benavides-Piccione R., et al. (2008). Petilla Terminology: Nomenclature of Features of GABAergic Interneurons of the Cerebral Cortex. Nat. Rev. Neurosci. 9, 557–568. 10.1038/nrn2402 - DOI - PMC - PubMed
    1. Barkovich A. J., Guerrini R., Kuzniecky R. I., Jackson G. D., Dobyns W. B. (2012). A Developmental and Genetic Classification for Malformations of Cortical Development: Update 2012. Brain 135, 1348–1369. 10.1093/brain/aws019 - DOI - PMC - PubMed
    1. Barkovich A. J., Kuzniecky R. I., Jackson G. D., Guerrini R., Dobyns W. B. (2005). A Developmental and Genetic Classification for Malformations of Cortical Development. Neurology 65, 1873–1887. 10.1212/01.wnl.0000183747.05269.2d - DOI - PubMed
    1. Bartos M., Vida I., Jonas P. (2007). Synaptic Mechanisms of Synchronized Gamma Oscillations in Inhibitory Interneuron Networks. Nat. Rev. Neurosci. 8, 45–56. 10.1038/nrn2044 - DOI - PubMed