Review
. 2021 Oct 19:12:214-245.
doi: 10.1016/j.bioactmat.2021.10.014. eCollection 2022 Jun.

Recent advances in engineering iron oxide nanoparticles for effective magnetic resonance imaging

Affiliations
Review

Recent advances in engineering iron oxide nanoparticles for effective magnetic resonance imaging

Zhenghuan Zhao et al. Bioact Mater. .

Abstract

Iron oxide nanoparticle (IONP) with unique magnetic property and high biocompatibility have been widely used as magnetic resonance imaging (MRI) contrast agent (CA) for long time. However, a review which comprehensively summarizes the recent development of IONP as traditional T 2 CA and its new application for different modality of MRI, such as T 1 imaging, simultaneous T 2/T 1 or MRI/other imaging modality, and as environment responsive CA is rare. This review starts with an investigation of direction on the development of high-performance MRI CA in both T 2 and T 1 modal based on quantum mechanical outer sphere and Solomon-Bloembergen-Morgan (SBM) theory. Recent rational attempts to increase the MRI contrast of IONP by adjusting the key parameters, including magnetization, size, effective radius, inhomogeneity of surrounding generated magnetic field, crystal phase, coordination number of water, electronic relaxation time, and surface modification are summarized. Besides the strategies to improve r 2 or r 1 values, strategies to increase the in vivo contrast efficiency of IONP have been reviewed from three different aspects, those are introducing second imaging modality to increase the imaging accuracy, endowing IONP with environment response capacity to elevate the signal difference between lesion and normal tissue, and optimizing the interface structure to improve the accumulation amount of IONP in lesion. This detailed review provides a deep understanding of recent researches on the development of high-performance IONP based MRI CAs. It is hoped to trigger deep thinking for design of next generation MRI CAs for early and accurate diagnosis.

Keywords: Dual-modal contrast imaging; Environment responsive imaging; Improved relaxation; Iron oxide nanoparticles; Strcture engineering.


Conflict of interest statement

The authors declare that they have no known competing financial interests or personal relationships that could have appeared to influence the work reported in this paper.

Figures

Image 1
Graphical abstract
Fig. 1
Fig. 1
Schematic diagram of key parameters for the design of high-performance IONP based MRI CA. T2 and T1 relaxivity of IONP directly determine the contrast ability of IONP. Theoretically, contrast ability of IONP could be altered by magnetization, size, effective radii, inhomogeneity of surrounding generated magnetic field, crystal phase, coordination number of water, electronic relaxation time, and surface modification. Additionally, improving in vivo contrast efficiency of IONP through introducing second imaging modal, endowing IONP with environment response capacity, and optimizing the in vivo behavior is another strategy to construct high-performance IONP based MRI CA.
Fig. 2
Fig. 2
Magnetic behavior effect on T2 relaxivity of IONP. (a) Mass magnetization values and schematics of spin alignments and (b) T2 relaxivities of MnFe2O4 (MnMEIO), Fe3O4 (MEIO), CoFe2O4 (CoMEIO) and NiFe2O4 (NiMEIO). Reproduced with permission [27]. Copyright 2007, Nature Publishing Group. (c) Magnetic spin alignment diagram of (ZnxFe1-x)Fe2O4 nanoparticles with x = 0, 0.2, and 0.4 under applied magnetic field. (d) Ms and (e) r2 values of (ZnxMn1-x)Fe2O4 and (ZnxFe1-x)Fe2O4 nanoparticles with different Zn doping level. Reproduced with permission [135]. Copyright 2009, John Wiley & Sons, Inc. (f) TEM image and (g) r2 value of iron/iron oxide core/shell nanoparticle. Reproduced with permission [139]. Copyright 2011, John Wiley & Sons, Inc. (h) r2 values of iron nanoparticle coated by various magnetic shell at the fixed larmor frequency. Reproduced with permission [141]. Copyright 2011, John Wiley & Sons, Inc. (i) Diagram of spin canting effect in various sized IONPs. (j) M − H curve of IONPs with sizes of 1.5, 2.2, and 3 nm at 300 K. Reproduced with permission [46]. Copyright 2011, American Chemical Society. (k–l) TEM images of cube and sphere nanoparticles. (m–n) Simulated magnetic spin state of cube and sphere, indicating the degree of spin canting against external magnetic field. Reproduced with permission [149]. Copyright 2012, American Chemical Society.
Fig. 3
Fig. 3
Effective radius effect of single IONP on its T2 relaxivity. (a) TEM and HRTEM images of octapod IONP with four-armed star-like particles. (b) Schematic cartoon shows the ball models of octapod and spherical IONP with the same geometric volume. With the same geometric core volume, octapod IONP shows larger effective volume than spherical IONP. (c) M − H curves of Octapod-30, Octapod-20, Spherical-16, and Spherical-10 measured at 300 K. (d) T2-weighted MRI images and (e) r2 values of Octapod-30, Octapod-20, Spherical-16, and Spherical-10, respectively. Reproduced with permission [154]. Copyright 2013, Nature Publishing Group. (f) r2 values of IONPs with different morphologies, including sphere, cubes, plates, tetrahedrons, rhombohedra, and octapod. Reproduced with permission [160]. Copyright 2018, American Chemical Society. (g) Color-coded T2-weighted MRI images and (h) comparison of r2 values of ferrimagnetic cubic IONPs. Reproduced with permission [158]. Copyright 2012, American Chemical Society. (For interpretation of the references to color in this figure legend, the reader is referred to the Web version of this article.)
Fig. 4
Fig. 4
Assembled effect on T2 relaxivity of IONP. (a) TEM images of IONP-loaded micelles after negative staining. (b) T2 relaxivity and (c) T2-weighted MRI images of 4 nm IONP-loaded PCL5k-b-PEG5k micelles and DSPE-PEG5k micelles at 1.5 T. (d) Table of T1 relaxivities, T2 relaxivites, and MRI sensitivity of different IONP-loaded micelles. Reproduced with permission [164]. Copyright 2005, John Wiley & Sons, Inc. (e) TEM images of IONP-MSN. (f) Plot of T2 relaxation and (g) T2-weighted MRI images of IONP-MSN and free IONP with the same Fe concentration. Reproduced with permission [165]. Copyright 2009, American Chemical Society.
Fig. 5
Fig. 5
Simultaneous optimization of magnetic behavior and effective radii to improving T2 relaxivity. (a) Scheme of cation exchange in IONP. (b) TEM images of octapod IONP treated by Mn and Zn cations. (c) Comparison of Ms and (d) r2 values and T2-weighted MR images of octapod IONP treated by Mn and Zn cations. (e) In vivo MRI images of metastatic hepatic carcinomas before and 1 h after intravenous injection of octapod IONP treated by Zn cations. Reproduced with permission [169]. Copyright 2016, American Chemical Society. (f) Comparison of Ms and (g) r2 values of Zn doped IONP with different ratio. (h) T2-weighted MR images of Zn doped IONP with different ratio at 7 T. Reproduced with permission [170]. Copyright 2019, American Chemical Society.
Fig. 6
Fig. 6
Inhomogeneous magnetic field effect on T2 relaxivity of IONP. (a) Scheme of water molecular diffusion and relaxation process around spherical IONP. The color indicates the intensity of local field induced by IONP under an external magnetic field. (b) The spatial distribution of stray fields caused by IONP with different morphologies. (c) Values of magnetic susceptibility and (d) stray field gradient vs distance from the surface of IONP with different morphologies. (e) r2 values and (f) T2-weighted MR images of IONP with different morphologies at 7 T. Reproduced with permission [160]. Copyright 2018, American Chemical Society. (g) Schematic cartoon illustrates the simulation of two adjacent IONP of different size. (h–l) Landau-Lifshitz-Gilbert simulation results of the stray field for model C1–C5, respectively. (m–o) Simulation models and the calculated stray fields for the models C6 and C7, respectively. (p) Comparison of r2 values and (q) T2-weighted MR images of IO-5, IO-15, C1, C2, and C3, respectively. (r) Comparison of r2 values and (s) T2-weighted MR images of cubic IONP, C6, and C7, respectively. Reproduced with permission [173]. Copyright 2017, Nature Publishing Group. (For interpretation of the references to color in this figure legend, the reader is referred to the Web version of this article.)
Fig. 7
Fig. 7
Effect of surface coating structure on T2 relaxivity of IONP. (a) Chemical structure of PEG used for exchanging and TEM images of PEGylated IONP with the sizes of 3.6 and 10.9 nm, respectively. (b) Ms values and (c) plot of T2 relaxation rates of PEGylated IONPs with the sizes of 3.6 and 10.9 nm. Reproduced with permission [174]. Copyright 2014, John Wiley & Sons, Inc. (d) TEM images and (e) r2 values of silica coated IONPs with different silica shell thickness. Reproduced with permission [180]. Copyright 2013, Springer Nature. Normalized magnetic field of IONP with the sizes of (f) 5 and (g) 14 nm. The color bar represent the magnitude of the magnetic field strength. Starting from center, the dash lines indicate PEG550, PEG750, PEG1000, PEG2000, and PEG5000. T2 relaxivities of different PEG coated IONPs with constant (h) iron concentration or (i) particle concentrations. Reproduced with permission [181]. Copyright 2010, American Chemical Society. (j) TEM images of casein coated IONP. (k) Pictures of gel analyses of casein and oligosaccharide or casein coated IONP. (l) T2-weighted MR images and (m) T2 relaxation rates of casein and polymer coated IONP. Reproduced with permission [182]. Copyright 2013, American Chemical Society. (For interpretation of the references to color in this figure legend, the reader is referred to the Web version of this article.)
Fig. 8
Fig. 8
Effect of spin disordered surface and crystal phase on T1 relaxivity of IONP. TEM images of IONP with the sizes of (a) 1.5, (b) 2.2, (c) 3, and (d) 3.7 nm, respectively. (e) Plot of T1 relaxation rate of IONP with different sizes. Reproduced with permission [46]. Copyright 2010, American Chemical Society. (f) r1 value and r2/r1 ratio of exceedingly small IONP as a function of sizes. (g) Relative intensity of MR images for exceedingly small IONP with the sizes of 3.3, 3.6, and 4.2 nm, respectively. Reproduced with permission [193]. Copyright 2017, American Chemical Society.
Fig. 9
Fig. 9
Effect of surface-to-volume ration on T1 relaxivity of IONP. TEM images of hollow porous IONP with the sizes of (a) 21, (b) 14, and (c) 9 nm, respectively. (d) Relaxation measurements and (e) T1-weighted phantom images of hollow porous IONPs with different sizes at 0.5 T. Reproduced with permission [210]. Copyright 2018, American Chemical Society. (f) TEM images of ultrathin IO nanowhisker. (g) T1 relaxation curve and (h) T1-weighted images of water and IO nanowhisker. Reproduced with permission [201]. Copyright 2015, John Wiley & Sons, Inc.
Fig. 10
Fig. 10
Effect of anisotropic morphology on T1 relaxivity of IONP. TEM images of IO nanoplate with the thickness of (a) 8.8, (b) 4.8, and (c) 2.8 nm, respectively. (d) HRTEM image of IO nanoplate, indicating the (220) planes. (e) Perspective and (f) top views of Feoct2-ter1-terminated (111) planes of Fe3O4 structure, showing the iron iron-rich characteristics. (g) Relationships of T1 relaxivity with the (111) surface of IO nanoplate compare to spherical IONP with equivalent whole surface areas. (h) T1 NMRD profiles of IO nanoplate with different thickness as the function of applied magnetic field. Reproduced with permission [155]. Copyright 2014, American Chemical Society. (i) The exposed faces of (100), (110), (111), and (311) of Mn doped IONP. (j) The relationship of surface-to-volume ratio and T1 relaxivity. (k) The relationship of r1 value and the number of effective magnetic metal ions on exposed facets. Reproduced with permission [160]. Copyright 2018, American Chemical Society.
Fig. 11
Fig. 11
Effect of τs on T1 relaxivity of IONP. (a) Schematic illustration of water chemical exchange and proton relaxation enhancement phenomena in magnetic systems with surface magnetic ions in IONP and MnIONP. TEM and EDX mapping images of MnIONP with the morphologies of (b) cubes, (c) octapods, and (d) plates, respectively. r1 values, r2/r1 analyses, and T1-weighted images of MnIONP with morphologies of (e) cubes, (f) octapods, and (g) plates, respectively. Reproduced with permission [51]. Copyright 2018, The Royal Society of Chemistry. (h) TEM and HRTEM images of Gd engineered IO nanoplate. (i) EDX line-scanning and (j) mapping of Gd engineered IO nanoplate. (k) T1-and T2-weighted phantom images of Gd engineered IO nanoplate at 3.0 and 9.4 T. (l) Comparison of r1 values of Gd engineered IO nanoplate, IO cubes, and Gd engineered IONP. Reproduced with permission [221]. Copyright 2015, American Chemical Society. Selected STEM-HAADF images of CuIONP with the Cu dopant ratio of (m) 1.7%, (n) 4%, and (o) 28%, respectively. (p) r1 values and (q) r2/r1 ratio analyses of CuIONP with different dopant ratio. Reproduced with permission [222]. Copyright 2019, American Chemical Society.
Fig. 12
Fig. 12
Effect of chemical exchange efficiency on T1 relaxivity of IONP. (a) r1 values of IONP coated by DSPE-PEG with different molecular weights. Reproduced with permission [41]. Copyright 2007, John Wiley & Sons, Inc. TEM images and schematic cartoon of EuIONP with surface ligand of (b) citrate (Cit), (c) alendronate (Ale), and (d) PMAO-PEG (PP). (e) r1 relaxivities of EuIONPs coated with different surface ligands as a function of contact angle. (f) T1-weighted images of EuIONPs coated with Cit, Ale, and PP with different magnetic ions concentration. Reproduced with permission [228]. Copyright 2018, American Chemical Society. (g) TEM images of IONP coated by GO. (h) Linear fitting of 1/T2 and (i) 1/T1 of the reference IONP, IOPNs coated by GO, and IONP coated by NH2-cis-aconitic acid-DOX and GO. Reproduced with permission [232]. Copyright 2019, The Royal Society of Chemistry.
Fig. 13
Fig. 13
Effect of direct coating IONP with T1 contrast moiety on its T2/T1 dual-modality contrast capacity. TEM images of (a) Fe3O4, (b) Fe3O4@MnO, (c) Fe3O4/MnO dumbbell nanoparticles, respectively. (d) Comparison of r1 values, r2 values, and r2/r1 ratios of different nanoparticles. Reproduced with permission [242]. Copyright 2013, Elsevier Ltd. (e) TEM and EDX mapping images of Gd2O3 coated IONP. (f) r1 and (g) r2 value of Gd2O3 coated IONP. (h) T1-and T2-weighted MR images obtained from Gd2O3 coated IONP at varied concentrations. Reproduced with permission [243]. Copyright 2017, American Chemical Society. (i) Schematic cartoon illustrates the distance dependent magnetic resonance tuning. (j) A schematic representation of the nanoscale ruler based on the MRET effect. (k) T1-weighted and color mapped MR images of solution containing enhancer and quencher with varied distances. (l) A plot of r1 values versus separation distance. (m) The r1 values of the enhancer with a separation distance of 2, 7, and 12 nm at various larmor frequencies. (n) A plot of T1e versus the separation distance at 15 K. Reproduced with permission [58]. Copyright 2017, Nature Publishing Group. (For interpretation of the references to color in this figure legend, the reader is referred to the Web version of this article.)
Fig. 14
Fig. 14
IONP based core-shell T1/T2 dual-modal CA. (a) Schematic and TEM image of core-shell type dual-modal CA. (b) TEM images of dual-modal CAs with different separating layer thickness. (c) r1 and r2 values of dual-modal CAs, MnFe2O4, Gd-DTPA, and Feridex. Reproduced with permission [245]. Copyright 2010, American Chemical Society. (d) Schematic illustrate the magnetic coupling of T1 and T2 CAs in core-shell and dumbbell structures. (e) Illustration of constructions of four different types of dumbbell-like or dumbbell heterostructures. (f) T1-and T2-weighted MRI images of dumbbell hybrid heterostructures. Reproduced with permission [236]. Copyright 2014, American Chemical Society.
Fig. 15
Fig. 15
IONP based T1/T2 dual-modal CA. (a) TEM and (b) EDX mapping images of GdIONP. T1-and T2-weighted MR images of (c) GdIONP, (d) IONP, and (e) Gd2O3 nanoparticles, respectively. The analyses of (f) T2 and (g) T1 relaxation rate of GdIONP, IONP, and Gd2O3 nanoparticles. Reproduced with permission [246]. Copyright 2012, John Wiley & Sons, Inc.
Fig. 16
Fig. 16
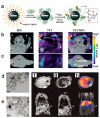
IONP based MRI-FL and MRI-PA dual-modal CA. (a) Schematic diagram for the synthesis of DySiO2-(Fe3O4)n nanoparticles. TEM images of (b) DySiO2, (c) IONP, and (d) DySiO2-(Fe3O4)n nanoparticles. (e) Analyses of T2 relaxation rates and T2-weighted MRI images of DySiO2-(Fe3O4)n nanoparticles and free IONP. (f) Photoluminescence spectra of DySiO2-(Fe3O4)n nanoparticles and dye linked IONP. Reproduced with permission [73]. Copyright 2006, John Wiley & Sons, Inc. (g) TEM and EDX mapping images of CP-IO nanocomposites. (h) T2-weighted MR images and (i) T2 relaxation rate analyses of CP-IO nanocomposites. (j) Plots of the simulated temperature distribution in CP-IO, CP, and MIX nanoparticles at 100 ns. (k) Plots of the simulated PA signal transmission from surface of nanoparticles to surrounding water environment. Reproduced with permission [79]. Copyright 2018, John Wiley & Sons, Inc.
Fig. 17
Fig. 17
IONP based MRI-PET/SPECT dual-modal CAs. (a) Illustration of preparation of 124I linked MnIONP. PET/MRI images of SLNs in a rat at 1 h post injection of 124I linked MnIONP into the right forepaw in (b) coronal and (c) transverse view. Reproduced with permission [259]. Copyright 2008, John Wiley & Sons, Inc. TEM images of (d) IONP and (e) 99mTc radiolabeled IONP. T2-weighted MRI images (f) before and (g) 15 min postinjection of 99mTc radiolabeled IONP. (h) SPECT-CT image of the same mice in a similar view 45 min postinjection. Reproduced with permission [66]. Copyright 2011, American Chemical Society.
Fig. 18
Fig. 18
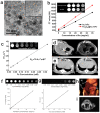
IONP based MRI-CT dual-modal CAs. (a) TEM images of Fe3O4–Au hybrid nanoparticles. (b) X-ray attenuation assay and (c) T2 ralaxation rate analysis of Fe3O4–Au hybrid nanoparticles. (d) T2-weighted MRI and (e) CT images of rat pre and post injection in transversal view. Reproduced with permission [264]. Copyright 2015, Elsevier Ltd. (f) CT phantom images and HU values of Fe3O4/TaOx nanoparticles. (g) T2-weighted MRI images and r2 values of Fe3O4/TaOx nanoparticles. In vivo (h) CT image and (i) T2-weighted image of rat 24 h after injection of Fe3O4/TaOx nanoparticles. Reproduced with permission [265]. Copyright 2012, American Chemical Society.
Fig. 19
Fig. 19
IONP based intelligent CA with responsive signal active capacity. (a) Schematic cartoon illustrate the sensor design based on lipid coated IONP and C2AB. (b) AFM images of IONP based calcium-responsive nanostructure after exposure to 0 or 1 mM Ca2+. (c) r2 values and (d) T2-weighted MRI images of IONP based calcium-responsive nanostructure after exposure to different Ca2+ concentrations. (e) r2 changes observed in HEPES buffer over multiple cycles of calcium or EDTA addition. Reproduced with permission [272]. Copyright 2018, Nature Publishing Group. (f) Schematic drawings to show molecular mechanism of GSH-induced agglomeration of intelligent probe. (g) Temporal evolution of ΔR1 and ΔR2 for intelligent probe and peptide modified IONP during the incubation with GSH. (h) GSH concentration dependent ΔR1 and ΔR2 for intelligent probe and peptide modified IONP. Reproduced with permission [274]. Copyright 2021, John Wiley & Sons, Inc.
Fig. 20
Fig. 20
IONP based intelligent CA with responsive signal recovery capacity. (a) Schematic illustration of MMP-2 detection using IONP based on T1 relaxivity recovery. (b) T1-weighted MRI images of IONP based T1 recovery system incubated with MMP-2. Reproduced with permission [276]. Copyright 2017, American Chemical Society. (c) Schematic illustration of the redox-responsive activatable nanoshell. (d) T1-and (e) T2-weighted MRI images of responsive system after treatment of GSH and non-treatment. Relaxivity plot of (f) T1 and (g) T2 relaxation rate analyses. Reproduced with permission [277]. Copyright 2016, Elsevier Ltd.
Fig. 21
Fig. 21
IONP based modality switchable CA. (a) Schematic illustration of intelligent system based modality switchable diagnosis of HCC. TEM images of (b) small IONP, (c) intelligent system in PBS (pH 7.4), and (d) intelligent system in MES (pH 5.5). (e) Kinetic analysis of intelligent system disassembly upon the pH change from 7.4 to 6.5/5.5. (f) T1-weighted images and (g) relaxivity of intelligent system in PBS (pH 7.4) and MES (pH 6.5 and 5.5). Reproduced with permission [278]. Copyright 2018, American Chemical Society. (h) Schematic illustration of the synthesis of IONP based intelligent system for enhanced retention and tunable T1/T2-weighted MR imaging of inflammatory arthritis. (i) T1 relaxation rates, (j) T2 relaxation rate, and (k) T1-weighted, (l) T2-weighted MR image of IONP based intelligent system under 405 nm laser irradiation (1.0 W cm−2) for different time. Reproduced with permission [279]. Copyright 2019, John Wiley & Sons, Inc.
Fig. 22
Fig. 22
Effect of surface ligand on in vivo contrast efficiency of IONP. Prussian blue staining of J774 macrophages after incubation with IONP coated by PEG with the molecular weight of (a) 350, (b) PEG 1100, (c) PEG 2000, and (d) Resovist. Reproduced with permission [199]. Copyright 2009, American Chemical Society. Prussian blue staining of HUVECs incubated with (e) PEGylated IONP, (f) RGD modified IONP, (g) RGD modified IONP plus free c(RGDyK), and (h) control group for 12 h at Fe concentration of 100 μg/mL. Scale bar: 20 μm for all images. (i) In vivo biodistribution of Fe in major organs. (j) T1-weighted MRI images of mice bearing tumor before and after administration of RGD modified IONP. Reproduced with permission [298]. Copyright 2016, Ivyspring International Publisher. (k) TEM image and schematic cartoon of surface structure of IO@ZDS. (l) Chromatograms of IONP in serum binding test. (m) UV–Vis spectrum of IO@ZDS with the increase of storage time. Reproduced with permission [300]. Copyright 2012, American Chemical Society. (For interpretation of the references to color in this figure legend, the reader is referred to the Web version of this article.)

Similar articles

Cited by

References

    1. Tassa C., Shaw S.Y., Weissleder R. Dextran-coated iron oxide nanoparticles: a versatile platform for targeted molecular imaging, molecular diagnostics, and therapy. Accounts Chem. Res. 2011;44:842–852. - PMC - PubMed
    1. Janowski M., Bulte J.W.M., Walczak P. Personalized nanomedicine advancements for stem cell tracking. Adv. Drug Deliv. Rev. 2012;64:1488–1507. - PMC - PubMed
    1. Lane L.A., Qian X., Nie S. SERS nanoparticles in medicine: from label-free detection to spectroscopic tagging. Chem. Rev. 2015;115:10489–10529. - PubMed
    1. Taylor A., Wilson K.M., Murray P., Fernig D.G., Lévy R. Long-term tracking of cells using inorganic nanoparticles as contrast agents: are we there yet? Chem. Soc. Rev. 2012;41:2707–2717. - PubMed
    1. Barrow M., Taylor A., Murray P., Rosseinsky M.J., Adams D.J. Design considerations for the synthesis of polymer coated iron oxide nanoparticles for stem cell labelling and tracking using MRI. Chem. Soc. Rev. 2015;44:6733–6748. - PubMed

LinkOut - more resources