Promoter Hypomethylation of TGFBR3 as a Risk Factor of Alzheimer's Disease: An Integrated Epigenomic-Transcriptomic Analysis
- PMID: 35310542
- PMCID: PMC8924075
- DOI: 10.3389/fcell.2021.825729
Promoter Hypomethylation of TGFBR3 as a Risk Factor of Alzheimer's Disease: An Integrated Epigenomic-Transcriptomic Analysis
Abstract
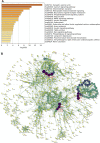
Alzheimer's disease (AD) is characterized by the abnormal deposition of amyloid-β (Aβ) plaques and tau tangles in the brain and accompanied with cognitive impairment. However, the fundamental cause of this disease remains elusive. To elucidate the molecular processes related to AD, we carried out an integrated analysis utilizing gene expression microarrays (GSE36980 and GSE5281) and DNA methylation microarray (GSE66351) in temporal cortex of AD patients from the Gene Expression Omnibus (GEO) database. We totally discovered 409 aberrantly methylated and differentially expressed genes. These dysregulated genes were significantly enriched in biological processes including cell part morphogenesis, chemical synaptic transmission and regulation of Aβ formation. Through convergent functional genomic (CFG) analysis, expression cross-validation and clinicopathological correlation analysis, higher TGFBR3 level was observed in AD and positively correlated with Aβ accumulation. Meanwhile, the promoter methylation level of TGFBR3 was reduced in AD and negatively associated with Aβ level and advanced Braak stage. Mechanically, TGFBR3 might promote Aβ production by enhancing β- and γ-secretase activities. Further investigation revealed that TGFBR3 may exert its functions via Synaptic vesicle cycle, Calcium signaling pathway and MAPK signal pathway by regulating hub genes GNB1, GNG3, CDC5L, DYNC1H1 and FBXW7. Overall, our findings highlighted TGFBR3 as an AD risk gene and might be used as a diagnostic biomarker and therapeutic target for AD treatment.
Keywords: Alzheimer’s disease; Aβ plaque; TGFBR3; methylation; secretase activity.
Copyright © 2022 Song, Yang and Yu.
Conflict of interest statement
The authors declare that the research was conducted in the absence of any commercial or financial relationships that could be construed as a potential conflict of interest.
Figures


Similar articles
-
Alzheimer's disease.Subcell Biochem. 2012;65:329-52. doi: 10.1007/978-94-007-5416-4_14. Subcell Biochem. 2012. PMID: 23225010 Review.
-
Therapeutic potentials of plant iridoids in Alzheimer's and Parkinson's diseases: A review.Eur J Med Chem. 2019 May 1;169:185-199. doi: 10.1016/j.ejmech.2019.03.009. Epub 2019 Mar 8. Eur J Med Chem. 2019. PMID: 30877973 Review.
-
Synaptic Mitochondria: An Early Target of Amyloid-β and Tau in Alzheimer's Disease.J Alzheimers Dis. 2021;84(4):1391-1414. doi: 10.3233/JAD-215139. J Alzheimers Dis. 2021. PMID: 34719499 Review.
-
Related Network and Differential Expression Analyses Identify Nuclear Genes and Pathways in the Hippocampus of Alzheimer Disease.Med Sci Monit. 2020 Jan 28;26:e919311. doi: 10.12659/MSM.919311. Med Sci Monit. 2020. PMID: 31989994 Free PMC article.
-
Human Alzheimer's disease gene expression signatures and immune profile in APP mouse models: a discrete transcriptomic view of Aβ plaque pathology.J Neuroinflammation. 2018 Sep 6;15(1):256. doi: 10.1186/s12974-018-1265-7. J Neuroinflammation. 2018. PMID: 30189875 Free PMC article.
Cited by
-
Overexpression of TGFBR3 Aggravates Cognitive Impairment and Neuroinflammation by Promoting Microglia M1 Polarization in the APP/PS1 Mouse Model of Alzheimer's Disease.Mol Neurobiol. 2025 Jun;62(6):7706-7722. doi: 10.1007/s12035-025-04731-w. Epub 2025 Feb 10. Mol Neurobiol. 2025. PMID: 39930283
-
Ubiquitin-Proteasome System in the Different Stages of Dominantly Inherited Alzheimer's Disease.Res Sq [Preprint]. 2024 Jul 23:rs.3.rs-4202125. doi: 10.21203/rs.3.rs-4202125/v1. Res Sq. 2024. Update in: Alzheimers Dement. 2025 May;21(5):e70243. doi: 10.1002/alz.70243. PMID: 39108475 Free PMC article. Updated. Preprint.
-
The Distant Molecular Effects on the Brain by Cancer Treatment.Brain Sci. 2023 Dec 24;14(1):22. doi: 10.3390/brainsci14010022. Brain Sci. 2023. PMID: 38248237 Free PMC article.
-
DNA Methylation in Alzheimer's Disease.Curr Top Behav Neurosci. 2025;69:149-178. doi: 10.1007/7854_2024_530. Curr Top Behav Neurosci. 2025. PMID: 39455499 Review.
-
Comparative Analysis of Human Brain RNA-seq Reveals the Combined Effects of Ferroptosis and Autophagy on Alzheimer's Disease in Multiple Brain Regions.Mol Neurobiol. 2025 May;62(5):6128-6149. doi: 10.1007/s12035-024-04642-2. Epub 2024 Dec 23. Mol Neurobiol. 2025. PMID: 39710824
References
LinkOut - more resources
Full Text Sources

