. 2022 Mar 3:16:839521.
doi: 10.3389/fncir.2022.839521. eCollection 2022.

Toward Assessing the Functional Connectivity of Spinal Neurons

Affiliations

Toward Assessing the Functional Connectivity of Spinal Neurons

Martin Zaback et al. Front Neural Circuits. .

Abstract

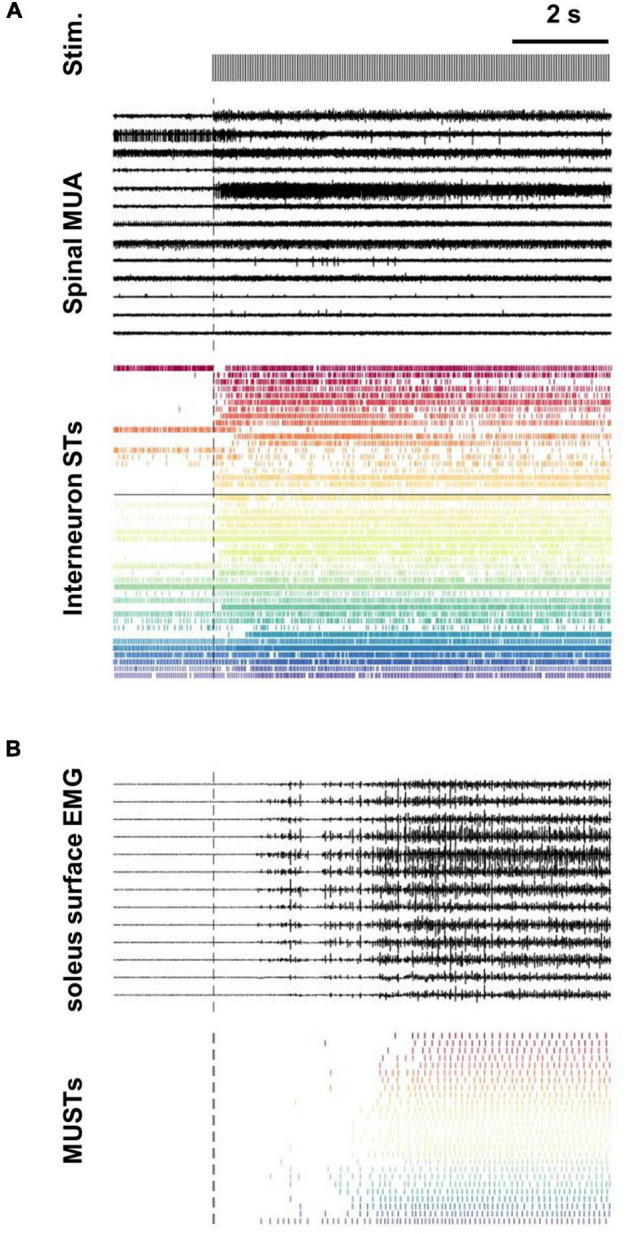
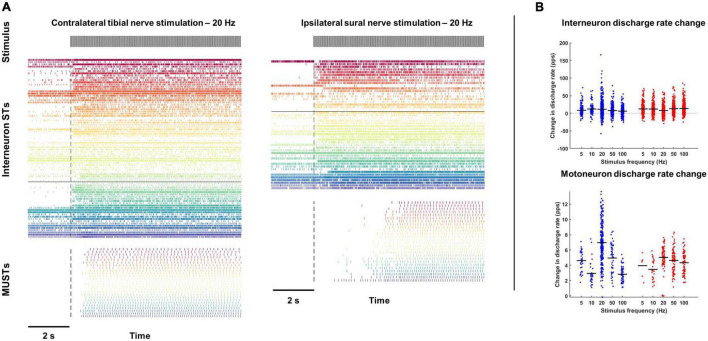
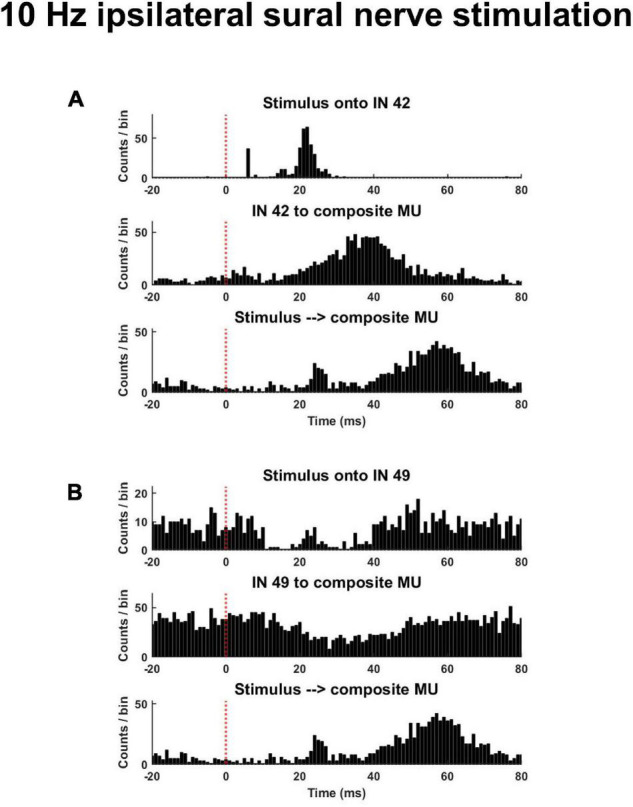
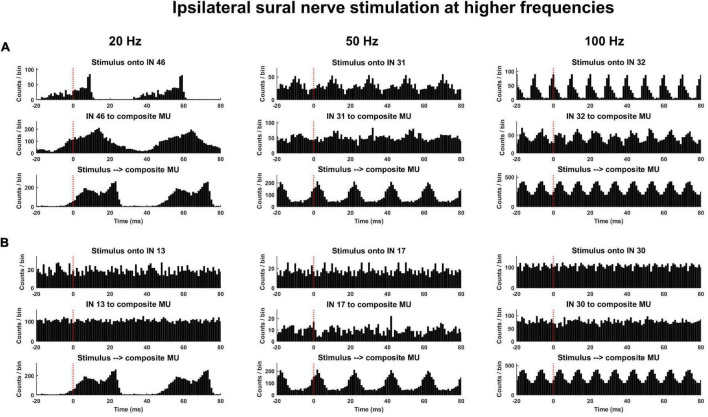
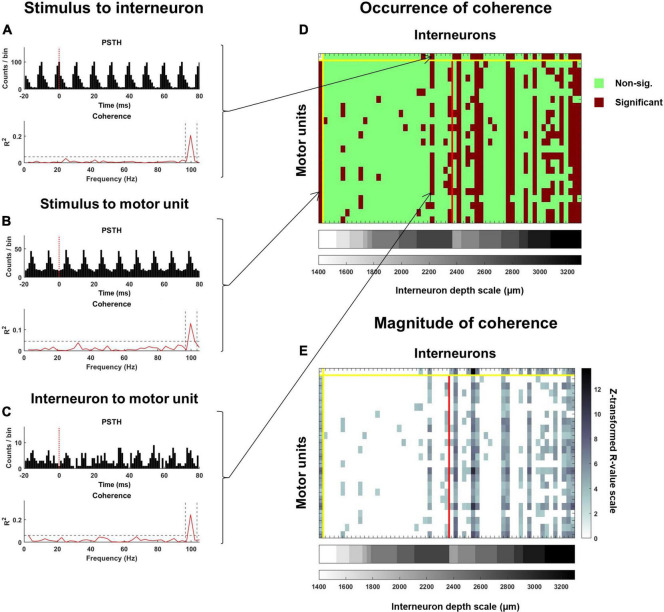
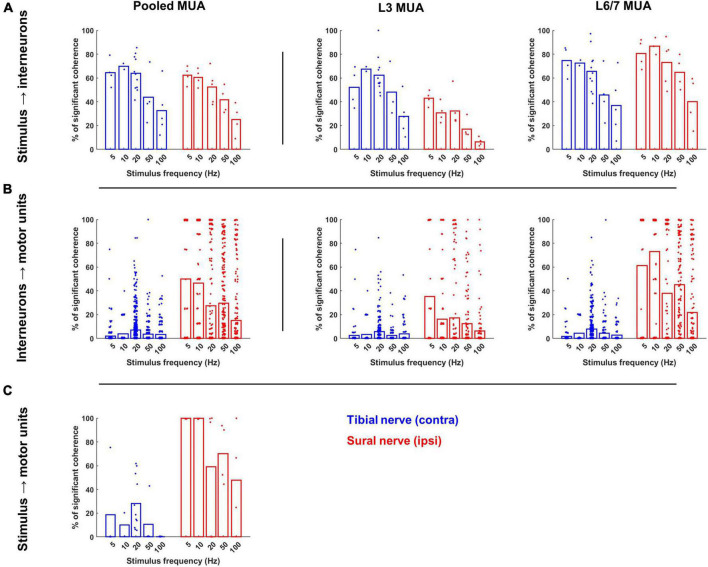
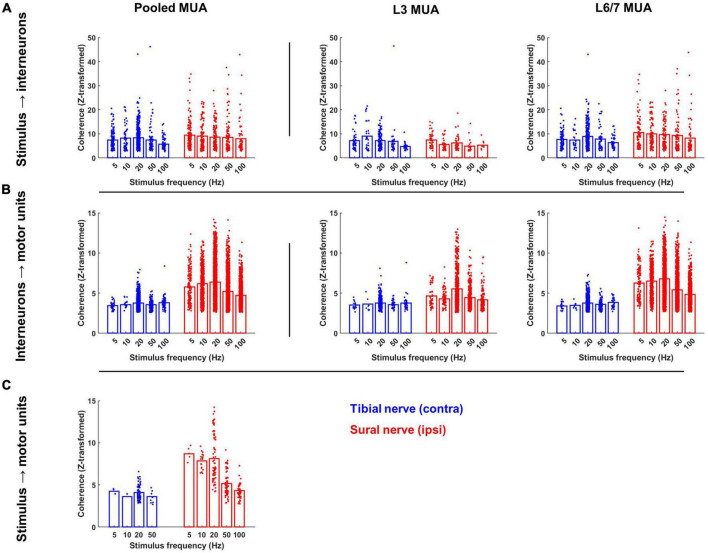
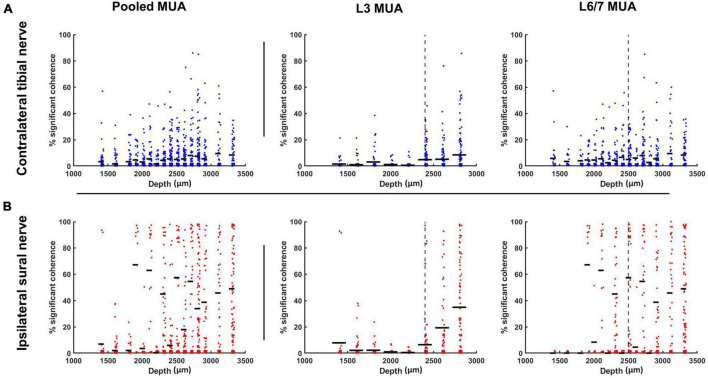
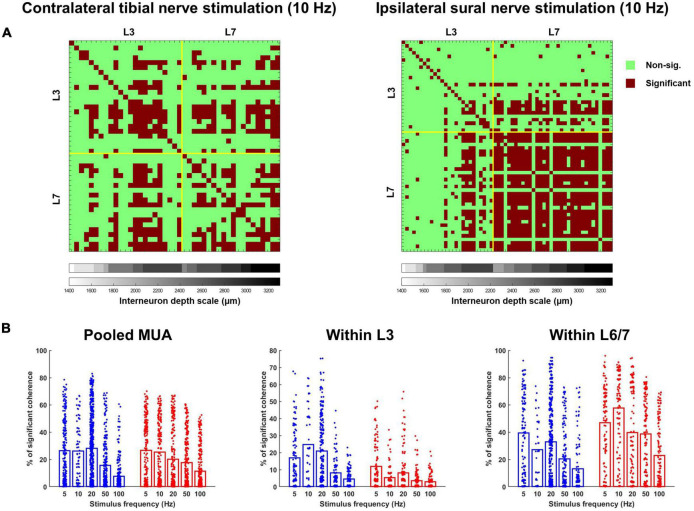
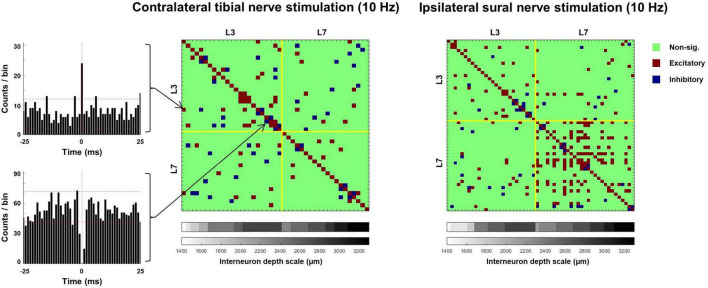
Spinal interneurons play a critical role in motor output. A given interneuron may receive convergent input from several different sensory modalities and descending centers and relay this information to just as many targets. Therefore, there is a critical need to quantify populations of spinal interneurons simultaneously. Here, we quantify the functional connectivity of spinal neurons through the concurrent recording of populations of lumbar interneurons and hindlimb motor units in the in vivo cat model during activation of either the ipsilateral sural nerve or contralateral tibial nerve. Two microelectrode arrays were placed into lamina VII, one at L3 and a second at L6/7, while an electrode array was placed on the surface of the exposed muscle. Stimulation of tibial and sural nerves elicited similar changes in the discharge rate of both interneurons and motor units. However, these same neurons showed highly significant differences in prevalence and magnitude of correlated activity underlying these two forms of afferent drive. Activation of the ipsilateral sural nerve resulted in highly correlated activity, particularly at the caudal array. In contrast, the contralateral tibial nerve resulted in less, but more widespread correlated activity at both arrays. These data suggest that the ipsilateral sural nerve has dense projections onto caudal lumbar spinal neurons, while contralateral tibial nerve has a sparse pattern of projections.

Keywords: high density arrays; interneuron; motoneuron; single units; spinal cord circuitry.


Conflict of interest statement

The authors declare that the research was conducted in the absence of any commercial or financial relationships that could be construed as a potential conflict of interest. The handling editor declared a past collaboration with one of the author ML.

Figures

FIGURE 1
FIGURE 1
Decomposition of spinal multi-unit and soleus surface electrode array recordings into interneuron and motor unit spike trains. (A) Subset of extracellular recordings (13/128 channels) from L3 and L6 spinal intermediate zones are shown along with the population of all interneurons spike trains (STs) decomposed from the array data (n = 46). The black horizontal line transecting the interneuron STs separates units decomposed from the L3 (n = 27) and L6 (n = 19) arrays. (B) Subset of surface EMG recordings (13/64 channels) along with the population of motor unit spike trains (MUSTs) decomposed from these array data (n = 26).
FIGURE 2
FIGURE 2
Changes in interneuron and motoneuron spike times during tibial and sural nerve stimulation. (A) Population spike times of interneuron and motoneuron single units during exemplar trials of tibial (left) and sural (right) nerve stimulation at 20 Hz. (B) With both tibial and sural nerve stimulation, interneurons and motor units changed their discharge rate to a similar degree regardless of stimulation frequency. Motor units were almost exclusively quiescent during the pre-stimulation period and increased their discharge shortly after the onset of stimulation. Most interneurons had some baseline activity and displayed a more heterogeneous response to peripheral nerve stimulation.
FIGURE 3
FIGURE 3
Exemplar peristimulus time histograms during a trial of low frequency (10 Hz) ipsilateral sural nerve stimulation. (A) Shown is an interneuron that displayed an increased probability of discharge in response to the stimulus and whose discharge was associated with an increased probability of motor unit discharge [(A), middle panel]. (B) Displayed is an interneuron that displayed a reduced probably of discharge and whose discharge was associated with a decreased probably of motor unit discharge [(B), middle panel]. The same composite motor unit spike train in response to the stimulus is shown on the bottom panel of panels (A,B).
FIGURE 4
FIGURE 4
Exemplar peristimulus time histograms during trials of higher frequency (≥20 Hz) ipsilateral sural nerve stimulation. (A) Clear responses entrained to the stimulus frequency can be observed; however, due to the long latency of the response and short inter-stimulus interval, the type (excitatory or inhibitory) and onset of response cannot be reliably determined from analysis of the PSTH. (B) Illustrates interneurons from the same trial that were not entrained to the stimulus frequency along with composite motor unit spike trains (CST) in response to the stimulus [bottom plots of panels (A,B) are repeated].
FIGURE 5
FIGURE 5
Coherence analysis used to examine the response of interneurons and motoneurons to the stimulus pulse train as well as the functional connectivity between interneurons and motoneurons. Exemplar PSTH and coherence spectra for (A) an interneuron spike train relative to the stimulus, (B) a motor unit spike train relative to the stimulus, and (C) a motor unit spike train relative to an interneuron spike train. On each plot of the coherence spectra, a dashed horizontal line represents a 99% confidence limit. Coherence values exceeding this confidence limit at the stimulation frequency (identified with vertical dashed lines), were considered significant. The occurrence of significant coherence is mapped onto the matrix illustrated in panel (D). The top row indicates interneurons that were and were not significantly cohered to the stimulus pulse times, while this same information for each motor unit is provided along the first column. All subsequent columns starting after the second row indicate instances where an interneuron was significantly cohered with a motor unit. The red vertical line separates interneurons that were recorded at the rostral (left) and caudal (right) spinal segments. Interneurons are further stratified according to depth, with deeper interneurons at each recording site being plotted further to the right. For all significant relations, the peak of coherence (after z-transformation) at the stimulation frequency was calculated. The magnitude of coherence between the stimulus and each interneuron and motor unit, and between each interneuron and motor unit for this exemplar trial is mapped onto the matrix in panel (E).
FIGURE 6
FIGURE 6
Occurrence of significant coherence during contralateral tibial and ipsilateral sural nerve stimulation across frequencies. (A) Percentage of interneurons during each trial that were significantly cohered to the stimulus pulse train. The leftmost plot displays these percentage values for the entire interneuron population recorded during each trial, while the middle and right plots display the percentage of interneurons from each recording site that were cohered to the stimulus. (B) Percentage of the motor unit population that were significantly cohered to each interneuron during each trial across the entire population of interneurons (left) and population of interneurons at each recording site (right). (C) Percentage of motor pool that was significantly cohered to the stimulus pulse train. Bars represent the average percentage of significant coherence; individual data points have been jittered with uniformly distributed noise to minimize overlap.
FIGURE 7
FIGURE 7
Magnitude of significant coherence during contralateral tibial and ipsilateral sural nerve stimulation across frequencies. (A) Peak of coherence between the stimulus pulse train and each interneuron; (B) each interneuron and motor unit; and (C) the stimulus pulse train and each motor unit at the stimulation frequency. Bars represent the mean coherence value after z-transformation; individual data points have been jittered with uniformly distributed noise to minimize overlap.
FIGURE 8
FIGURE 8
Percentage of motor pool significantly cohered to discharge of individual interneurons (represented as single points) stratified as a function of interneuron depth for contralateral tibial [blue; (A)] and ipsilateral sural [red; (B)] nerve stimulation collapsed across frequencies. Horizontal dashes represent the mean percentage of motor unit cohered to individual interneurons within each depth bin. The vertical dashed line represents the median depth of the population of interneurons recorded at each spinal recording site. These median values were used to classify interneurons as superficial (≤median) or deep (>median) when examining the effect of interneuron depth on interneuron-motoneuron connectivity.
FIGURE 9
FIGURE 9
(A) Matrices illustrating the incidence of significant coherence between interneurons during exemplar trials of 10 Hz tibial (left) and sural (right) nerve stimulation. Yellow lines separate units recorded at the rostral (L3) and caudal (L6/7) recording sites. Within each recording site, interneurons are stratified by depth, with deeper units plotted further to the right. (B) Percentage of interneuron population significantly cohered to discharge of individual interneurons across frequencies in response to contralateral tibial [blue; (A)] and ipsilateral sural [red; (B)] nerve stimulation. Bars represent means; data points are jittered with uniformly distributed noise to minimize overlap.
FIGURE 10
FIGURE 10
Matrices illustrating the incidence of significant excitatory and inhibitory synchrony between interneurons during exemplar trials of tibial (left) and sural (right) nerve stimulation. PSTHs illustrate exemplar pairs of interneurons displaying excitatory (top) and inhibitory (bottom) synchrony. Dashed horizontal lines on PSTHs represent 95% confidence intervals calculated from a 15 ms pre-stimulus period.

Similar articles

Cited by

  • Linking cortex and contraction-Integrating models along the corticomuscular pathway.
    Haggie L, Schmid L, Röhrle O, Besier T, McMorland A, Saini H. Haggie L, et al. Front Physiol. 2023 May 10;14:1095260. doi: 10.3389/fphys.2023.1095260. eCollection 2023. Front Physiol. 2023. PMID: 37234419 Free PMC article.
  • Myomatrix arrays for high-definition muscle recording.
    Chung B, Zia M, Thomas KA, Michaels JA, Jacob A, Pack A, Williams MJ, Nagapudi K, Teng LH, Arrambide E, Ouellette L, Oey N, Gibbs R, Anschutz P, Lu J, Wu Y, Kashefi M, Oya T, Kersten R, Mosberger AC, O'Connell S, Wang R, Marques H, Mendes AR, Lenschow C, Kondakath G, Kim JJ, Olson W, Quinn KN, Perkins P, Gatto G, Thanawalla A, Coltman S, Kim T, Smith T, Binder-Markey B, Zaback M, Thompson CK, Giszter S, Person A, Goulding M, Azim E, Thakor N, O'Connor D, Trimmer B, Lima SQ, Carey MR, Pandarinath C, Costa RM, Pruszynski JA, Bakir M, Sober SJ. Chung B, et al. Elife. 2023 Dec 19;12:RP88551. doi: 10.7554/eLife.88551. Elife. 2023. PMID: 38113081 Free PMC article.

References

    1. AuYong N., Ollivier-Lanvin K., Lemay M. A. (2011a). Preferred locomotor phase of activity of lumbar interneurons during air-stepping in subchronic spinal cats. J. Neurophysiol. 105 1011–1022. 10.1152/jn.00523.2010 - DOI - PMC - PubMed
    1. AuYong N., Ollivier-Lanvin K., Lemay M. A. (2011b). Population spatiotemporal dynamics of spinal intermediate zone interneurons during air-stepping in adult spinal cats. J. Neurophysiol. 106 1943–1953. 10.1152/jn.00258.2011 - DOI - PMC - PubMed
    1. Bannatyne B. A., Edgley S. A., Hammar I., Jankowska E., Maxwell D. J. (2006). Differential projections of excitatory and inhibitory dorsal horn interneurons relaying information from group II muscle afferents in the cat spinal cord. J. Neurosci. 26 2871–2880. 10.1523/JNEUROSCI.5172-05.2006 - DOI - PMC - PubMed
    1. Brownstone R. M., Bui T. V. (2010). Spinal interneurons providing input to the final common path during locomotion. Prog. Brain Res. 187 81–95. 10.1016/B978-0-444-53613-6.00006-X - DOI - PMC - PubMed
    1. Cote M. P., Gossard J. P. (2004). Step training-dependent plasticity in spinal cutaneous pathways. J. Neurosci. 24 11317–11327. 10.1523/JNEUROSCI.1486-04.2004 - DOI - PMC - PubMed

Publication types