. 2022 Mar 17;8(1):veac002.
doi: 10.1093/ve/veac002. eCollection 2022.

Determinants of SARS-CoV-2 transmission to guide vaccination strategy in an urban area

Affiliations

Determinants of SARS-CoV-2 transmission to guide vaccination strategy in an urban area

Sarah C Brüningk et al. Virus Evol. .

Abstract

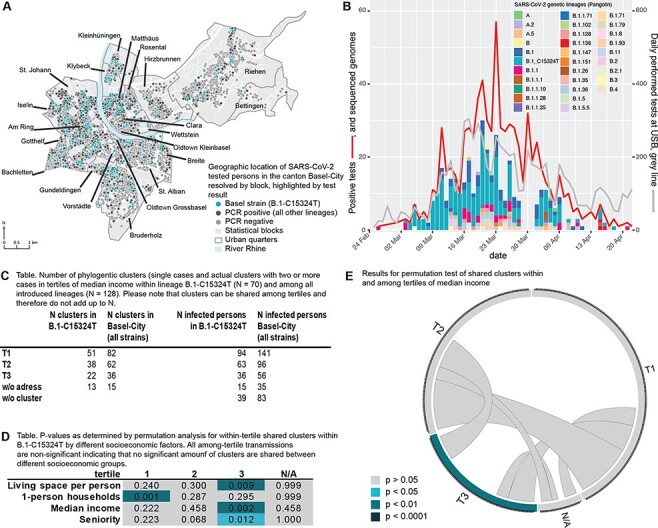
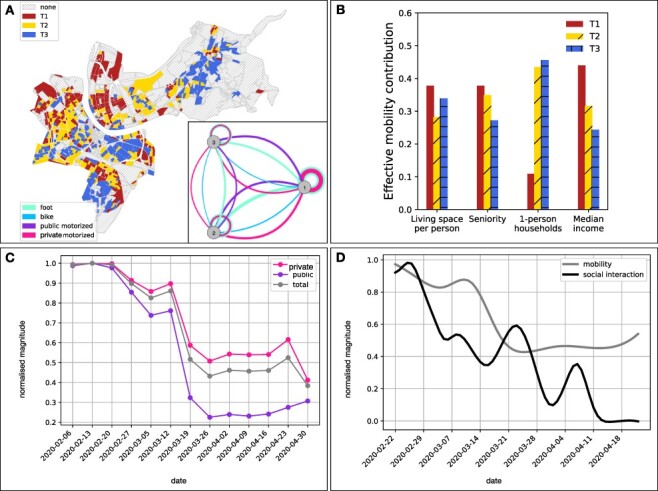
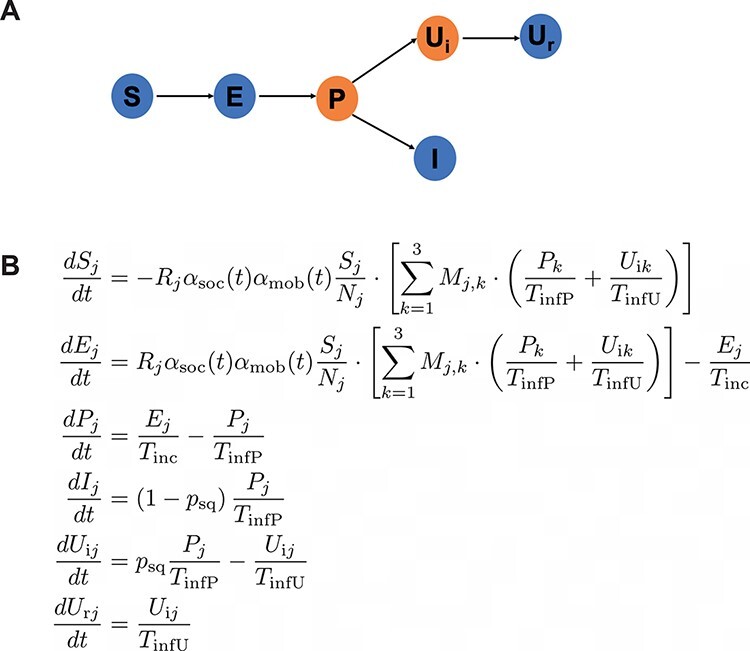
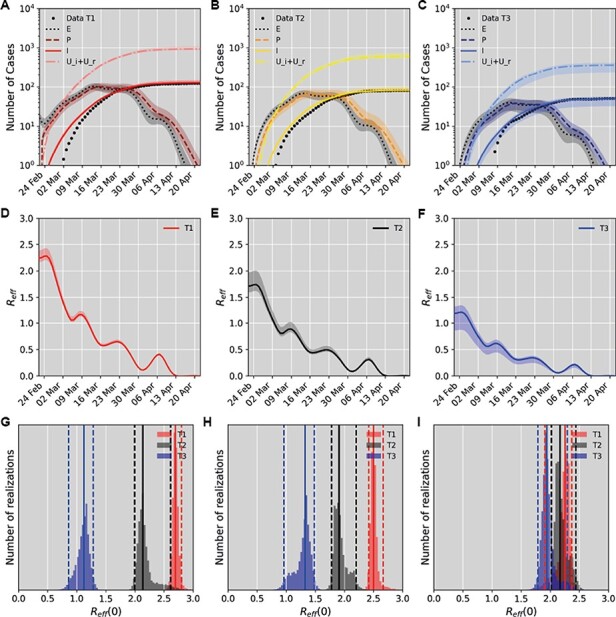
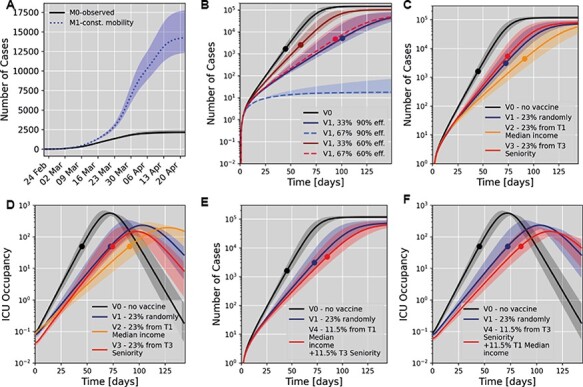
Transmission chains within small urban areas (accommodating ∼30 per cent of the European population) greatly contribute to case burden and economic impact during the ongoing coronavirus pandemic and should be a focus for preventive measures to achieve containment. Here, at very high spatio-temporal resolution, we analysed determinants of severe acute respiratory syndrome coronavirus 2 (SARS-CoV-2) transmission in a European urban area, Basel-City (Switzerland). We combined detailed epidemiological, intra-city mobility and socio-economic data sets with whole-genome sequencing during the first SARS-CoV-2 wave. For this, we succeeded in sequencing 44 per cent of all reported cases from Basel-City and performed phylogenetic clustering and compartmental modelling based on the dominating viral variant (B.1-C15324T; 60 per cent of cases) to identify drivers and patterns of transmission. Based on these results we simulated vaccination scenarios and corresponding healthcare system burden (intensive care unit (ICU) occupancy). Transmissions were driven by socio-economically weaker and highly mobile population groups with mostly cryptic transmissions which lacked genetic and identifiable epidemiological links. Amongst more senior population transmission was clustered. Simulated vaccination scenarios assuming 60-90 per cent transmission reduction and 70-90 per cent reduction of severe cases showed that prioritising mobile, socio-economically weaker populations for vaccination would effectively reduce case numbers. However, long-term ICU occupation would also be effectively reduced if senior population groups were prioritised, provided there were no changes in testing and prevention strategies. Reducing SARS-CoV-2 transmission through vaccination strongly depends on the efficacy of the deployed vaccine. A combined strategy of protecting risk groups by extensive testing coupled with vaccination of the drivers of transmission (i.e. highly mobile groups) would be most effective at reducing the spread of SARS-CoV-2 within an urban area.


Figures

Figure 2.
Figure 2.
SARS-CoV-2 transmission in and among socio-economic and demographic groups during the first COVID-19 wave in Basel-City. A) Spatial positive/negative case distribution throughout the city with the most dominant SARS-CoV-2 variant (B.1-C15324T), the focus of this study, highlighted in turquoise. B) Epidemiological curve for Basel-City and distribution of phylogenetic lineages (pangolin nomenclature) from 25 February to 22 April 2020. C) Summary for inferred phylogenetic clusters within (1) all lineages and (2) the major variant B.1-C15324T in tertiles of median income. High number of infected people within a tertile with a low number of clusters indicates presence of large transmission clusters whereas large number of clusters and low number of people infected within a tertile indicates random infections and cryptic transmission. D) Results of a significance test for transmission between tertiles of different socio-economic factors. T1: low, T2: intermediate, T3: high, N/A: no available data or censored for privacy reasons. E) Visualisation of a signi ficance,test for transmission within (indicated on circle edges) and among (intra-circle connections) tertiles of median income.
Figure 3.
Figure 3.
Spatio-temporal variation of mobility patterns within the Canton of Basel-City. A) Basel-City and its delineation with respect to statistical blocks coloured according to the partition into tertiles T1, T2 and T3 of increasing median income. Inset: resulting mobility graph, with nodes representing tertiles and edge widths representing the strength of effective connectedness through mobility by means of various modes of transport, as computed from the traffic model provided by the traffic department of the Canton of Basel-City. B) Relative mean contribution of mobility to a socio-economic tertile’s effective reproductive number associated with the major variant B.1-C15324T. C) Normalised temporal development of private and public transport as well as their weighted sum during the first wave of the pandemic in Basel-City. D) Smoothed relative temporal development of social interaction and mobility contribution to the effective reproductive number associated with the major variant B.1-C15324T.
Figure 1.
Figure 1.
Overview of the susceptible-exposed-infected-recovered (SEIR) model. A) Conceptual overview. We accounted for susceptibles (S), exposed (E, incubation time Tinc) and pre-symptomatic yet infectious cases (P). After a presymptomatic time TinfP, cases were separated according to the estimated proportion of reported and sequenced cases, psq, into either reported infectious (I) or unreported infectious (Ui, reproductive number R). Since our data did not include information on recovered patients, a ‘recovered’ compartment was not included following I. It was assumed that reported cases remained isolated. The unreported compartment transitions to recovery (Ur) after an infectious time TinfU. B) Relevant model equations to incorporate connectivity and exchange between the defined tertiles (index j). Cross-contamination was included through the mobility matrix Mjk and relevant temporal variation of mobility and social interaction (weighting factors formula image and formula image).
Figure 4.
Figure 4.
Model fit to the case number time series. A–C) Fit results for a partition based on median income. Data points are shown together with model simulations (median (lines), and 95 per cent confidence bounds (shaded)) for the different tertiles T1 (low, A), T2 (intermediate, B) and T3 (high median income, C). Model compartments E (exposed), P (presymptomatic), I (reported infectious) and formula image (sum of the unreported infectious and recovered cases) are shown. Fits achieved a root mean squared error of 0.75, 0.49 and 0.34 cases for absolute and 5.3, 3.2 and 2.5 cases for cumulative cases for T1–T3. D–F) The dynamic variation of the effective reproductive number for each of the tertiles shown in A–C. Median values (lines) are shown with 95 per cent confidence bounds (shaded). G–I) Pre-lockdown reproductive number for each socio-economic partition. Parameter distributions obtained using Markov Chain Monte Carlo analysis (histograms) are shown with median values (solid lines) and indicated 95 per cent confidence bounds (dashed lines). Results are shown for partitions based on median income (G), living space per person (H) and share of senior residents (I).
Figure 5.
Figure 5.
Scenario simulations for a partition based on median income. All subsets A,B,C and E show the total number of infected cases (i.e. the sum of compartments I, Ui, and Ur. A) Influence of the mobility pattern on the total number of infected cases during the first wave (sum of reported and unreported cases) modelling either no change in mobility (no lockdown scenario, M1) or the observed scenario (MO) is shown. B) Simulation of simulated vaccination effects if a specific percentage of all citizens was randomly selected for vaccination at given efficacy (V1). We compare this to the scenario of no vaccine (V0). * Here vaccination of different population fractions at either 60 per cent or 90 per cent efficacy to prevent SARS-CoV-2 transmission were modelled. Median values (lines) and 95 per cent confidence bounds (shaded) are shown. Dots indicate the time of reaching a 50 per cent ICU occupancy. C) Simulation of future vaccination effects based on a partition according to median income. Scenario V2 models vaccination of 23 per cent of all citizens selected from the tertile with the lowest median income (T1). Scenario V3 models vaccination of 23 per cent of all citizens selected from the tertile with the highest share of senior residents (T3). In C–E we model 90 per cent vaccine efficacy (transmission and severe COVID-19) and compare with scenarios V0 and V1. D) Temporal evolution of ICU occupancy for the scenarios modelled in C. E) Simulation of a mixed vaccination strategy giving equal priority to senior citizens and mobile population groups. F) Temporal evolution of ICU occupancy for the scenarios modelled in E).

Similar articles

Cited by

References

    1. Anderson R. M., Vegvari C., Truscott J. and Collyer B. S. (2020), ‘Challenges in creating herd immunity to SARS-CoV-2 infection by mass vaccination’, The Lancet 396: 1614–1616. doi: 10.1016/S0140-6736(20)32318-7 - DOI - PMC - PubMed
    1. AstraZeneca (2020), ‘AZD1222 vaccine met primary efficacy endpoint in preventing COVID-19’.
    1. Bau- und Verkehrsdepartement Basel-Stadt Mobilität / Mobilitätsstrategie (2020), ‘Gesamtverkehrsmodell der Region Basel, Basismodell: “Ist-Zustand 2016”’.
    1. Bluhm A., Christandl M., Gesmundo F., Ravn Klausen F., Mančinska L., Steffan V., Stilck França D. and Werner A. H. (2020), ‘SARS-CoV-2 transmission routes from genetic data: A Danish case study’, PLOS ONE 15: e0241405. doi: 10.1371/journal.pone.0241405 - DOI - PMC - PubMed
    1. Bubar K. M., Reinholt K., Kissler S. M., Lipsitch M., Cobey S., Grad Y. H. and Larremore D. B. (2021), ‘Model-informed COVID-19 vaccine prioritization strategies by age and serostatus’, Science 371: 916–921. doi: 10.1126/science.abe6959 - DOI - PMC - PubMed