

Chromosome-Level Genome Assembly for Acer pseudosieboldianum and Highlights to Mechanisms for Leaf Color and Shape Change
- PMID: 35310631
- PMCID: PMC8927880
- DOI: 10.3389/fpls.2022.850054
Chromosome-Level Genome Assembly for Acer pseudosieboldianum and Highlights to Mechanisms for Leaf Color and Shape Change
Abstract
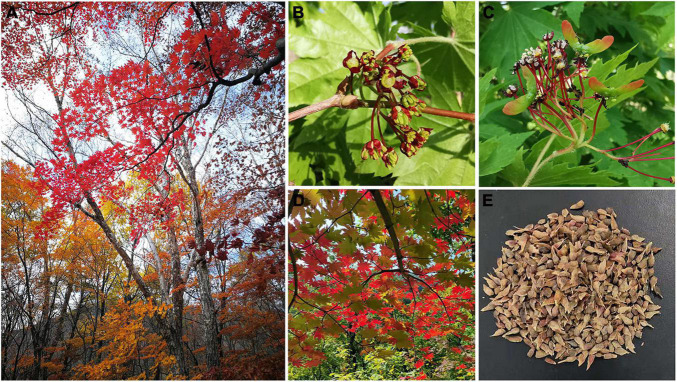
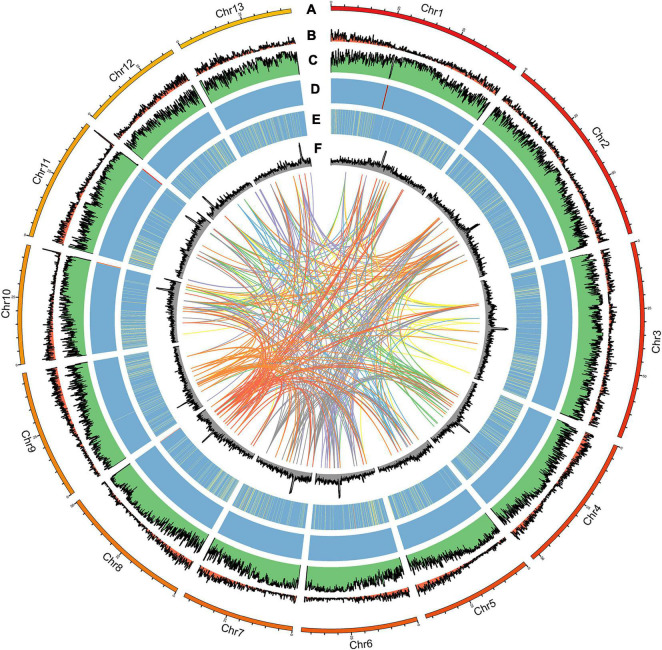
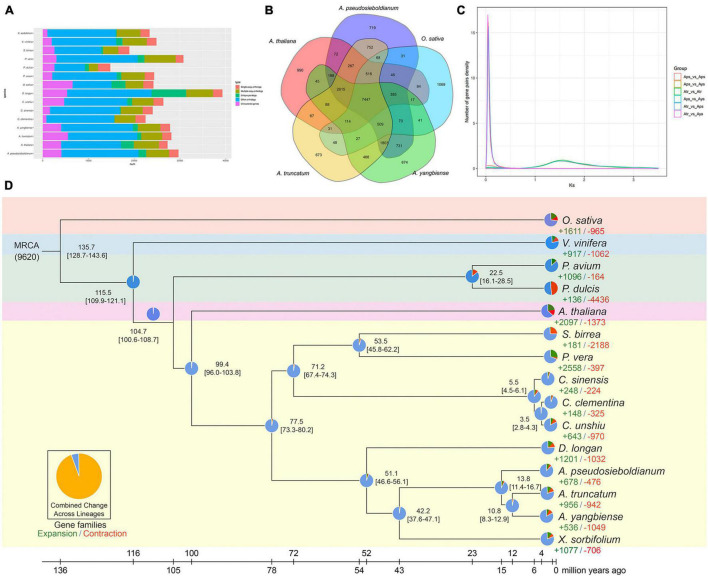
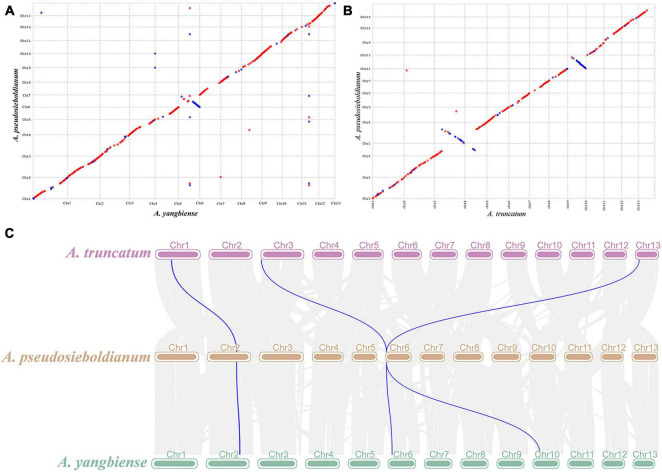
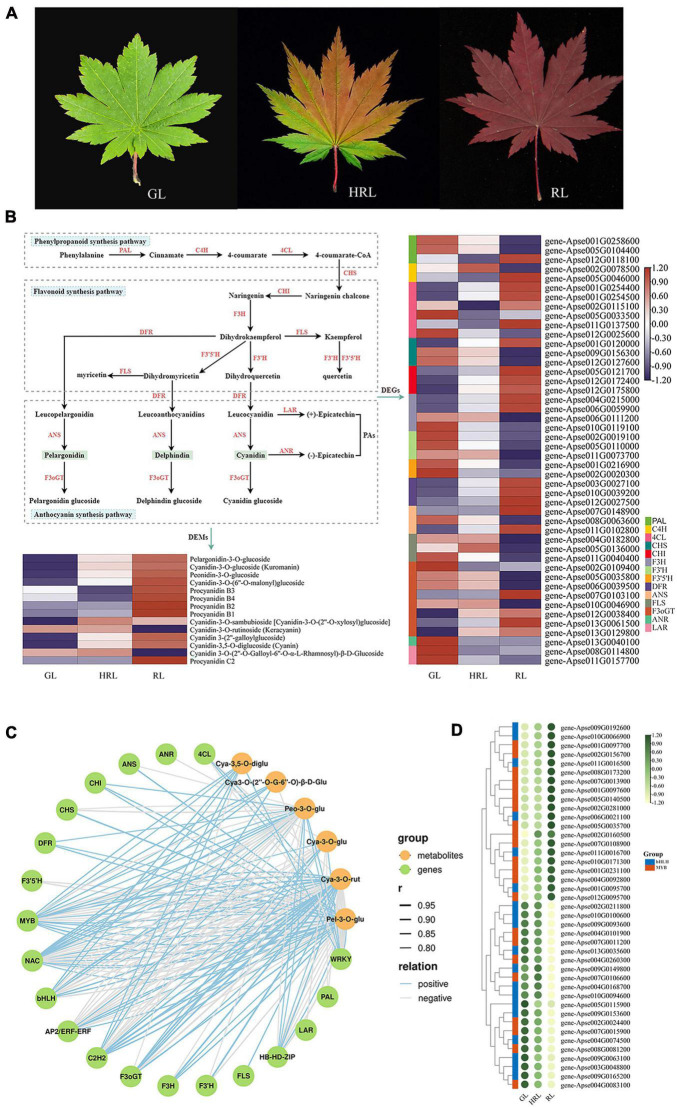
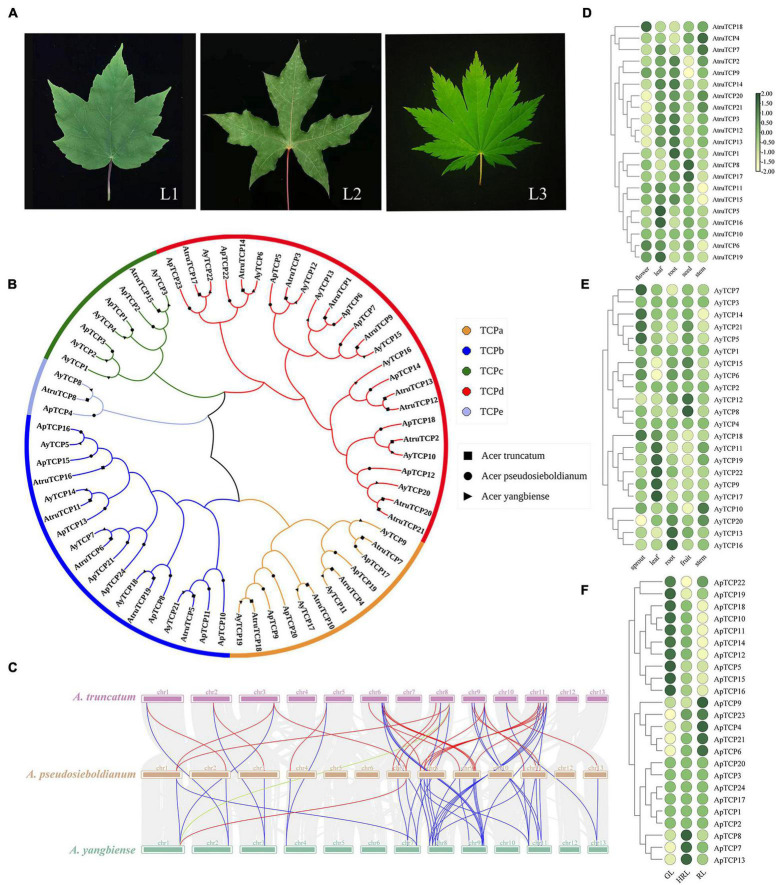
Acer pseudosieboldianum (Pax) Komarov is an ornamental plant with prominent potential and is naturally distributed in Northeast China. Here, we obtained a chromosome-scale genome assembly of A. pseudosieboldianum combining HiFi and Hi-C data, and the final assembled genome size was 690.24 Mb and consisted of 287 contigs, with a contig N50 value of 5.7 Mb and a BUSCO complete gene percentage of 98.4%. Genome evolution analysis showed that an ancient duplication occurred in A. pseudosieboldianum. Phylogenetic analyses revealed that Aceraceae family could be incorporated into Sapindaceae, consistent with the present Angiosperm Phylogeny Group system. We further construct a gene-to-metabolite correlation network and identified key genes and metabolites that might be involved in anthocyanin biosynthesis pathways during leaf color change. Additionally, we identified crucial teosinte branched1, cycloidea, and proliferating cell factors (TCP) transcription factors that might be involved in leaf morphology regulation of A. pseudosieboldianum, Acer yangbiense and Acer truncatum. Overall, this reference genome is a valuable resource for evolutionary history studies of A. pseudosieboldianum and lays a fundamental foundation for its molecular breeding.
Keywords: Acer pseudosieboldianum; Hi-C; HiFi; PacBio SMRT; TCPs; genome assembly.
Copyright © 2022 Li, Cai, Han, Zhang, Sun, Xie, Han, Guo, Tigabu, Sederoff, Pei, Zhao and Zhao.
Conflict of interest statement
The authors declare that the research was conducted in the absence of any commercial or financial relationships that could be construed as a potential conflict of interest.
Figures
Similar articles
-
Anthocyanin metabolites and related regulatory genes analysis in leaves of Acer Pseudosieboldianum mutant during different periods of color change.BMC Genomics. 2025 Feb 22;26(1):182. doi: 10.1186/s12864-025-11378-3. BMC Genomics. 2025. PMID: 39987037 Free PMC article.
-
De novo transcriptome sequencing and anthocyanin metabolite analysis reveals leaf color of Acer pseudosieboldianum in autumn.BMC Genomics. 2021 May 25;22(1):383. doi: 10.1186/s12864-021-07715-x. BMC Genomics. 2021. PMID: 34034673 Free PMC article.
-
De novo genome assembly of the endangered Acer yangbiense, a plant species with extremely small populations endemic to Yunnan Province, China.Gigascience. 2019 Jul 1;8(7):giz085. doi: 10.1093/gigascience/giz085. Gigascience. 2019. PMID: 31307060 Free PMC article.
-
De novo transcriptome revealed genes involved in anthocyanin biosynthesis, transport, and regulation in a mutant of Acer pseudosieboldianum.BMC Genomics. 2022 Aug 8;23(1):567. doi: 10.1186/s12864-022-08815-y. BMC Genomics. 2022. PMID: 35941547 Free PMC article.
-
Evolving Tale of TCPs: New Paradigms and Old Lacunae.Front Plant Sci. 2017 Apr 3;8:479. doi: 10.3389/fpls.2017.00479. eCollection 2017. Front Plant Sci. 2017. PMID: 28421104 Free PMC article. Review.
Cited by
-
Transcriptomics Profiling of Acer pseudosieboldianum Molecular Mechanism against Freezing Stress.Int J Mol Sci. 2022 Nov 24;23(23):14676. doi: 10.3390/ijms232314676. Int J Mol Sci. 2022. PMID: 36499002 Free PMC article.
-
cDNA Cloning, Bioinformatics, and Expression Analysis of ApsANS in Acer pseudosieboldianum.Int J Mol Sci. 2025 Feb 21;26(5):1865. doi: 10.3390/ijms26051865. Int J Mol Sci. 2025. PMID: 40076492 Free PMC article.
-
The chromosome-level genome assembly of Prunus cerasifera 'Atropurpurea'.Sci Data. 2025 Jul 11;12(1):1197. doi: 10.1038/s41597-025-05568-7. Sci Data. 2025. PMID: 40646011 Free PMC article.
-
Genome-wide identification and functional analysis of R2R3-MYB genes in Acer pseudosieboldianum: insights into low temperature stress response and anthocyanin biosynthesis.BMC Plant Biol. 2025 Jul 2;25(1):795. doi: 10.1186/s12870-025-06782-6. BMC Plant Biol. 2025. PMID: 40596834 Free PMC article.
-
Profiling genome-wide methylation in two maples: Fine-scale approaches to detection with nanopore technology.Evol Appl. 2024 Apr 17;17(4):e13669. doi: 10.1111/eva.13669. eCollection 2024 Apr. Evol Appl. 2024. PMID: 38633133 Free PMC article.
References
LinkOut - more resources
Full Text Sources
Miscellaneous