. 2021 Sep 13:6:22.
doi: 10.12688/wellcomeopenres.16524.3. eCollection 2021.

Individual-level variations in malaria susceptibility and acquisition of clinical protection

Affiliations

Individual-level variations in malaria susceptibility and acquisition of clinical protection

John Joseph Valletta et al. Wellcome Open Res. .

Abstract

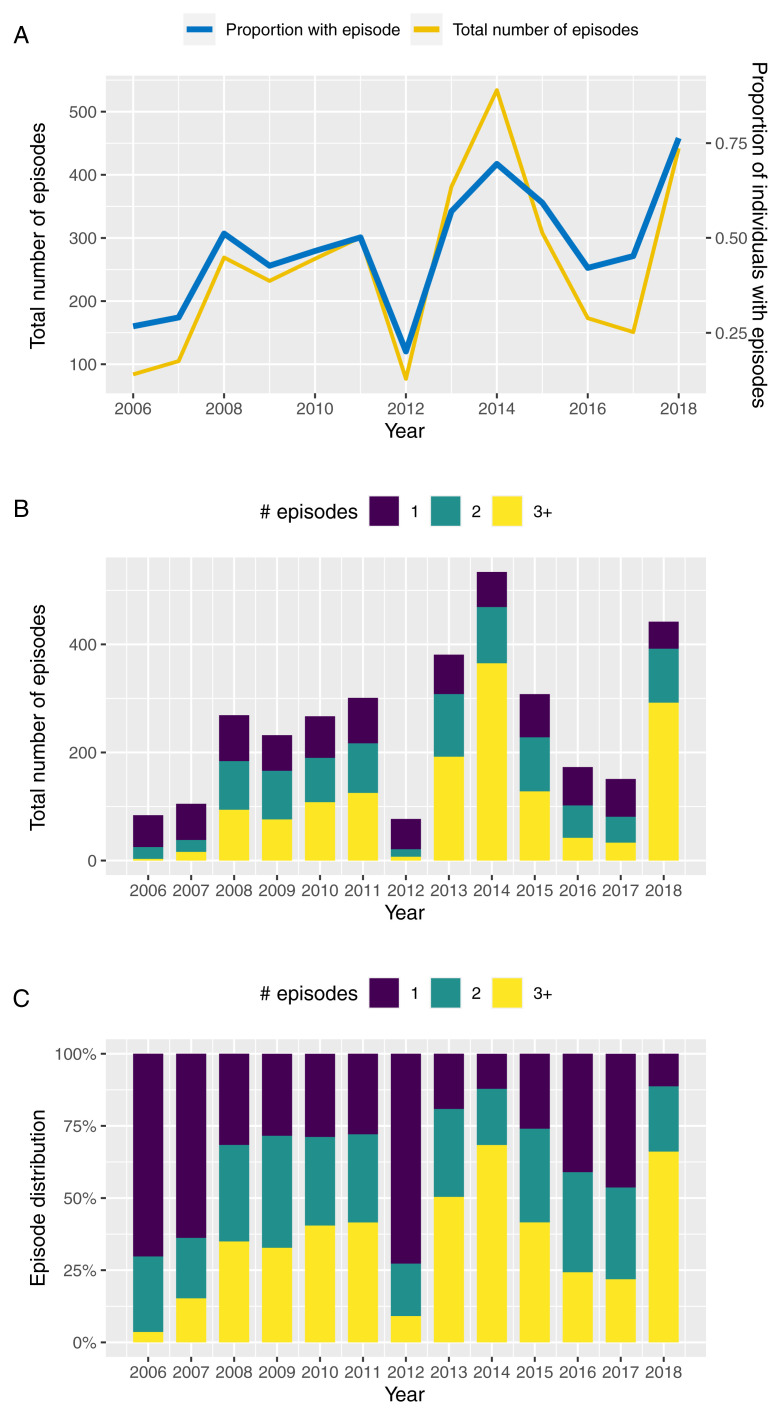
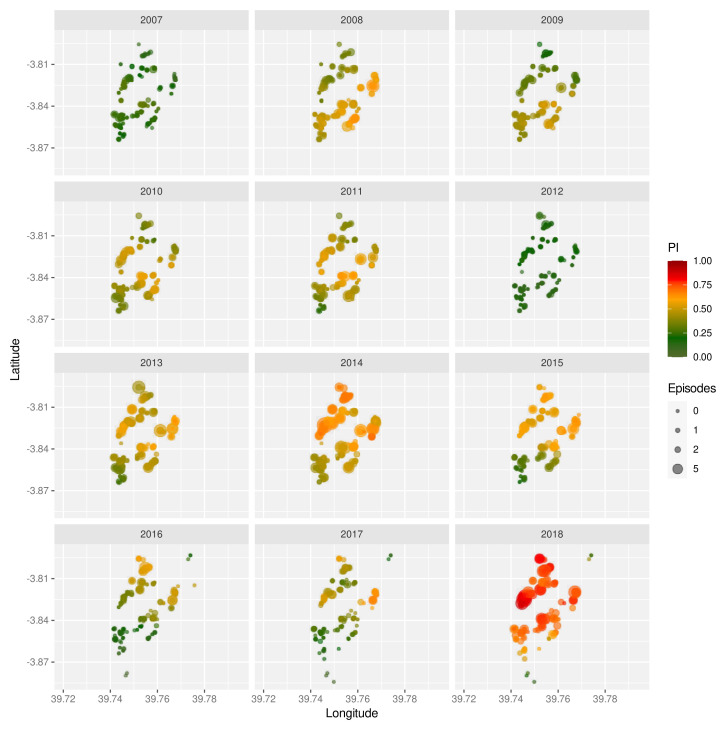
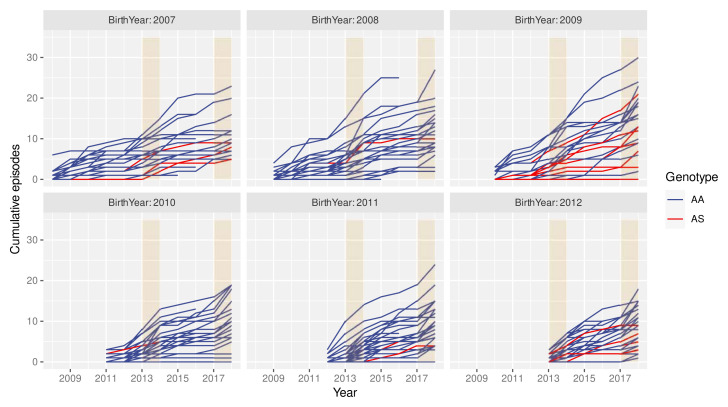
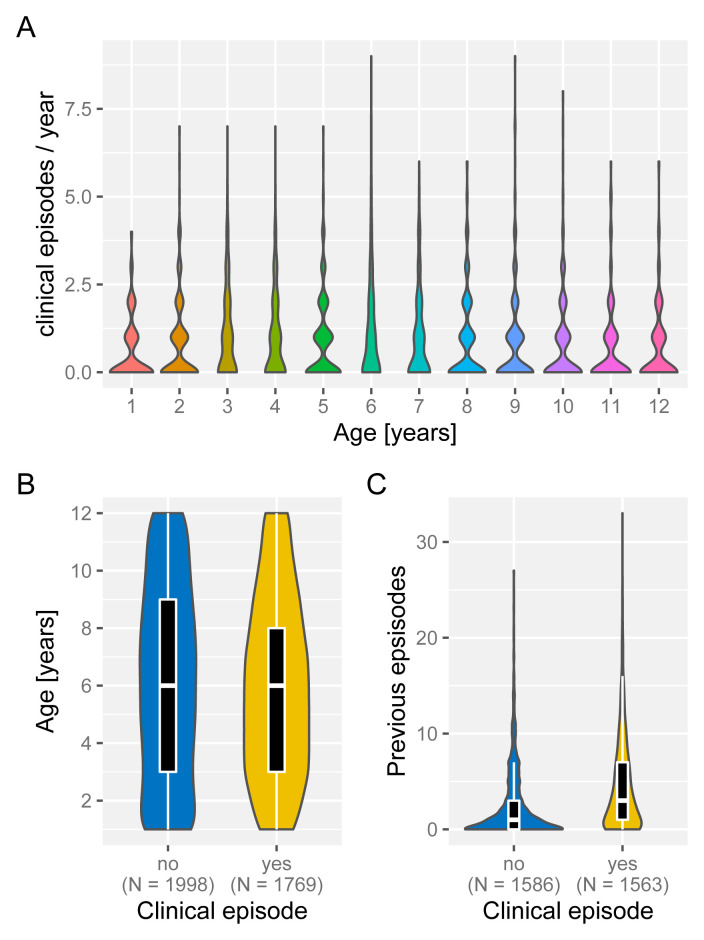
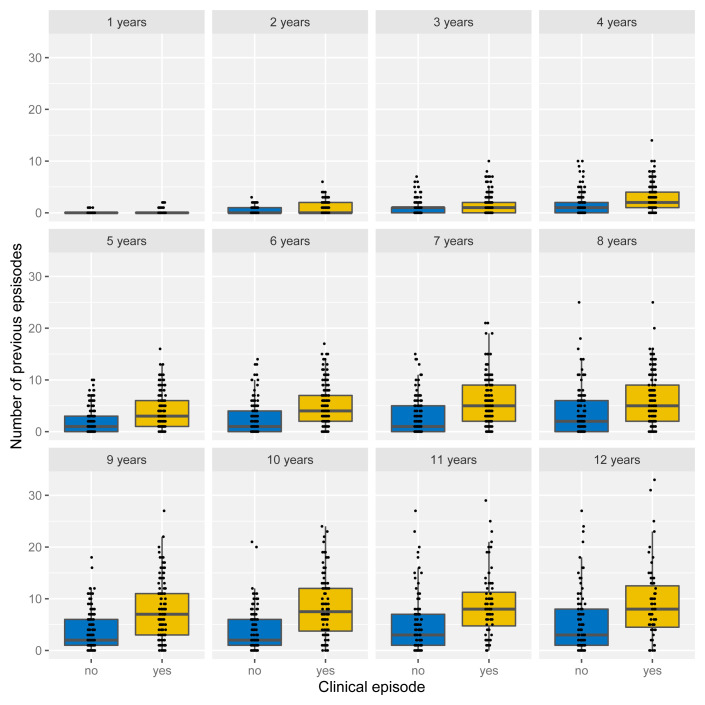
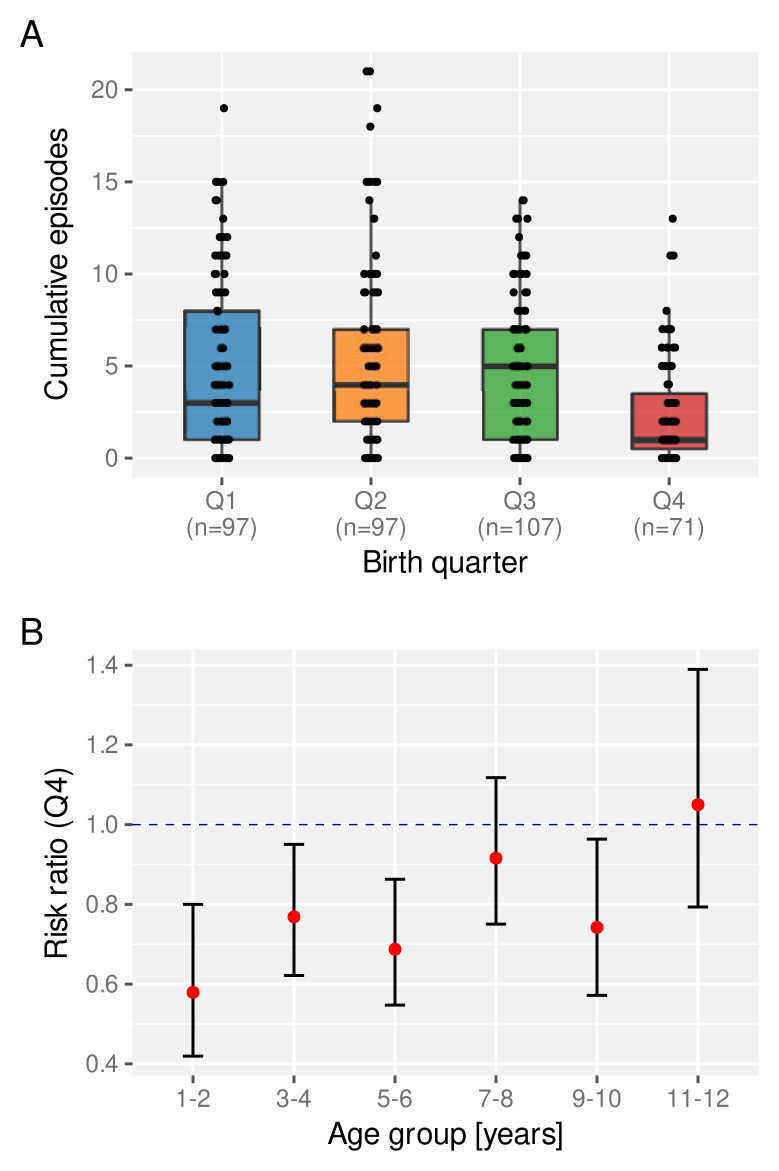
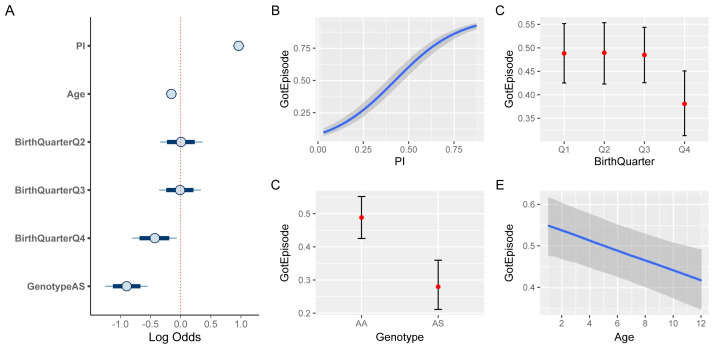
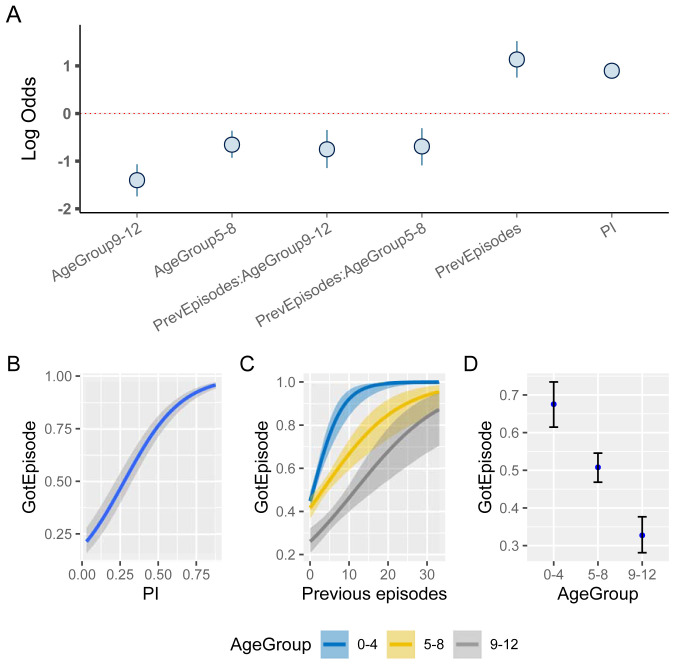
After decades of research, our understanding of when and why individuals infected with Plasmodium falciparum develop clinical malaria is still limited. Correlates of immune protection are often sought through prospective cohort studies, where measured host factors are correlated against the incidence of clinical disease over a set period of time. However, robustly inferring individual-level protection from these population-level findings has proved difficult due to small effect sizes and high levels of variance underlying such data. In order to better understand the nature of these inter-individual variations, we analysed the long-term malaria epidemiology of children ≤12 years old growing up under seasonal exposure to the parasite in the sub-location of Junju, Kenya. Despite the cohort's limited geographic expanse (ca. 3km x 10km), our data reveal a high degree of spatial and temporal variability in malaria prevalence and incidence rates, causing individuals to experience varying levels of exposure to the parasite at different times during their life. Analysing individual-level infection histories further reveal an unexpectedly high variability in the rate at which children experience clinical malaria episodes. Besides exposure to the parasite, measured as disease prevalence in the surrounding area, we find that the birth time of year has an independent effect on the individual's risk of experiencing a clinical episode. Furthermore, our analyses reveal that those children with a history of an above average number of episodes are more likely to experience further episodes during the upcoming transmission season. These findings are indicative of phenotypic differences in the rates by which children acquire clinical protection to malaria and offer important insights into the natural variability underlying malaria epidemiology.

Keywords: Plasmodium falciparum; clinical malaria; longitudinal cohort study; malaria susceptibility; naturally acquired immunity; spatial heterogeneity.


Conflict of interest statement

No competing interests were disclosed.

Figures

Figure 1.
Figure 1.. Temporal variation in malaria incidence.
A. Temporal variance in the number of clinical episodes and proportion of individuals with a recorded episode in Junju, Kenya, between 2006 and 2018. B, C. Temporal variation in the distribution of children experiencing 1 (blue bars), 2 (green bars), or ≥ 3 clinical episodes (yellow bars) per year between 2006 and 2018, highlighting an excess of multiple episodes in years of high transmission (2014 and 2018).
Figure 2.
Figure 2.. Spatio-temporal variation in malaria prevalence.
Geographic homestead location of children enrolled in the Junju cohort, stratified by year. The size of each point correspond to the child’s number of recorded episodes that year, with the colour indicating their prevalence index ( PI).
Figure 3.
Figure 3.. High variance in clinical episode histories.
Graphs showing individual children’s cumulative number of clinical malaria episodes over time, stratified by birth year. Red lines indicate children with the sickle cell trait (AS). Orange rectangles highlight high malaria transmission years (2014 and 2018).
Figure 4.
Figure 4.. Effect of age and exposure history on risk of clinical malaria.
Box and whisker plots indicate the median and inter quartile ranges of age and previous number of episodes of individuals with or without a recorded episode in a given year. Due to confounding effect of the sickle cell trait, AS individuals were removed in ( C).
Figure 5.
Figure 5.. Age-stratified distribution of episode history in relation to risk of clinical malaria.
Box and whisker plots indicate the median and inter quartile ranges of age and previous number of episodes of individuals with or without a recorded episode in a given year. Individuals with sickle cell trait removed.
Figure 6.
Figure 6.. The effect of birth quarter on the risk of clinical malaria.
A. Distribution of the number of clinical episodes experienced by an individual child by the age of 6 years stratified by birth quarter. Box and whisker plots indicate the median and inter quartile ranges. B. Risk ratio of experiencing a clinical episode in a given year between children born in Q4 compared to those born between Q1 and Q3.
Figure 7.
Figure 7.. Risk factor analysis of clinical malaria.
A. Estimated effect sizes (plus 80% and 95% CI; boxes and bars, respectively) for individual factors underlying risk of clinical malaria. BE. Conditional effect plots showing the the probability of a clinical episode against prevalence index ( B), sickle cell genotype ( C), birth time of year ( D), and age ( E). The solid lines ( B, E) and circles ( C, D) represent the median and the shaded areas ( B, E) and whiskers ( C, D) the 95% prediction intervals.
Figure 8.
Figure 8.. The effect of previous episode histories on the susceptibility to clinical malaria.
A. Estimated effect sizes (plus 80% and 95% CI; boxes and bars, respectively) for individual factors underlying risk of clinical malaria. BD. Conditional effect plots showing the the probability of a clinical episode against prevalence index ( B), previous episodes ( C), and age ( D). The solid lines and shaded regions represent the median and the 95% prediction intervals.

References

    1. Langhorne J, Ndungu FM, Sponaas AM, et al. : Immunity to malaria: more questions than answers. Nat Immunol. 2008;9(7):725–32. 10.1038/ni.f.205 - DOI - PubMed
    1. Bull PC, Lowe BS, Kortok M, et al. : Parasite antigens on the infected red cell surface are targets for naturally acquired immunity to malaria. Nat Med. 1998;4(3):358–360. 10.1038/nm0398-358 - DOI - PMC - PubMed
    1. Ofori MF, Dodoo D, Staalsoe T, et al. : Malaria-induced acquisition of antibodies to Plasmodium falciparum variant surface antigens. Infect Immun. 2002;70(6):2982–2988. 10.1128/iai.70.6.2982-2988.2002 - DOI - PMC - PubMed
    1. Chan JA, Howell KB, Reiling L, et al. : Targets of antibodies against Plasmodium falciparum-infected erythrocytes in malaria immunity. J Clin Invest. 2012;122(9):3227–38. 10.1172/JCI62182 - DOI - PMC - PubMed
    1. Gupta S, Snow RW, Donnelly CA, et al. : Immunity to non-cerebral severe malaria is acquired after one or two infections. Nat Med. 1999;5(3):340–3. 10.1038/6560 - DOI - PubMed

LinkOut - more resources