

Current status and pillars of direct air capture technologies
- PMID: 35310937
- PMCID: PMC8927912
- DOI: 10.1016/j.isci.2022.103990
Current status and pillars of direct air capture technologies
Abstract
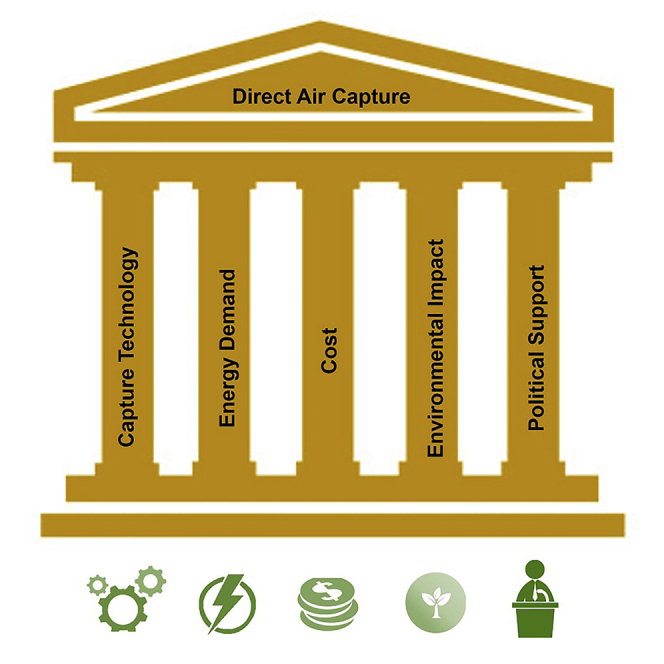
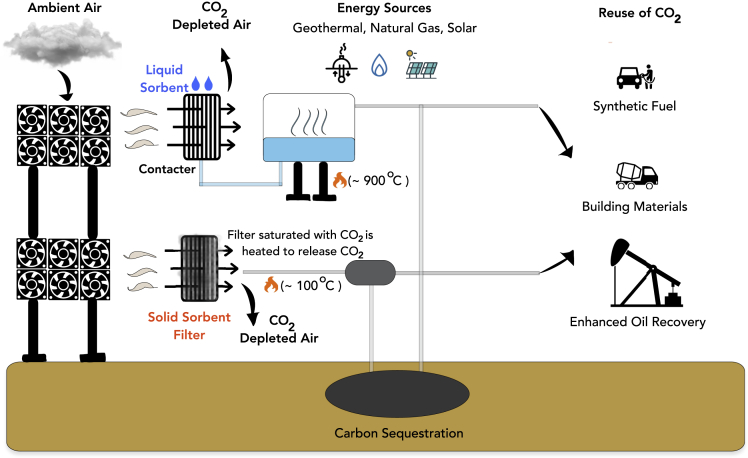
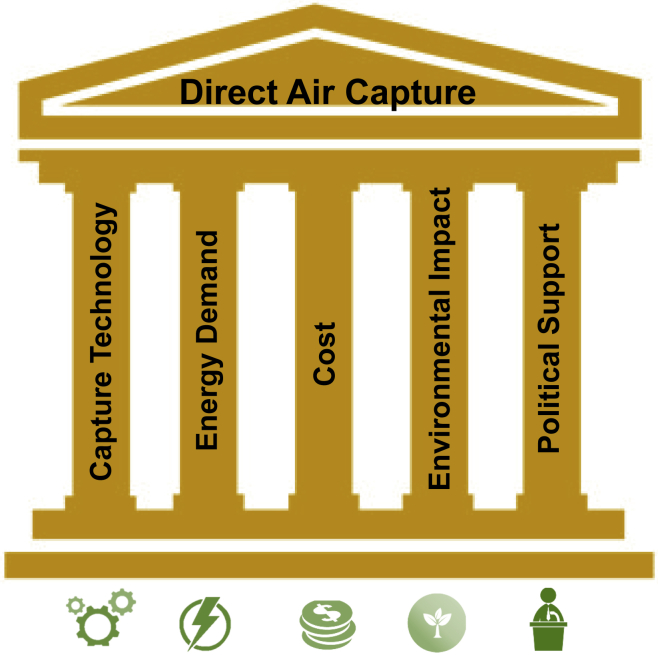
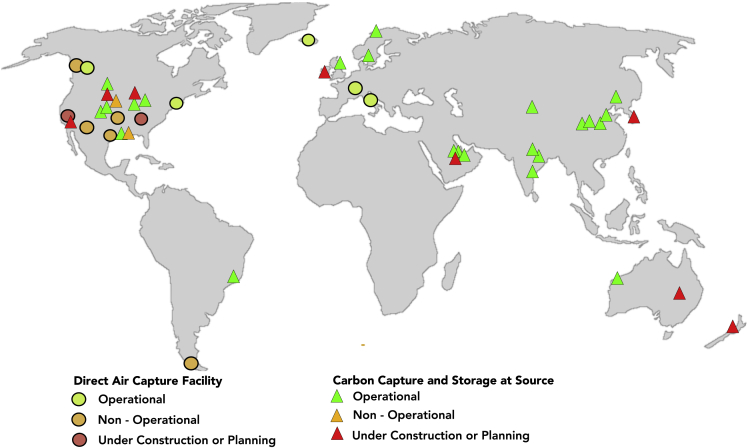
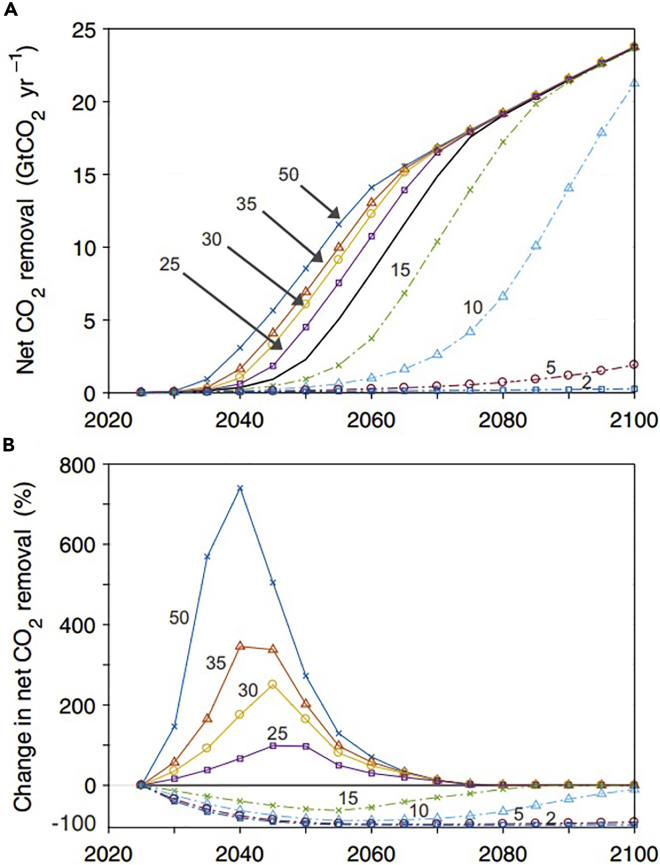
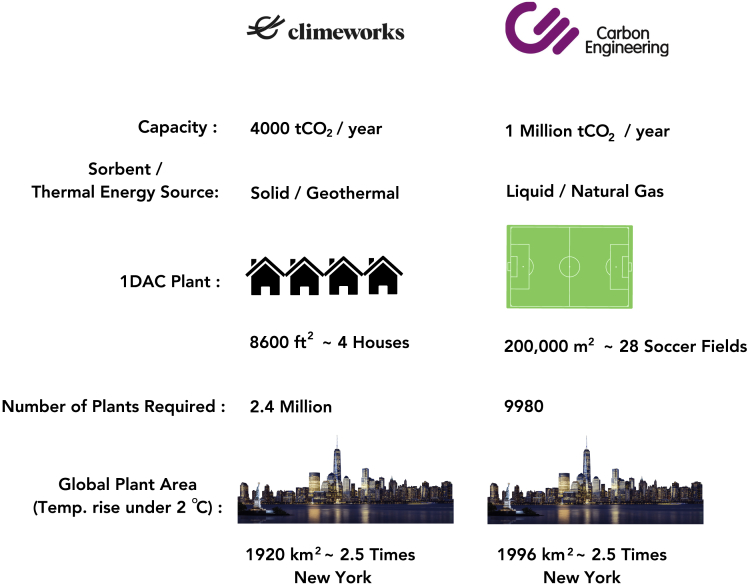
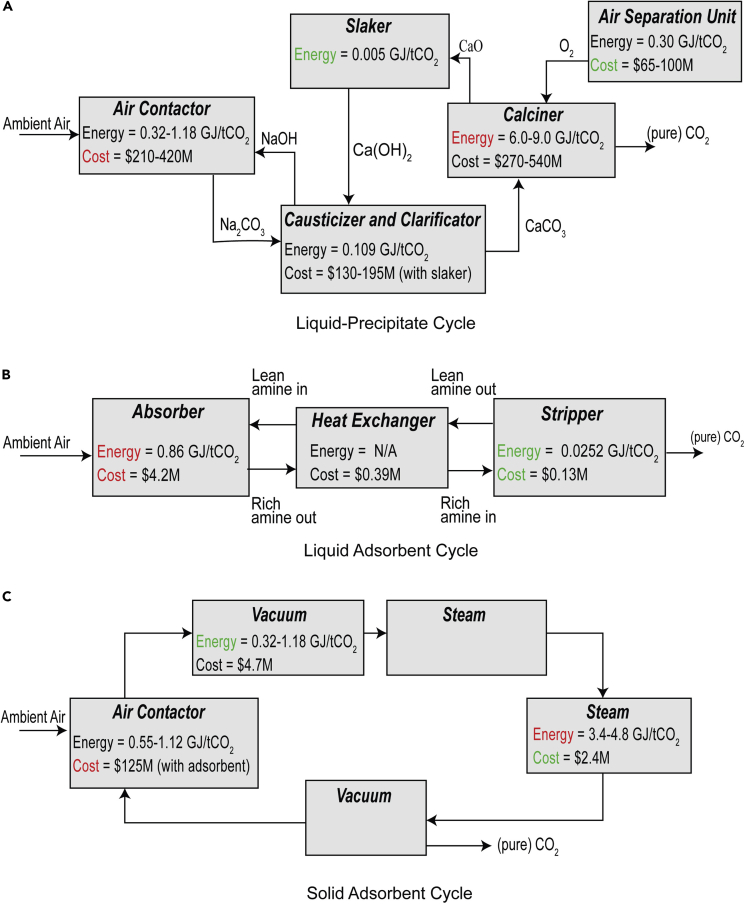
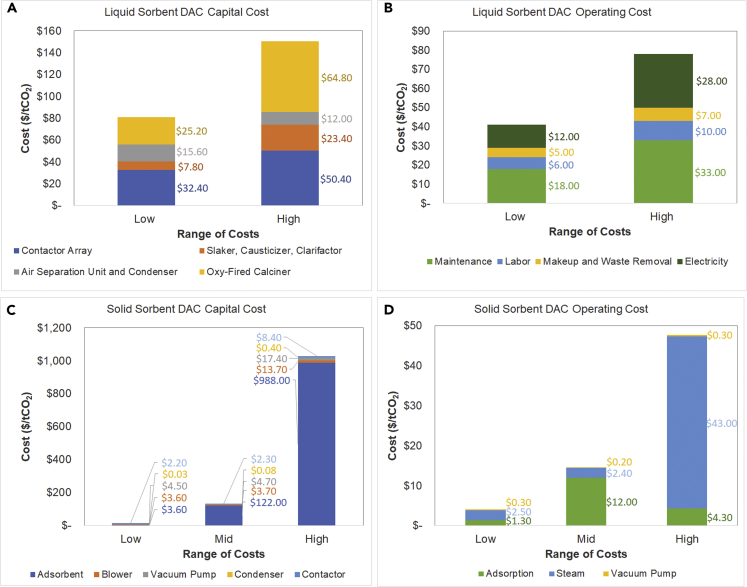
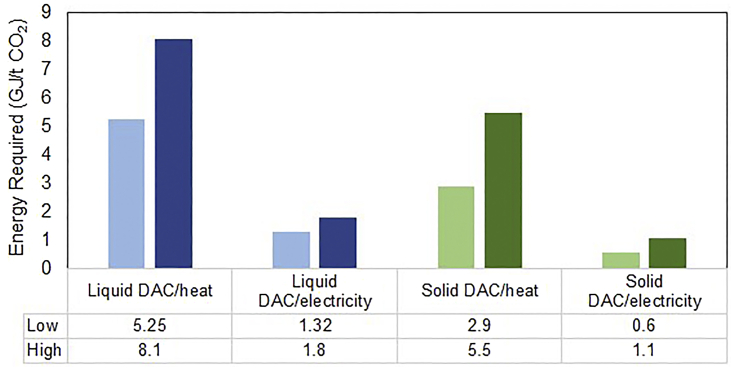
Climate change calls for adaptation of negative emission technologies such as direct air capture (DAC) of carbon dioxide (CO2) to lower the global warming impacts of greenhouse gases. Recently, elevated global interests to the DAC technologies prompted implementation of new tax credits and new policies worldwide that motivated the existing DAC companies and prompted the startup boom. There are presently 19 DAC plants operating worldwide, capturing more than 0.01 Mt CO2/year. DAC active plants capturing in average 10,000 tons of CO2 annually are still in their infancy and are expensive. DAC technologies still need to improve in three areas: 1) Contactor, 2) Sorbent, and 3) Regeneration to drive down the costs. Technology-based economic development in all three areas are required to achieve <$100/ton of CO2 which makes DAC economically viable. Current DAC cost is about 2-6 times higher than the desired cost and depends highly on the source of energy used. In this review, we present the current status of commercial DAC technologies and elucidate the five pillars of technology including capture technologies, their energy demand, final costs, environmental impacts, and political support. We explain processing steps for liquid and solid carbon capture technologies and indicate their specific energy requirements. DAC capital and operational cost based on plant power energy sources, land and water needs of DAC are discussed in detail. At 0.01 Mt CO2/year capture capacity, DAC alone faces a challenge to meet the rates of carbon capture described in the goals of the Paris Agreement with 1.5-2°C of global warming. However, DAC may partially help to offset difficult to avoid annual emissions from concrete (∼8%), transportation (∼24%), iron-steel industry (∼11%), and wildfires (∼0.8%).
Keywords: Chemical engineering; Energy sustainability; Environmental technology; Mechanical engineering.
© 2022 The Author(s).
Figures
Similar articles
-
Emerging trends in direct air capture of CO2: a review of technology options targeting net-zero emissions.RSC Adv. 2023 Feb 15;13(9):5687-5722. doi: 10.1039/d2ra07940b. eCollection 2023 Feb 14. RSC Adv. 2023. PMID: 36816069 Free PMC article. Review.
-
Direct air capture of CO2: A response to meet the global climate targets.MRS Energy Sustain. 2021;8(2):51-56. doi: 10.1557/s43581-021-00005-9. Epub 2021 Jun 5. MRS Energy Sustain. 2021. PMID: 38624600 Free PMC article.
-
The Minderoo-Monaco Commission on Plastics and Human Health.Ann Glob Health. 2023 Mar 21;89(1):23. doi: 10.5334/aogh.4056. eCollection 2023. Ann Glob Health. 2023. PMID: 36969097 Free PMC article. Review.
-
Membrane Separation Technology in Direct Air Capture.Membranes (Basel). 2024 Jan 24;14(2):30. doi: 10.3390/membranes14020030. Membranes (Basel). 2024. PMID: 38392657 Free PMC article. Review.
-
Analysis of Direct Air Capture Integrated with Wind Energy and Enhanced Oil Recovery.Environ Sci Technol. 2023 Feb 7;57(5):2084-2092. doi: 10.1021/acs.est.2c05194. Epub 2023 Jan 24. Environ Sci Technol. 2023. PMID: 36692891
Cited by
-
Glasgow to Paris-The impact of the Glasgow commitments for the Paris climate agreement.iScience. 2023 Jan 6;26(2):105933. doi: 10.1016/j.isci.2023.105933. eCollection 2023 Feb 17. iScience. 2023. PMID: 36718361 Free PMC article.
-
Energy Efficient Carbon Capture through Electrochemical pH Swing Regeneration of Amine Solution.ACS Sustain Chem Eng. 2024 Apr 30;12(19):7309-7317. doi: 10.1021/acssuschemeng.3c08430. eCollection 2024 May 13. ACS Sustain Chem Eng. 2024. PMID: 38757123 Free PMC article.
-
Direct air capture of CO2 for solar fuel production in flow.Nat Energy. 2025;10(4):448-459. doi: 10.1038/s41560-025-01714-y. Epub 2025 Feb 13. Nat Energy. 2025. PMID: 40291483 Free PMC article.
-
Lignin-Based Platform as a Potential Low-Cost Sorbent for the Direct Air Capture of CO2.ACS Environ Au. 2024 Apr 2;4(4):196-203. doi: 10.1021/acsenvironau.4c00008. eCollection 2024 Jul 17. ACS Environ Au. 2024. PMID: 39035867 Free PMC article.
-
Emerging trends in direct air capture of CO2: a review of technology options targeting net-zero emissions.RSC Adv. 2023 Feb 15;13(9):5687-5722. doi: 10.1039/d2ra07940b. eCollection 2023 Feb 14. RSC Adv. 2023. PMID: 36816069 Free PMC article. Review.
References
-
- About, 2022. Carbon capture. https://carboncapture.com/about/ (accessed 1.27.22).
-
- Affordable carbon capture with a soda on the side. Affordable carbon capture with a soda on the side [WWW Document], 2018. Grist. URL https://grist.org/article/direct-air-carbon-capture-global-thermostat/ (accessed 6.3.21).
-
- Azarabadi H., Lackner K.S. A sorbent-focused techno-economic analysis of direct air capture. Appl. Energy. 2019;250:959–975. doi: 10.1016/j.apenergy.2019.04.012. - DOI
-
- Bento N., Wilson C. Measuring the duration of formative phases for energy technologies. Environ. Innov. Soc. Transit. 2016;21:95–112. doi: 10.1016/j.eist.2016.04.004. - DOI
Publication types
LinkOut - more resources
Full Text Sources
