. 2022 Mar 2:12:828177.
doi: 10.3389/fonc.2022.828177. eCollection 2022.

Lisinopril Mitigates Radiation-Induced Mitochondrial Defects in Rat Heart and Blood Cells

Affiliations

Lisinopril Mitigates Radiation-Induced Mitochondrial Defects in Rat Heart and Blood Cells

Saryleine Ortiz de Choudens et al. Front Oncol. .

Abstract

The genetic bases and disparate responses to radiotherapy are poorly understood, especially for cardiotoxicity resulting from treatment of thoracic tumors. Preclinical animal models such as the Dahl salt-sensitive (SS) rat can serve as a surrogate model for salt-sensitive low renin hypertension, common to African Americans, where aldosterone contributes to hypertension-related alterations of peripheral vascular and renal vascular function. Brown Norway (BN) rats, in comparison, are a normotensive control group, while consomic SSBN6 with substitution of rat chromosome 6 (homologous to human chromosome 14) on an SS background manifests cardioprotection and mitochondrial preservation to SS rats after injury. In this study, 2 groups from each of the 3 rat strains had their hearts irradiated (8 Gy X 5 fractions). One irradiated group was treated with the ACE-inhibitor lisinopril, and a separate group in each strain served as nonirradiated controls. Radiation reduced cardiac end diastolic volume by 9-11% and increased thickness of the interventricular septum (11-16%) and left ventricular posterior wall (14-15%) in all 3 strains (5-10 rats/group) after 120 days. Lisinopril mitigated the increase in posterior wall thickness. Mitochondrial function was measured by the Seahorse Cell Mitochondrial Stress test in peripheral blood mononuclear cells (PBMC) at 90 days. Radiation did not alter mitochondrial respiration in PBMC from BN or SSBN6. However, maximal mitochondrial respiration and spare capacity were reduced by radiation in PBMC from SS rats (p=0.016 and 0.002 respectively, 9-10 rats/group) and this effect was mitigated by lisinopril (p=0.04 and 0.023 respectively, 9-10 rats/group). Taken together, these results indicate injury to the heart by radiation in all 3 strains of rats, although the SS rats had greater susceptibility for mitochondrial dysfunction. Lisinopril mitigated injury independent of genetic background.

Keywords: cardiotoxicity; lisinopril; mitochondrial dysfunction; rat model; thoracic radiation.


Conflict of interest statement

The authors declare that the research was conducted in the absence of any commercial or financial relationships that could be construed as a potential conflict of interest.

Figures

Figure 1
Figure 1
Image guided cardiac irradiation computed tomography images of a representative female rat with a 1.5cm diameter circular collimator plan with radiation dose to isocenter of 8 Gy × 5 fractions with equally weighted parallel opposed beams are shown in the axial (A), sagittal (B), and coronal (C) planes. Panel (D) shows the dose volume histogram and metrics demonstrating dose to the heart, left lung and right lung.
Figure 2
Figure 2
Graphical representation of values for End Diastolic Volumes (EDV) in rats at 4 time points (X-axis). The rats were measured at 4 time points: 30, 60, 90 and 120 days. The values observed are represented by symbols denoting the experimental treatment: Circle (No Radiation and No Lisinopril -R-L), Diamond (No Radiation and Lisinopril -R+L), Triangle (Radiation and No Lisinopril +R-L), or Square (Radiation and Lisinopril +R+L). The colors represent the strain: Brown-Norway (BN: black), Salt-Sensitive (SS: blue) and SS with BN chromosome 6 (SSBN6: red). The rectangles are 95% Confidence Intervals for EDV from a Repeated Measures linear model for treatment that included time, strain, and the SS by day 90 interaction. EDV were normalized to body weight and heart rate and was reduced by 9-11% in all irradiated rats at 120 days (p=0.0013) as compared to their non-irradiated counterparts.
Figure 3
Figure 3
Graphical representation of values for Ejection Fraction (EF) in rats at 4 time points (X-axis). The EFs were measured at 30, 60, 90 and 120 days. The values observed are represented by symbols denoting the experimental treatment: Circle (No Radiation and No Lisinopril -R-L), Diamond (No Radiation and Lisinopril -R+L), Triangle (Radiation and No Lisinopril +R-L), or Square (Radiation and Lisinopril +R+L). The colors represent the strain: Brown-Norway (BN: black), Salt-Sensitive (SS: blue) and SS with BN chromosome 6 (SSBN6: red). The rectangles are 95% Confidence Intervals for EF from a Repeated Measures linear model for treatment that included time and strain. EFs in SS rats were lower than those of other strains (p-value=0.002). They increase with Lisinopril (p-value=0.02) and also with radiotherapy (p-value=0.02).
Figure 4
Figure 4
Graphical representation of values for Inter-Ventricular Septum Thickness in Diastole (IVSD) in rats at 4 time points (X-axis). The rats were measured at 4 time points: 30, 60, 90 and 120 days. The values observed are represented by symbols denoting the experimental treatment: Circle (No Radiation and No Lisinopril -R-L), Diamond (No Radiation and Lisinopril -R+L), Triangle (Radiation and No Lisinopril +R-L), or Square (Radiation and Lisinopril +R+L). The colors represent the strain: Brown-Norway (BN: black), Salt-Sensitive (SS: blue) and SS with BN chromosome 6 (SSBN6: red). The rectangles are 95% Confidence Intervals for IVSD from a Repeated Measures linear model for treatment that included time, and strain. IVSD values were normalized to body weight. Radiotherapy increased IVSD by 11-16% at 120 days (p=0.0001) in all rats and lisinopril mitigated this effect by decreasing the IVSD by 12-17% (p < 0.0001).
Figure 5
Figure 5
Graphical representation of values for Left Ventricular Posterior Wall Thickness at End Diastole (LVPWD) in rats at 4 time points (X-axis). The rats were measured at 4 time points: 30, 60, 90 and 120 days. The values observed are represented by symbols denoting the experimental treatment: Circle (No Radiation and No Lisinopril -R-L), Diamond (No Radiation and Lisinopril -R+L), Triangle (Radiation and No Lisinopril +R-L), or Square (Radiation and Lisinopril +R+L). The colors represent the strain: Brown-Norway (BN: black), Salt-Sensitive (SS: blue) and SS with BN chromosome 6 (SSBN6: red). The rectangles are 95% Confidence Intervals for LVPWD from a Repeated Measures linear model for treatment that included time, strain and the SSBN6 by radiotherapy interaction. There was 14-15% increase in LVPWD in SS and BN (p<0.0001), but not SSBN6 rat hearts at 120 days, while lisinopril reduced LVPWD in all groups of irradiated rat hearts (p=0.0003).
Figure 6
Figure 6
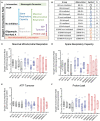
Oxygen consumption rates in peripheral blood mononuclear cells (PBMCs). (A) Schematic showing the effects of pharmacological agents on oxygen consumption by PBMCs as investigated by the Seahorse Cell Mitochondrial Stress Test (see Methods). If the respiratory chain activity is blocked with Rotenone and Antimycin A (designated as Rot+Anti A) then only non-mitochondrial oxygen consumption remains (shaded and marked in red). The difference between oxygen consumption without an inhibitor and with Rotenone and Antimycin A represents basal mitochondrial respiration (grey bar). Mitochondrial oxygen consumption that is driven by H+ flux through ATP synthase is inhibited by oligomycin. The difference between oxygen consumption without an inhibitor and in the presence of oligomycin gives the oxygen consumption coupled with ATP production (purple bar). The difference between oligomycin-inhibited respiration and non-mitochondrial oxygen consumption gives the proton (H+) leak (maroon bar). The uncoupler FCCP enhances oxygen consumption (blue bar that represents spare respiratory capacity) to yield maximal mitochondrial respiration (green bar). (B) Table showing numbers of rats in each group for graphs C-F. Oxygen consumption rates in BN (black), SS (blue) and SSBN6 (red) rats at 90 days post-irradiation. Circles = non-irradiated rats, diamonds = nonirradiated rats given lisinopril, triangles = irradiated rats, squares = irradiated rats given lisinopril. Values are expressed as pmol/minute/microgram protein. (C) Maximal mitochondrial respiration. Values were derived as the difference after treatment with the uncoupler FCCP and the non-mitochondrial oxygen consumption rate (represented by green bar in Panel A). FCCP increases the proton flow across the inner mitochondrial membrane creating a H+ short circuit to maximize oxygen consumption (p=0.020, SS irradiated rats (SS+R-L) versus SS non-irradiated rats (SS-R-L), p=0.040, SS irradiated rats (SS+R-L) versus SS non-irradiated rats treated with lisinopril (SS-R+L)). There was no difference between other groups. (D) Spare Respiratory Capacity derived as the difference between treatment with FCCP and followed by subtraction of the basal oxygen consumption rate in the absence of any inhibitor (represented by blue bar in Panel A), (p= 0.019, SS irradiated rats (SS+R-L) versus SS non-irradiated rats (SS-R-L); p=0.023, SS irradiated rats (SS+R-L) versus SS non-irradiated rats treated with lisinopril (SS-R+L)). There was no difference between other groups. (E) ATP turnover after treatment with the ATP synthase inhibitor, oligomycin, and subtraction of the basal oxygen respiration values in the absence of any inhibitor (represented by purple bar in Panel A) (p= 0.037 (t -test, not ANOVA) for SS irradiated rats (SS+R-L) versus SS non-irradiated rats (SS-R-L)). There was no difference between other groups. (F) Proton (H+) Leak derived by the difference in oligomycin and the non-mitochondrial oxygen consumption rates (represented by maroon bar in Panel (A). Oligomycin inhibits ATP synthase but not uncoupled mitochondrial oxygen consumption from proton leak (p=0.036 (t -test, not ANOVA), SS irradiated rats (SS+R-L) versus SS non-irradiated rats (SS-R-L)). There was no difference between other groups. Values in rats treated with lisinopril were not different from non-irradiated controls for all mitochondrial respiratory parameters represented in (E, F).

Similar articles

Cited by

References

    1. Surveillance Epidemiology and End Results (SEER) Program . SEER Cancer Statistics Factsheets: Common Cancer Sites. National Cancer Institute Bethesda, MD. Available at: https://seer.cancer.gov/statfacts/html/common.html.
    1. Schlaak RA, SenthilKumar G, Boerma M, Bergom C. Advances in Preclinical Research Models of Radiation-Induced Cardiac Toxicity. Cancers (Basel) (2020) 12(2):415. doi: 10.3390/cancers12020415 - DOI - PMC - PubMed
    1. Groarke JD, Nguyen PL, Nohria A, Ferrari R, Cheng S, Moslehi J. Cardiovascular Complications of Radiation Therapy for Thoracic Malignancies: The Role for Non-Invasive Imaging for Detection of Cardiovascular Disease. Eur Heart J (2014) 35(10):612–23. doi: 10.1093/eurheartj/eht114 - DOI - PMC - PubMed
    1. Livingston K, Schlaak RA, Puckett LL, Bergom C. The Role of Mitochondrial Dysfunction in Radiation-Induced Heart Disease: From Bench to Bedside. Front Cardiovasc Med (2020) 7:20. doi: 10.3389/fcvm.2020.00020 - DOI - PMC - PubMed
    1. Stewart FA. Mechanisms and Dose-Response Relationships for Radiation-Induced Cardiovascular Disease. Ann ICRP (2012) 41(3-4):72–9. doi: 10.1016/j.icrp.2012.06.031 - DOI - PubMed