. 2022 Mar 3:12:780493.
doi: 10.3389/fonc.2022.780493. eCollection 2022.

Immune Infiltration and Clinical Outcome of Super-Enhancer-Associated lncRNAs in Stomach Adenocarcinoma

Affiliations

Immune Infiltration and Clinical Outcome of Super-Enhancer-Associated lncRNAs in Stomach Adenocarcinoma

Li Peng et al. Front Oncol. .

Abstract

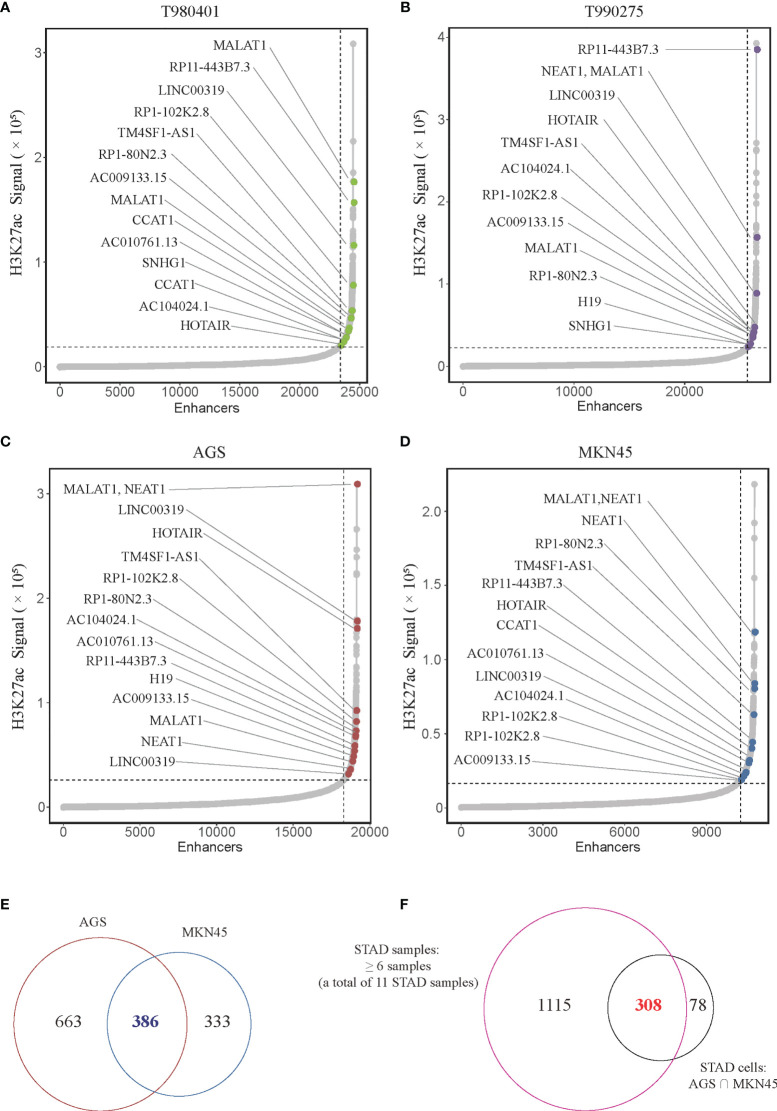
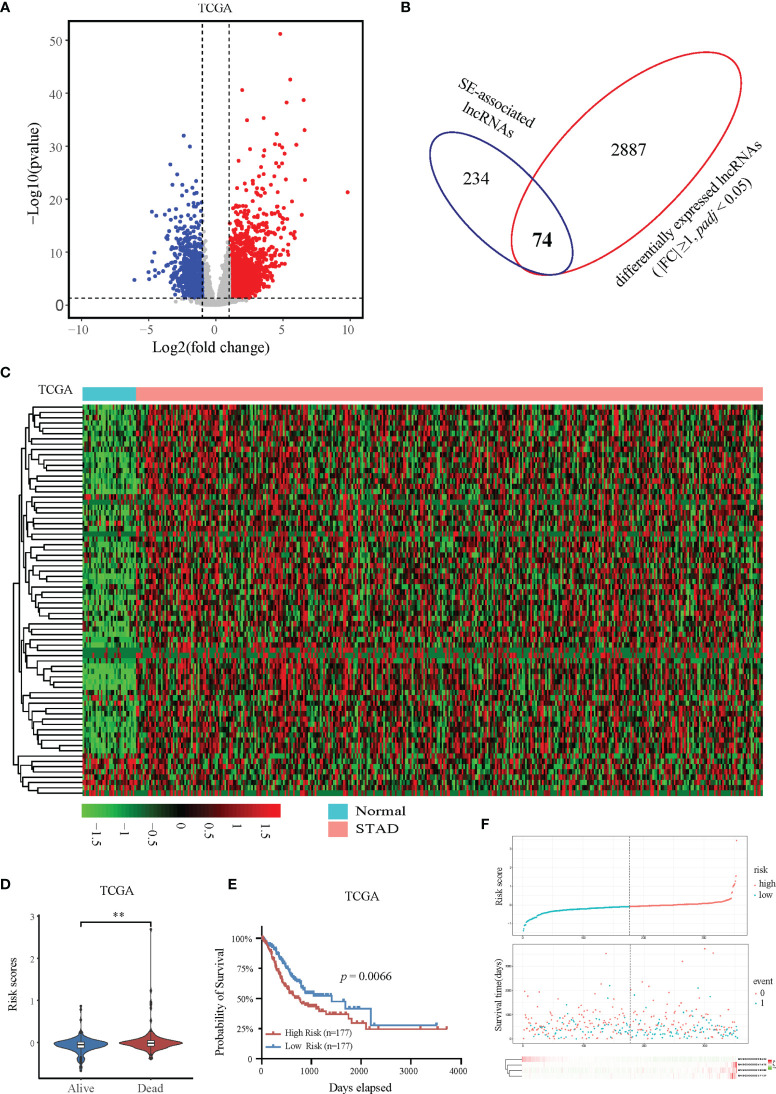
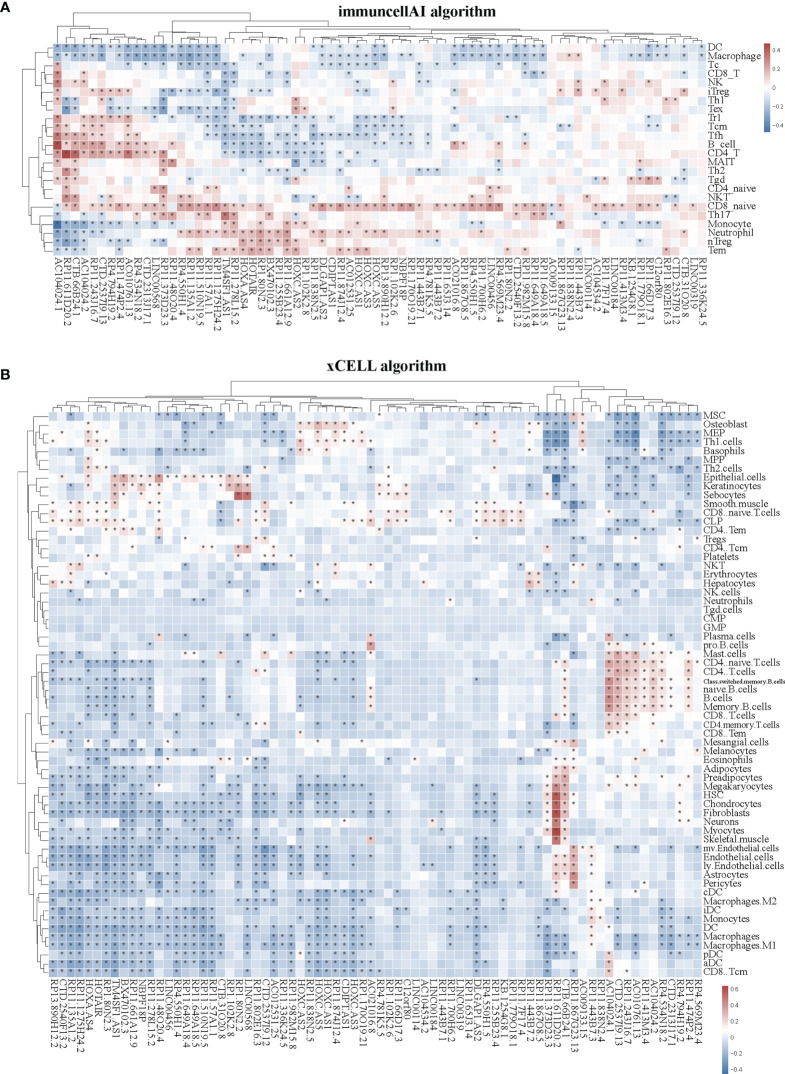
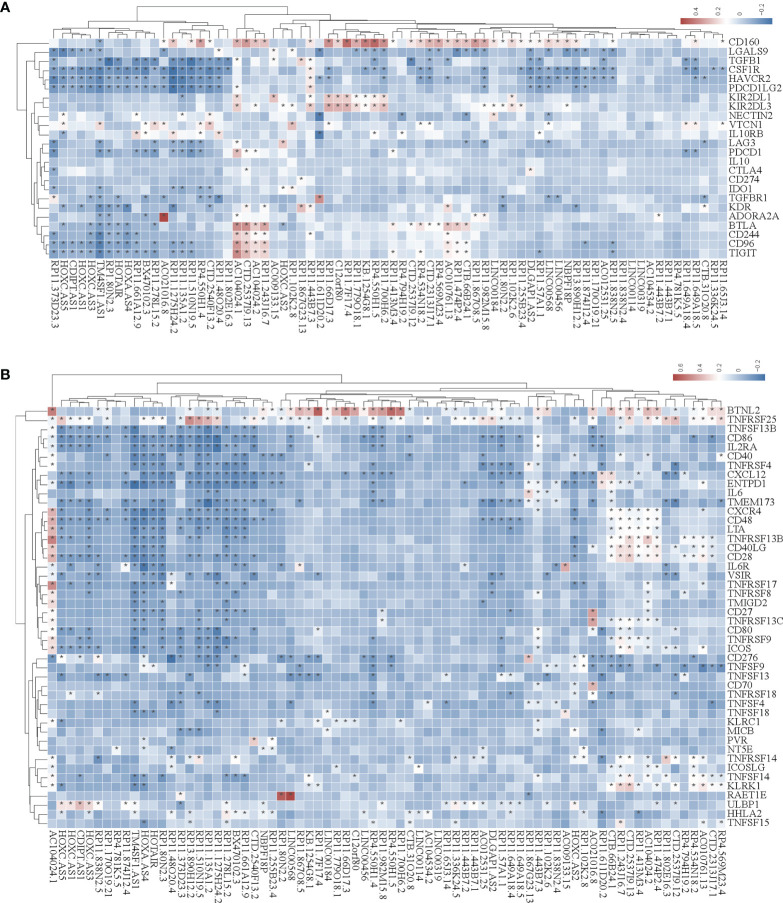
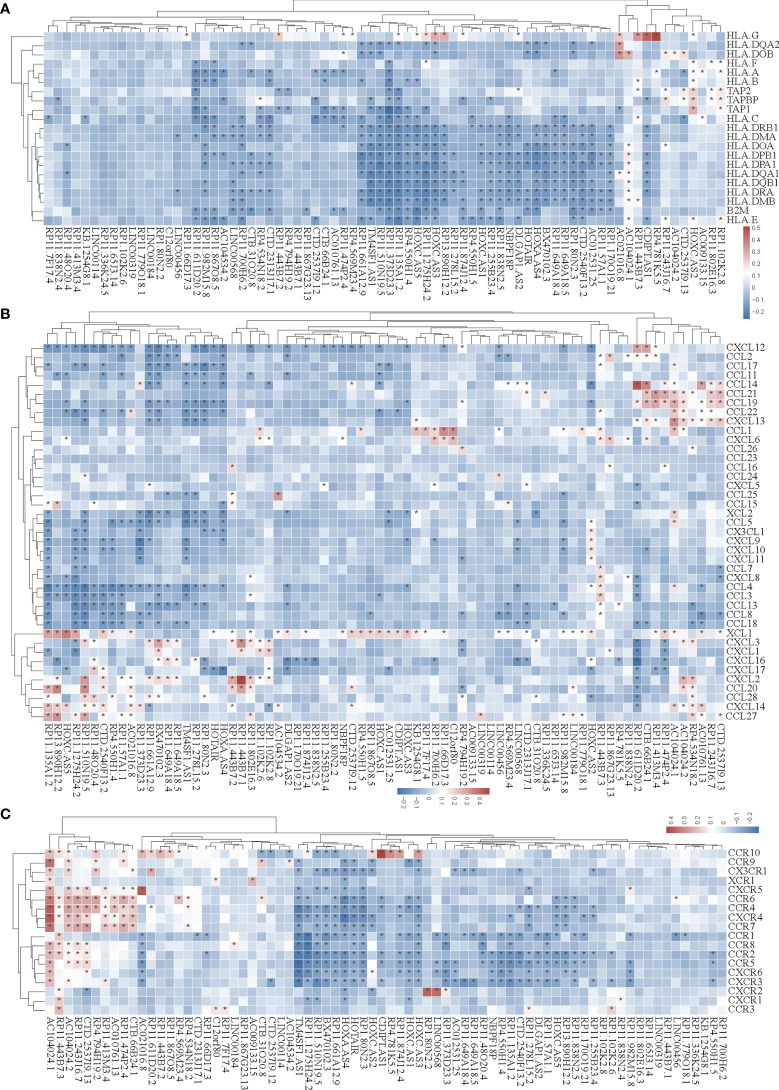
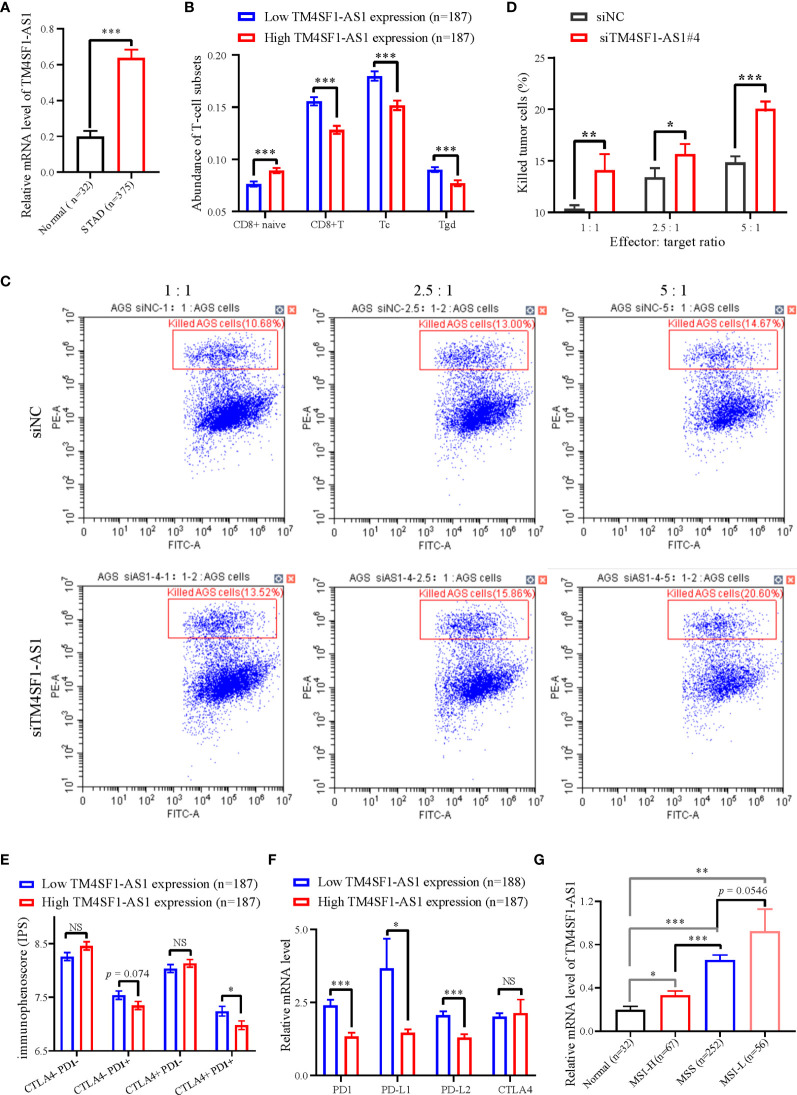
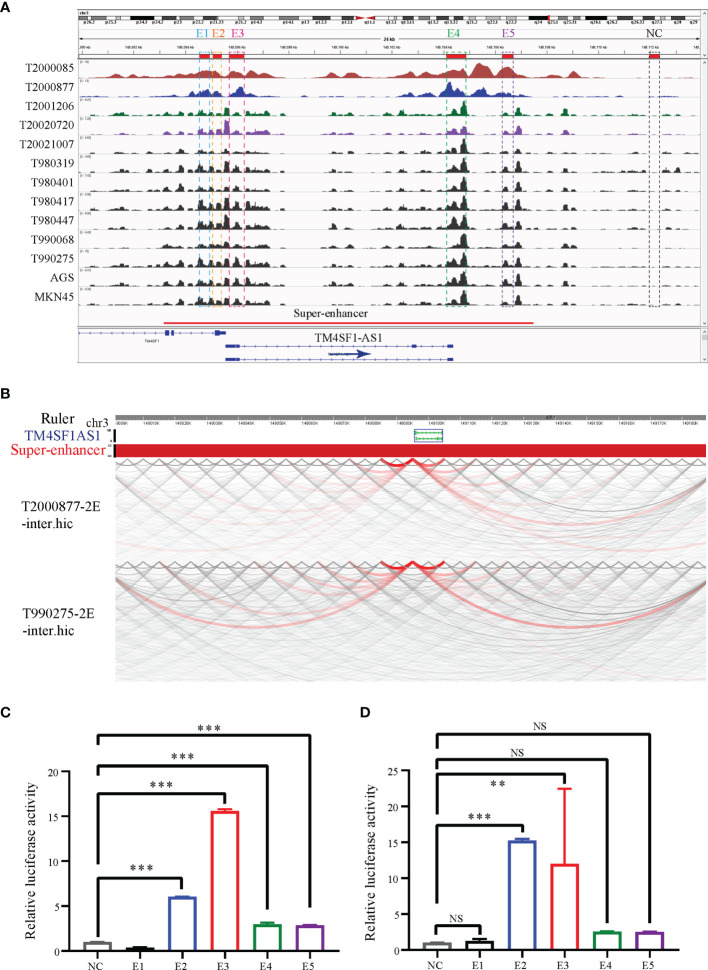
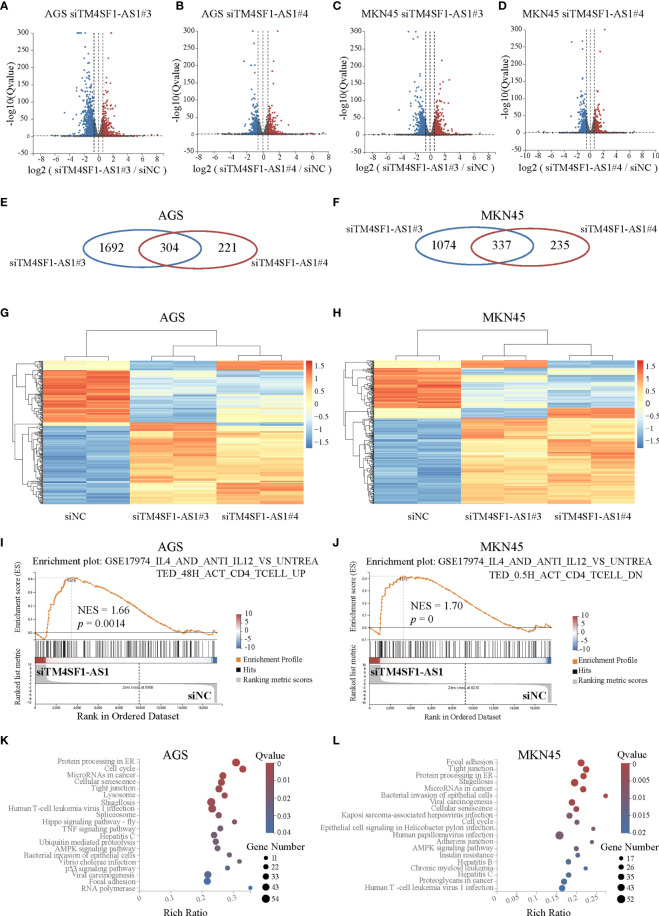
Super-enhancers (SEs) comprise large clusters of enhancers that highly enhance gene expression. Long non-coding RNAs (lncRNAs) tend to be dysregulated in cases of stomach adenocarcinoma (STAD) and are vital for balancing tumor immunity. However, whether SE-associated lncRNAs play a role in the immune infiltration of STAD remains unknown. In the present study, we identified SE-associated lncRNAs in the H3K27ac ChIP-seq datasets from 11 tumor tissues and two cell lines. We found that the significantly dysregulated SE-associated lncRNAs were strongly correlated with immune cell infiltration through the application of six algorithms (ImmuncellAI, CIBERSORT, EPIC, quantiSeq, TIMER, and xCELL), as well as immunomodulators and chemokines. We found that the expression of SE-associated lncRNA TM4SF1-AS1 was negatively correlated with the proportion of CD8+ T cells present in STAD. TM4SF1-AS1 suppresses T cell-mediated immune killing function and predicts immune response to anti-PD1 therapy. ChIP-seq, Hi-C and luciferase assay results verified that TM4SF1-AS1 was regulated by its super-enhancer. RNA-seq data showed that TM4SF1-AS1 is involved in immune and cancer-related processes or pathways. In conclusion, SE-associated lncRNAs are involved in the tumor immune microenvironment and act as indicators of clinical outcomes in STAD. This study highlights the importance of SE-associated lncRNAs in the immune regulation of STAD.

Keywords: PD1; T cell; TM4SF1-AS1; clinical outcome; immune infiltration; long non-coding RNA (IncRNA); stomach adenocarcinoma (STAD); super-enhancer (SE).


Conflict of interest statement

The authors declare that the research was conducted in the absence of any commercial or financial relationships that could be construed as a potential conflict of interest.

Figures

Figure 1
Figure 1
Super-enhancer-associated lncRNAs present in STAD samples and cells. (A–D) Hockey stick plot of SE-associated lncRNAs in two tumor samples (T980401 and T990275) and two STAD cells (AGS and MKN45). Some representations of novel and known SE-associated lncRNAs are shown in color on the curve. (E) Venn diagram showing the intersection of SE-associated lncRNAs in two STAD cells (AGS and MKN45). (F) Venn diagram displaying the intersection of the SE-associated lncRNAs shared in two STAD cells and the SE-associated lncRNAs in at least 6 of 11 STAD samples. ChIP-seq with the H3K27ac antibody in AGS cell lines was from this study, and other H3K27ac ChIP-seq in 11 STAD tissue samples and MKN45 cell lines were downloaded from GEO database (GSE117953; https://www.ncbi.nlm.nih.gov/geo/query/acc.cgi?acc=GSE117953).
Figure 2
Figure 2
Expression and prognostic analysis of super-enhancer-associated lncRNAs in patients with STAD. (A) Volcano plot showing the expression changes of SE-associated lncRNAs in STAD samples compared with normal stomach tissues. The red dots represent up-regulated lncRNAs (FC ≥ 1, Q value < 0.05), and the blue dots represent down-regulated lncRNAs in STAD patients (FC ≤ -1, Q value < 0.05). (B) Venn diagram representing the intersection of 2961 differentially expressed lncRNAs in patients with STAD and the 308 SE-associated lncRNAs identified above. (C) Expression profiling of 74 differentially expressed SE-associated lncRNAs in human STAD samples and normal stomach tissues. (D) The risk scores of alive or dead STAD patients predicted by expression of SE-associated lncRNAs from TCGA dataset. (E) The prognosis of SE-associated lncRNAs in STAD patients with high risk and low risk based on the RiskScore signature. (F) The distributions of the four lncRNAs in groups between high and low risk in STAD patients. The top was the risk score of STAD patients calculated according to the RiskScore signature and split into two groups on basis of medium score. The middle represented the survival status. The bottom heatmap showed the differential profile of four lncRNAs. The expression and clinical data of all lncRNAs were downloaded from TCGA database (https://www.cancer.gov/). **Indicates p < 0.01.
Figure 3
Figure 3
Correlation between the expression of super-enhancer-associated lncRNA and immune cell infiltration in patients with STAD. (A) Cluster analysis of the correlation between 74 SE-associated lncRNAs expression and immune cells abundance calculated by using the ImmuCellAI algorithm. (B) Cluster analysis of the correlation between 74 SE-associated lncRNAs and immune cells abundance calculated with the Xcell algorithm. Red indicates positive correlation, while blue indicates negative correlation. The asterisk (*) signifies a significant correlation p < 0.05. The expression of 74 SE-associated lncRNAs were downloaded from TCGA database (https://www.cancer.gov/). Immune cell infiltration was calculated by using the ImmuCellAI (http://bioinfo.life.hust.edu.cn/ImmuCellAI/#!/) and Xcell algorithm (https://xcell.ucsf.edu/) in STAD.
Figure 4
Figure 4
The correlation between the expression of super-enhancer-associated lncRNA and immunomodulators in STAD. (A) Cluster analysis of the expression correlation between 74 SE-associated lncRNAs and immunoinhibitor-related markers. (B) Cluster analysis of the expression correlation between 74 SE-associated lncRNA strands and Immunostimulator-related markers. Red indicates positive correlation, while blue signifies negative correlation. The asterisk (*) indicates significant correlation (p < 0.05). The list of immunomodulators including immunoinhibitory and immunostimulator was downloaded from TISIDB database (http://cis.hku.hk/TISIDB/download.php). The expression of 74 SE-associated lncRNAs and immunomodulators were downloaded from TCGA database (https://www.cancer.gov/).
Figure 5
Figure 5
Correlation analysis of the expression of super-enhancer-associated lncRNA and chemokines in STAD cells. (A) Results of cluster analysis of the expression correlation between 74 SE-associated lncRNAs and MHC molecules. (B) Cluster analysis results of the expression correlation between 74 SE-associated lncRNA and chemokines. (C) Results of the cluster analysis of the expression correlation between 74 SE-associated lncRNAs and chemokine receptors. Red signifies a positive correlation, while blue indicates negative correlation. The asterisk (*) is used to signify significant correlation (p < 0.05). The list of MHC molecules, chemokines and chemokine receptors was downloaded from TISIDB database (http://cis.hku.hk/TISIDB/download.php). The expression of 74 SE-associated lncRNAs, MHC molecules, chemokines and chemokine receptors were downloaded from TCGA database (https://www.cancer.gov/).
Figure 6
Figure 6
The expression of TM4SF1-AS1 and its role in the tumor immune microenvironment in STAD. (A) Expression changes of TM4SF1-AS1 in human STAD samples compared with normal samples. (B) The abundance of CD8+ T cell between high and low expression of TM4SF1-AS1. (B, C) Flow cytometry showing the effect of TM4SF1-AS1 knockdown on the killing activities of activated T cells in AGS cells. (C) Immunophenoscore of CTLA- PD1-, CTLA- PD1+, CTLA+ PD1- and CTLA+ PD1+ patients in the groups with high and low TM4SF1-AS1 expression, respectively. (D) Expression of PD1, PD-L1, PD-L2 and CTLA4 in the high and low TM4SF1-AS1 expression groups. (E) Expression of TM4SF1-AS1 in groups among normal tissues, MSI-H, MSS and MSI-L. (F) Expression of PD1, PD-L1, PD-L2 and CTLA4 in the high and low TM4SF1-AS1 expression groups. (G) Expression of TM4SF1-AS1 in groups among normal tissues, MSI-H, MSS and MSI-L. The expression of TM4SF1-AS1, PD1, PD-L1, PD-L2 and CTLA4 were downloaded from TCGA database (https://www.cancer.gov/). Immunophenoscore information of CTLA- PD1-, CTLA- PD1+, CTLA+ PD1- and CTLA+ PD1+ patients were downloaded from TICA database (https://tcia.at/home). NS stands for “no significance”, * refers to p < 0.05, ** indicates p < 0.01, and *** signifies p < 0.001.
Figure 7
Figure 7
TM4SF1-AS1 is driven by the super-enhancer in STAD. (A) ChIP-seq profiles of H3K27ac in 11 STAD samples and 2 STAD cells (AGS and MKN45). The super-enhancer region is divided into five enhancers, and their location information are showed. ChIP-seq with the H3K27ac antibody in AGS cell lines was from this study, and other H3K27ac ChIP-seq in 11 STAD tissue samples and MKN45 cell lines were downloaded from GEO database (GSE117953; https://www.ncbi.nlm.nih.gov/geo/query/acc.cgi?acc=GSE117953). (B) Hi-C data analysis of super-enhancer regions and promoter of TM4SF1-AS1 in two tumor samples (T980401 and T990275). Hi-C data in two tumor samples (T980401 and T990275) was downloaded from GEO database (GSE118391; https://www.ncbi.nlm.nih.gov/geo/query/acc.cgi?acc=GSE118391). (C, D) Dual luciferase experiments indicating the fluorescence intensity of all five enhancers compared with that of the NC group in (C) AGS (D) MKN45 cells. ns, no significance; **p < 0.01, ***p < 0.001.
Figure 8
Figure 8
Pathway analysis of TM4SF1-AS1 knockdown in two STAD cells. (A–D) Volcano map showing the up- and down-regulated genes after TM4SF1-AS1 knockdown in AGS and MKN45 cells with two siRNA targets (siTM4SF1-AS1#3 and siTM4SF1-AS1#4). The red dots indicate up-regulated genes, and blue dots signify down-regulated genes. (E, F) Venn diagram displaying the differentially expressed genes by the intersection of siTM4SF1-AS1#3 and siTM4SF1-AS1#3 in (E) AGS and (F) MKN45 cells. (G, H) Heatmap showing the up- and down-regulated genes after TM4SF1-AS1 knockdown in (G) AGS and (H) MKN45 cells with siTM4SF1-AS1#3 and siTM4SF1-AS1#4. The red dots indicate up-regulated genes, and blue dots signify down-regulated genes. (I, J) GSEA analysis was performed on (I) AGS and (J) MKN45 cells following TM4SF1-AS1 knockdown. (K, L) KEGG analysis was performed on the changed genes in (K) AGS and (L) MKN45 cells after TM4SF1-AS1 knockdown with siRNAs. RNA-seq data of TM4SF1-AS1 knockdown in AGS MKN45 cells was from this paper.

Similar articles

Cited by

References

    1. Sung H, Ferlay J, Siegel RL, Laversanne M, Soerjomataram I, Jemal A, et al. . Global Cancer Statistics 2020: GLOBOCAN Estimates of Incidence and Mortality Worldwide for 36 Cancers in 185 Countries. CA Cancer J Clin (2021) 71:209–49. doi: 10.3322/caac.21660 - DOI - PubMed
    1. Joshi SS, Badgwell BD. Current Treatment and Recent Progress in Gastric Cancer. CA Cancer J Clin (2021) 71:264–79. doi: 10.3322/caac.21657 - DOI - PMC - PubMed
    1. Ajani JA, Lee J, Sano T, Janjigian YY, Fan D, Song S. Gastric Adenocarcinoma. Nat Rev Dis Primers (2017) 3:17036. doi: 10.1038/nrdp.2017.36 - DOI - PubMed
    1. Nagaraja AK, Kikuchi O, Bass AJ. Genomics and Targeted Therapies in Gastroesophageal Adenocarcinoma. Cancer Discovery (2019) 9:1656–72. doi: 10.1158/2159-8290.cd-19-0487 - DOI - PMC - PubMed
    1. Whyte WA, Orlando DA, Hnisz D, Abraham BJ, Lin CY, Kagey MH, et al. . Master Transcription Factors and Mediator Establish Super-Enhancers at Key Cell Identity Genes. Cell (2013) 153:307–19. doi: 10.1016/j.cell.2013.03.035 - DOI - PMC - PubMed