. 2022 Mar 3:16:815099.
doi: 10.3389/fncom.2022.815099. eCollection 2022.

Explosive Synchronization-Based Brain Modulation Reduces Hypersensitivity in the Brain Network: A Computational Model Study

Affiliations

Explosive Synchronization-Based Brain Modulation Reduces Hypersensitivity in the Brain Network: A Computational Model Study

MinKyung Kim et al. Front Comput Neurosci. .

Abstract

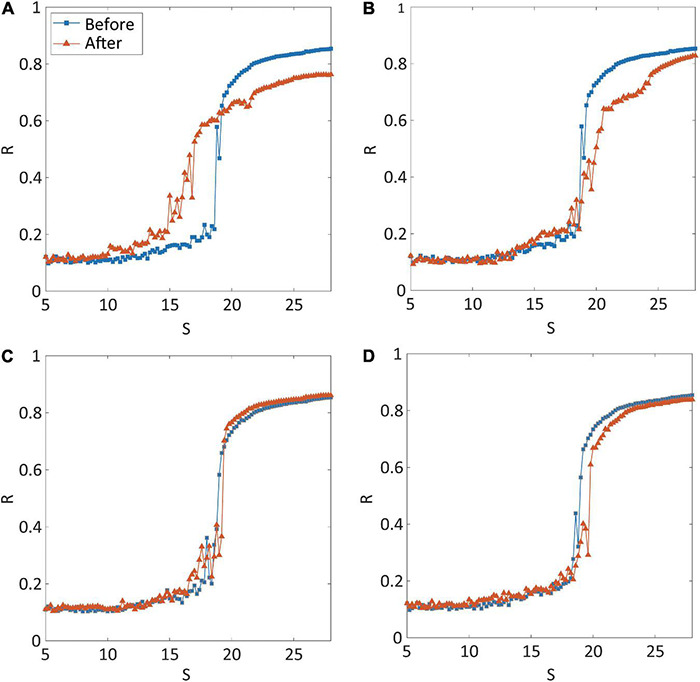
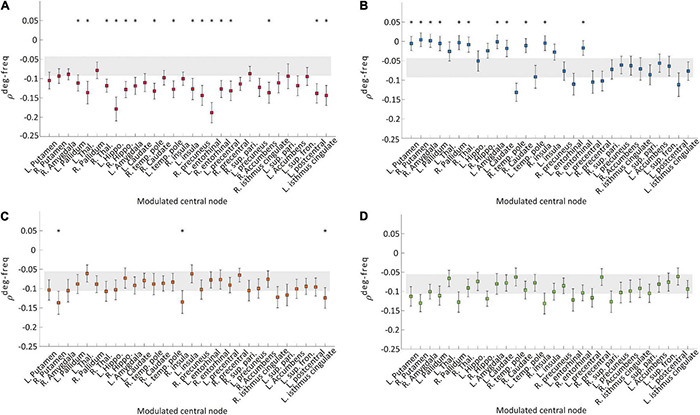
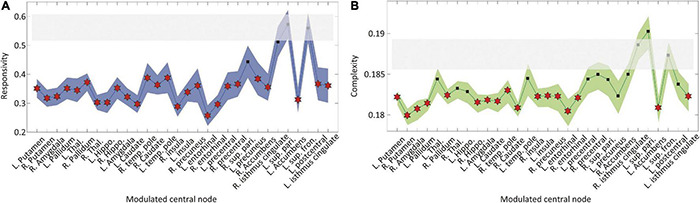
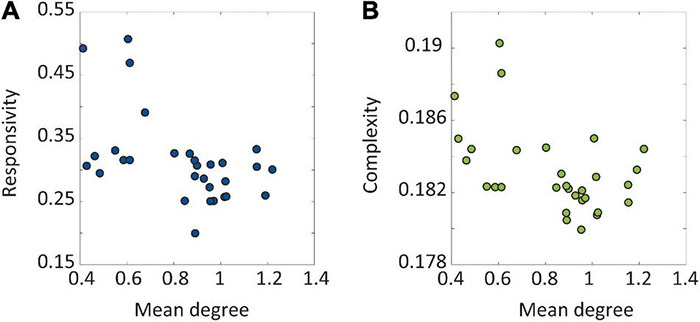
Fibromyalgia (FM) is a chronic pain condition that is characterized by hypersensitivity to multimodal sensory stimuli, widespread pain, and fatigue. We have previously proposed explosive synchronization (ES), a phenomenon wherein a small perturbation to a network can lead to an abrupt state transition, as a potential mechanism of the hypersensitive FM brain. Therefore, we hypothesized that converting a brain network from ES to general synchronization (GS) may reduce the hypersensitivity of FM brain. To find an effective brain network modulation to convert ES into GS, we constructed a large-scale brain network model near criticality (i.e., an optimally balanced state between order and disorders), which reflects brain dynamics in conscious wakefulness, and adjusted two parameters: local structural connectivity and signal randomness of target brain regions. The network sensitivity to global stimuli was compared between the brain networks before and after the modulation. We found that only increasing the local connectivity of hubs (nodes with intense connections) changes ES to GS, reducing the sensitivity, whereas other types of modulation such as decreasing local connectivity, increasing and decreasing signal randomness are not effective. This study would help to develop a network mechanism-based brain modulation method to reduce the hypersensitivity in FM.

Keywords: brain network control; brain network model; brain stimulation; chronic pain; explosive synchronization; hypersensitivity; state transition; stimulation.


Conflict of interest statement

The authors declare that the research was conducted in the absence of any commercial or financial relationships that could be construed as a potential conflict of interest.

Figures

FIGURE 1
FIGURE 1
Schematic diagram of the study design. We simulated the fibromyalgia (FM) brain network using a model with the explosive synchronization (ES) mechanism. The ES brain network model was constructed using a modified coupled Stuart–Landau oscillator on an anatomically informed human brain network structure. We found a critical state of ES brain network model by calculating autocorrelation function (ACF) to simulate the FM brain during conscious wakefulness. Four different types of network modulation (local structural connectivity increase and decrease, signal randomness increase and decrease) with thirty different target brain regions were applied to the model to investigate which modulation types and which target brain regions can convert an ES network to one of general synchronization (GS), thereby reducing the sensitivity. Then, we induced external stimuli to the brain networks at a critical state before and after the modulation, evaluated sensitivity (responsivity and complexity) of the brain network responses, and compared the sensitivity between the networks before and after the modulation.
FIGURE 2
FIGURE 2
Synchronization transition shapes of four types of network modulation: (A) local structural connectivity increase (CI); (B) connectivity decrease (CD); (C) signal randomness (bifurcation parameter) increase (RI); (D) signal randomness (bifurcation parameter) decrease (RD). For each type of modulation, thirty different brain regions were targeted and modulated, respectively. The node modulation centered around the left precuneus is shown as an example of node modulation. A blue (orange) line indicates levels of network synchronization R along with a change of the coupling strength S of the model before (after) modulation. Only CI shows relatively gradual synchronization in the network after the modulation. The abrupt transition near the critical point, which is one of the characteristics of explosive synchronization (ES), is relatively maintained for CD, RI, and RD modulation.
FIGURE 3
FIGURE 3
Correlation values between node degree and frequency ρdegfreq of the networks before and after the four types of modulation: (A) CI, (B) CD, (C) RI, and (D) RD. The gray area indicates the mean standard errors of ρdegfreq over 30 different initial conditions of brain networks before the modulation. The colored square with error bars indicates the mean standard errors of ρdegfreq over 30 different initial conditions of brain networks after the modulation. Each marker indicates the centered target node for the modulation. A target node presenting a significant change after the modulation is marked with “*” (t-test, *p < 0.05). The CI modulation induces a significant decrease of ρdegfreq for most of the target nodes. In contrast, other types of modulation induce significant changes for the much smaller number of nodes (CD and RI). The RD modulation shows no change for all nodes.
FIGURE 4
FIGURE 4
Changes in brain network responsivity and complexity after the I modulation. The (A) responsivity and (B) complexity of the brain networks before and after the CI modulation are presented. The gray area covers 25–75% values of network responsivity (sensitivity) before the CI modulation over different initial conditions. The blue (green) colored area covers 25–75% values of network responsivity (complexity) after modulation over different initial conditions. A target node presenting significantly different responsivity (complexity) is marked as “⋆” (t-test, *p < 0.01). The CI modulation to the right and left insula, right precuneus, and left isthmus cingulate cortex results in decreased responsivity and complexity in the brain network.
FIGURE 5
FIGURE 5
The relationship between the node degree of target brain regions and the sensitivity after the CI modulation. The sensitivity was evaluated by responsivity and complexity. The relationships between the node degree of target brain regions and the (A) responsivity and (B) complexity are presented. The Spearman’s correlation coefficient between the network responsivity (complexity) and the average degree of target nodes is -0.52 (-0.43). The CI modulation to larger degree nodes (i.e., hubs) induces more decrease in the brain network sensitivity.

References

    1. Beggs J. M. (2008). The criticality hypothesis: how local cortical networks might optimize information processing. Philos. Transact. R. Soc. Math. Phys. Eng. Sci. 366 329–343. 10.1098/rsta.2007.2092 - DOI - PubMed
    1. Beggs J. M., Plenz D. (2003). Neuronal avalanches in neocortical circuits. J. Neurosci. 23 11167–11177. 10.1523/JNEUROSCI.23-35-11167.2003 - DOI - PMC - PubMed
    1. Bertotti G., Mayergoyz I. D. (2006). The Science of Hysteresis. Cambridge, MA: Academic Press.
    1. Boccaletti S., Almendral J. A., Guan S., Leyva I., Liu Z., Sendiña-Nadal I., et al. (2016). Explosive transitions in complex networks’ structure and dynamics: percolation and synchronization. Phys. Rep. 660 1–94. 10.1016/j.physrep.2016.10.004 - DOI
    1. Buldú J. M., Porter M. A. (2018). Frequency-based brain networks: from a multiplex framework to a full multilayer description. Netw. Neurosci. 2 418–441. 10.1162/netn_a_00033 - DOI - PMC - PubMed

LinkOut - more resources