. 2022 Dec;18(12):2894-2912.
doi: 10.1080/15548627.2022.2054039. Epub 2022 Apr 3.

Carbon starvation, senescence and specific mitochondrial stresses, but not nitrogen starvation and general stresses, are major triggers for mitophagy in Arabidopsis

Affiliations

Carbon starvation, senescence and specific mitochondrial stresses, but not nitrogen starvation and general stresses, are major triggers for mitophagy in Arabidopsis

Sylwia M Kacprzak et al. Autophagy. 2022 Dec.

Abstract

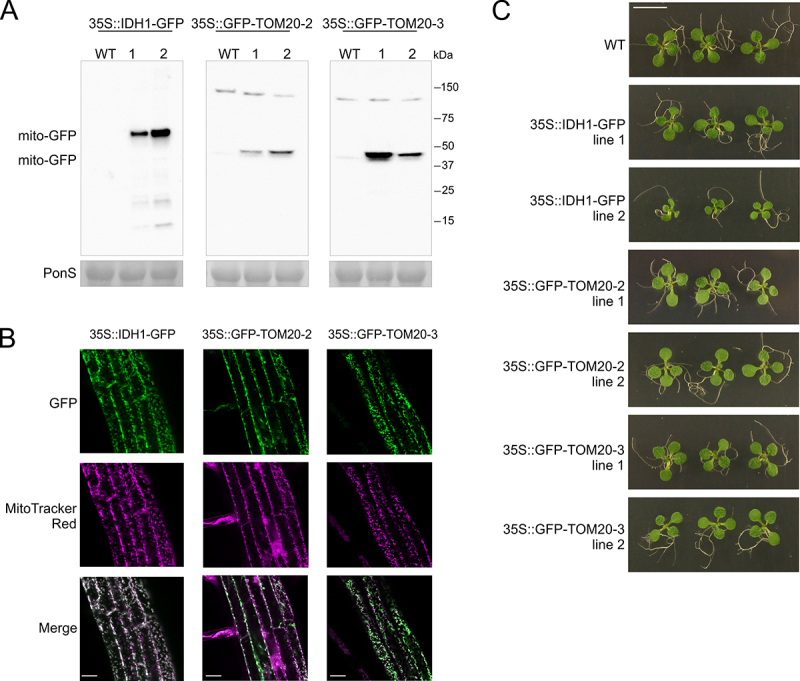
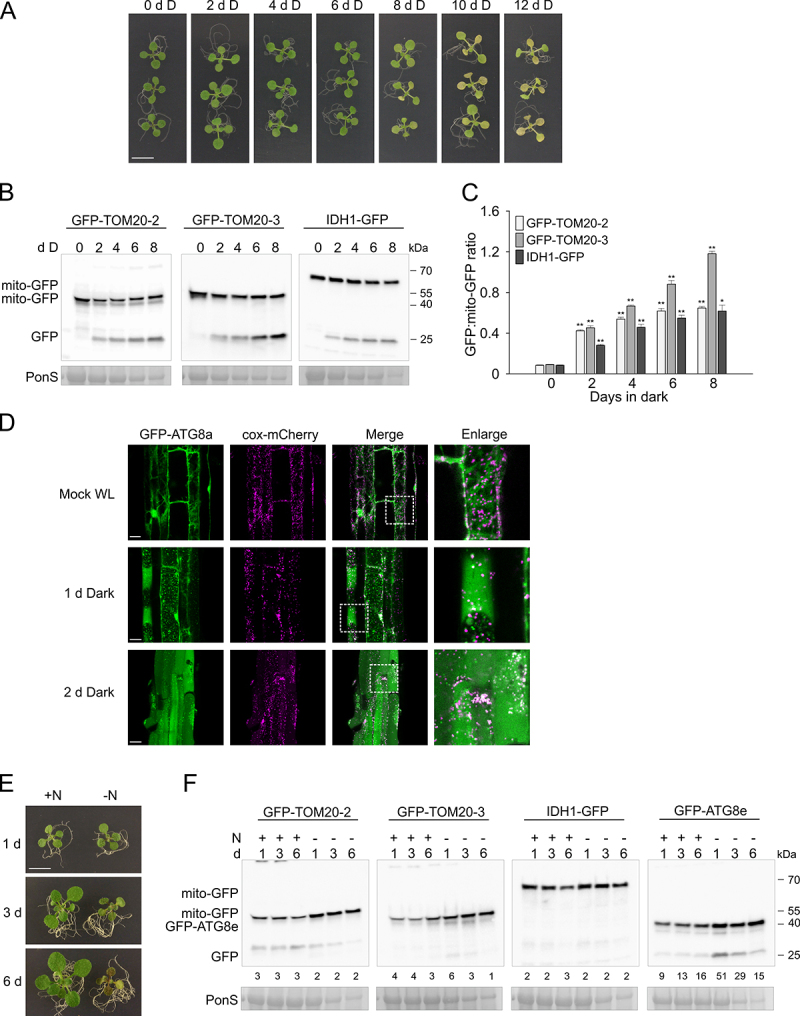
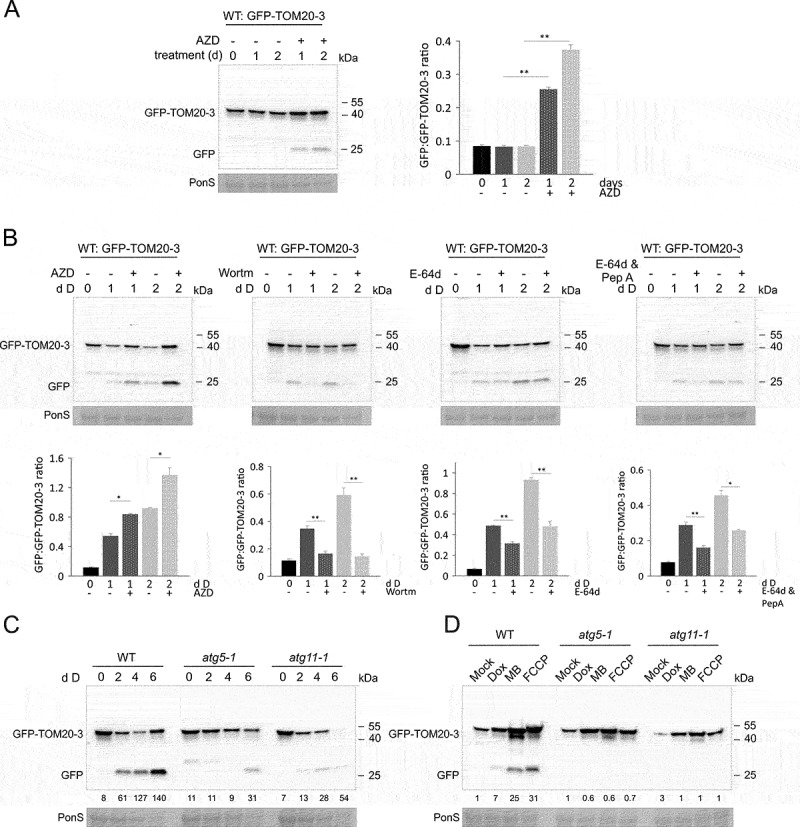
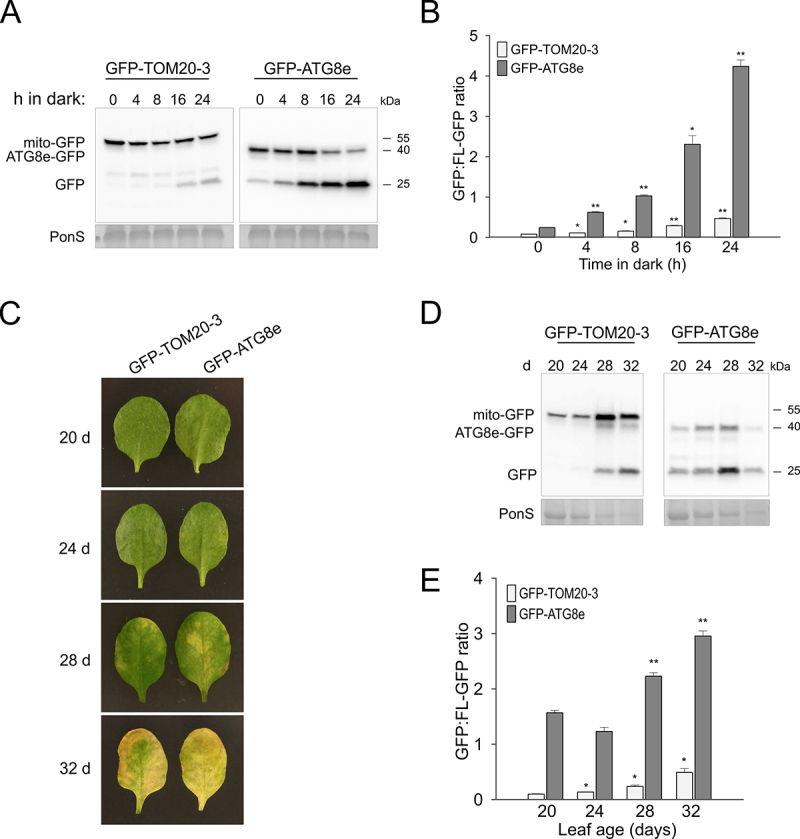
Selective degradation of mitochondria by autophagy (mitophagy) is thought to play an important role in mitochondrial quality control, but our understanding of which conditions induce mitophagy in plants is limited. Here, we developed novel reporter lines to monitor mitophagy in plants and surveyed the rate of mitophagy under a wide range of stresses and developmental conditions. Especially carbon starvation induced by dark-incubation causes a dramatic increase in mitophagy within a few hours, further increasing as dark-induced senescence progresses. Natural senescence was also a strong trigger of mitophagy, peaking when leaf yellowing became prominent. In contrast, nitrogen starvation, a trigger of general autophagy, does not induce strong increases in mitophagy. Similarly, general stresses such as hydrogen peroxide, heat, UV-B and hypoxia did not appear to trigger substantial mitophagy in plants. Additionally, we exposed plants to inhibitors of the mitochondrial electron transport chain, mitochondrial translation and protein import. Although short-term treatments did not induce high mitophagy rates, longer term exposures to uncoupling agent and inhibitors of mitochondrial protein import/translation could clearly increase mitophagic flux. These findings could further be confirmed using confocal microscopy. To validate that mitophagy is mediated by the autophagy pathway, we showed that mitophagic flux is abolished or strongly decreased in atg5/AuTophaGy 5 and atg11 mutants, respectively. Finally, we observed high rates of mitophagy in etiolated seedlings, which remarkably was completely repressed within 6 h after light exposure. In conclusion, we propose that dark-induced carbon starvation, natural senescence and specific mitochondrial stresses are key triggers of mitophagy in plants.Abbreviations: AA: antimycin A; ATG: AuToPhagy related; ConA: concanamycin A; DIS: dark-induced senescence; Dox: doxycycline; FCCP: carbonyl cyanide-p-trifluoromethoxyphenylhydrazone; GFP: green fluorescent protein; IDH1: isocitrate dehydrogenase 1; MB: MitoBlock-6; Mito-GFP: transgenic Arabidopsis line expressing a mitochondrially targeted protein fused to GFP; mtETC: mitochondrial electron transport chain; OXPHOS: oxidative phosphorylation; PQC: protein quality control; TOM20: Translocase of Outer Membrane 20.

Keywords: Arabidopsis; autophagy; mitochondria; mitophagy; plants; senescence.


Conflict of interest statement

No conflicts of interested are reported for this work.

Figures

Figure 1.
Figure 1.
Generation of stable Arabidopsis transgenic lines for measuring mitophagy in plants. IDH1, TOM20-2 and TOM20-3 were expressed under the control of the 35S promoter as a fusion with the GFP fluorescent protein, in the wild type (WT) Col-0 line. (A) Western blot analysis of GFP-fusion proteins IDH1-GFP, GFP-TOM20-2 and GFP-TOM20-3 in 35S::IDH1-GFP, 35S::GFP-TOM20-2 and 35S::GFP-TOM20-3 transgenic lines. All lines, including control WT (Col-0), were grown for 10 days on 1/2 MS agar medium with 1% sucrose. Equal loading is indicated by Ponceau S-stained Rubisco large subunit (RBCL)(PonS, bottom panel). (B) Confirmation of mitochondrial localization of fusion proteins in the root cells of 7-d-old Arabidopsis seedlings. IDH1-GFP, GFP-TOM20-2 and GFP-TOM20-3 fluorescence signals were visualized by fluorescence confocal microscopy. GFP (green) fluorescence was recorded alongside the mitochondrial marker MitoTracker Red (magenta). Overlay of both fluorescence channels is shown in the merged image. Scale bars: 20 µm. (C) Representative phenotype of 10-d-old Arabidopsis seedlings of two independent homozygous lines (line 1, 2) grown together with the WT (Col-0) control on 1/2 MS agar medium supplemented with 1% sucrose. Scale bar: 7 mm.
Figure 2.
Figure 2.
Dark induced carbon starvation, but not N starvation, induces mitophagy in Arabidopsis. (A) Representative images for the WT (Col-0) de-greening phenotypes under carbon starvation (dark-induced senescence). 10-d-old Arabidopsis seedlings grown on 1/2 MS agar medium, without sucrose under 16/8 h photoperiodic light conditions were transferred to constant darkness for 2–12 days. Scale bar: 7 mm. (B) Immunoblot detection of GFP cleavage in three “mito-GFP” transgenic lines at indicated time points (days) during carbon starvation treatment using anti-GFP antibody. “Mito-GFP” indicates the full length GFP fusion proteins, “GFP” indicates the free GFP moiety. RBCL stained with Ponceau S was used as a loading control (PonS, bottom panels). (C) Bar charts illustrating ratios of free GFP to full-length “mito-GFP” in (B). Bars shown are the means (± SE) of three biological replicates (Student’s t-test; *p < 0.05, **p < 0.01). Asterisks denote a significant difference versus respective mitochondrial-GFP line before transferring to darkness (0 days in dark). (D) Colocalization of mitochondria with GFP-ATG8a autophagosomes in root cells of the Arabidopsis transgenic line expressing 35S::GFP-ATG8a and 35S::cox-mCherry analyzed by fluorescence confocal microscopy. Autophagosome formation in the dark was induced by transferring 7-d-old seedlings grown vertically to liquid 1/2 MS supplemented with 0.5 μM concanamycin A (ConA) and incubation for 24 h in the dark (1 d Dark), or transferring seedlings from agar medium into darkness for 48 h in liquid 1/2 MS, with 0.5 μM ConA added for the last 1 6 h before imaging (2 d Dark). Scale bars: 20 µm. (E) Example images for WT (Col-0) phenotypes under N starvation. 10-d-old Arabidopsis seedlings grown on 1/2 MS medium, supplemented with 1% sucrose were transferred to the 1/2 MS medium without N source (Merck; M0529) and left to continue growth under the standard 16/8 h photoperiodic light conditions for 1–6 days. Scale bar: 7 mm. (F) Representative western blot images of IDH1-GFP, GFP-TOM20-2, GFP-TOM20-3 and GFP-ATG8e fusion proteins, or free GFP detection, using anti-GFP antibody at indicated time points after N starvation treatment. Numerical values represent relative intensity ratios (%) of free GFP to GFP-mito or GFP-ATG8e. RBCL from total protein lysates stained with Ponceau S was used as a loading control (PonS, bottom panels).
Figure 3.
Figure 3.
Mitophagy is not induced by various general stresses. IDH1-GFP, GFP-TOM20-3, GFP-ATG8e fusion proteins, and free GFP were detected by immunoblotting using an anti-GFP antibody, after UV-B stress (A), hydrogen peroxide (H2O2) treatment (B), heat stress recovery (C) or hypoxia (D). For each representative blot, Ponceau S-stained RBCL from total protein lysates was included as loading control (PonS, bottom panels). (A-B) 10-d-old seedlings grown on 1/2 MS medium with 1% sucrose were exposed to 10,000 mJ cm−2 UV-B (A) or sprayed with 100 mM H2O2 (B) and returned to standard growth conditions. Plant photographs at the top panels, show representative seedlings 8–48 h after the stress treatments. Scale bars: 7 mm. (C) Top panel indicates schematic representation of temperature regimes applied to study heat stress (HS). 7-d-old seedlings were exposed to mild HS at 37°C, returned to optimal temperature at 22°C for recovery followed by high HS at 44°C. Seedlings were additionally returned to standard growth conditions for 1–3 days for the prolonged HS recovery phase. (D) Top panel shows schematic representation of the multi-well plate experimental set up, applied to probe hypoxia stress. Whole leaves of 5-week-old plants were gently immersed in 24-well plates filled with assay medium, vacuum-treated in a desiccator for 3 min to remove residual air from intracellular tissue spaces, and sealed with transparent film to block O2. Control samples were treated the same, except plates were left unsealed throughout 24 h of incubation. Relative intensity ratios (% of free GFP:GFP-mito or GFP-ATG8e) for all abiotic stresses are shown as numeric values below blots.
Figure 4.
Figure 4.
FCCP and MB mitochondrial stress treatments efficiently induce mitophagy and general autophagy in Arabidopsis. (A-C) Immunoblot detection of GFP cleavage in 10-d-old three “mito-GFP” lines, or GFP-ATG8e line at indicated time points after spray with 50 μM antimycin A (AA), 25 μg/ml doxycycline (Dox), 50 μM MitoBloCK-6 (MB), or 20 μM carbonyl cyanide-4 (trifluoromethoxy) phenylhydrazone (FCCP), using anti-GFP antibody. Numerical values represent relative intensity ratios (%) of free GFP to GFP-mito (A-B), or GFP to GFP-ATG8e (C). RBCL stained with Ponceau S served as an equal loading control (PonS, bottom panels). (D) Representative images of phenotypes of GFP-TOM20-3 line after exposure to mitochondrial inhibitor stresses for prolonged time. 10-d-old seedlings were germinated on 1/2 MS medium supplemented with 1% sucrose, followed by transfer to fresh growth media supplemented with 30 μM AA, 15 μg/ml Dox, 10 μM MB, or 10 μM FCCP. Seedlings were grown on mito inhibitors under the same light conditions for additional 2–6 days. Scale bar: 5 mm. (E) Immunoblot detection of fusion proteins: GFP-TOM20-3 (top panel), GFP-ATG8e (bottom panel), and free GFP, using anti-GFP antibody at indicated time points after transfer to various mitochondrial inhibitors as shown in (D). Relative intensity ratios (% of free GFP:GFP-mito or GFP-ATG8e) are shown as numerical values. Equal total protein loading is indicated by Ponceau S-stained RBCL (PonS) (bottom panels). (F) Confocal fluorescence microscopy-based detection of GFP-ATG8e autophagosome formation in cells of abaxial cotyledon epidermis upon longer exposure to mitochondrial protein import inhibitor (MB) or mitochondrial uncoupler (FCCP). 7-d-old seedlings were transferred to fresh agar medium, supplemented with, or without (Mock), 10 μM MB, or 10 μM FCCP in 24-well plate wells and left to growth for an additional 3 days. 24 h before imaging, plants were incubated under constant white light with additional 300 μL of liquid 1/2 MS with 1 μM ConA, added to each well to allow autophagosome visualization. Scale bars: 10 μm.
Figure 5.
Figure 5.
Mitophagy induced during carbon starvation or growth on mitochondria inhibitors is blocked in autophagy mutants, or by chemical autophagy inhibitors. (A) GFP cleavage assay for mitophagy induction by TOR chemical inhibition. 7-d-old GFP-TOM20-3 seedlings grown vertically were transferred to liquid 1/2 MS media, supplemented with 10 μM AZD8055 (AZD) or DMSO and left under Standard light growth conditions for 1 to 2 days. Immunoblot detection of GFP-TOM20-3 and free GFP was performed with anti-GFP antibody. Bar chart on the right represents means (± SE) for free GFP to GFP-TOM20-3 ratios from three independent experiments (Student’s t-test; **p < 0.01). (B) Top panel: Immunoblot detection of GFP cleavage of dark treaded WT seedlings expressing GFP-TOM20-3 using anti-GFP antibody. Total protein extracts were prepared from 7-d-old vertically grown seedlings, incubated for 1–2 additional days in the dark in liquid 1/2 MS media, supplemented with or without 10 μM AZD8055 (AZD), or 5 μM wortmannin (Wortm), or 20 μM E-64d with or without additional supplementation with pepstatin A (PepA). Bottom panel: bar charts illustrating ratios of free GFP to GFP-TOM20-3 from the immunoblots in the top panel. Bars shown are the means (± SE) of three biological replicates (Student’s t-test; *p < 0.05, **p < 0.01). Asterisks denote a significant difference versus seedlings incubated in the dark, without various inhibitors. (C) GFP cleavage assay for carbon starvation (dark-induced senescence) in WT, atg5-1 and atg11-1 seedlings expressing mitochondrial fusion protein GFP-TOM20-3. 10-d-old seedlings grown on 1/2 MS agar medium without sucrose (pH 5.7) were transferred to constant darkness for 2–6 days. Full-length fusion protein and free GFP were detected by immunoblot using anti-GFP antibody. Control Ponceau S stain of RBCL was used to visualize changes in total protein content from lysates upon dark treatment (PonS, bottom panel). (D) GFP cleavage assay of WT, atg5-1 and atg11-1 GFP-TOM20-3 seedlings exposed to mitochondrial chemical inhibitors: Dox, MB and FCCP, for 4 days, using the same experimental system as described in Figure 5D. Presence of the full-length fusion protein and free GFP was confirmed by immunoblot detection with anti-GFP antibody. Ponceau S stained RBCL (PonS) from total protein lysates, was used as a loading control. Relative intensity ratios (% of free GFP:GFP-TOM20-3) on carbon starvation (C) or mitochondrial inhibitors (D) are shown as numeric values.
Figure 6.
Figure 6.
Mitophagy is induced during short exposure to darkness, as well during natural senescence. (A) Immunoblot detection of GFP cleavage in WT GFP-TOM20-3 and GFP-ATG8e transgenic lines at indicated early time points during carbon starvation treatment, using anti-GFP antibody. 10-d-old seedlings grown on 1/2 MS agar medium under the 16/8 h photoperiodic light conditions were transferred to constant darkness for up to 24 h. Total protein levels of the lysate are indicated by Ponceau S stained RBCL (PonS; bottom panel). (B) Bar charts illustrating ratios of free GFP to GFP-TOM20-3 or GFP-ATG8e in (A). Bars shown are the means (± SE) of three biological replicates (Student’s t-test; *p < 0.05, **p < 0.01). Asterisks denote a significant difference versus respective GFP fusion line under control light conditions (0 h in dark). (C) Representative photographs of the 4-th rosette leaf of GFP-TOM20-3 and GFP-ATG8e transgenic lines, grown in the soil under the 16/8 h photoperiodic light conditions for indicated time. (D) Immunoblot detection of GFP cleavage in WT GFP-TOM20-3 and GFP-ATG8e transgenic lines at different age stage during natural senescence (as defined in C), using anti-GFP antibody. Changes in the total protein content from protein lysates were indicated by Ponceau S stain (PonS; bottom panel). (E) Bar charts illustrating ratios of free GFP to GFP-TOM20-3 or GFP-ATG8e in (D). Asterisks denote a significant difference versus respective line from the earliest time point (20-d-old leaf) (Student’s t-test; *p < 0.05, **p < 0.01).
Figure 7.
Figure 7.
General autophagy and mitophagy are induced in etiolated seedlings in prolonged darkness, but decline rapidly after transition to white light. (A-B) GFP cleavage assay in dark etiolated (A), or de-etiolated (B) GFP-TOM20-3 and GFP-ATG8e seedlings. full-length fusion proteins, and free GFP were detected by immunoblot using anti-GFP antibody. total protein content in cell lysates is indicated by Ponceau S stains (PonS). (A) Top panel indicates schematic representation of etiolation growth assay. seedlings were sown on 1/2 MS medium, exposed to white light (WL) for 2 h to induce germination, followed by a 4- up to 8 days of growth in continuous darkness. (B) Top panel shows schematic representation of de-etiolation assay, where seedlings were grown on 1/2 MS medium for 5 days in the dark and transferred to WL for 6, 8 and 12 h. numerical values represent relative intensity ratios (%) of free GFP to GFP-TOM20-3 or GFP-ATG8e (A-B). (C) Fluorescence confocal microscopy analysis of colocalization of mitochondria with GFP-ATG8a autophagosomes in hypocotyl cells of etiolated transgenic line expressing 35S::GFP-ATG8a and 35S::cox-mCherry. 24 h before imaging, seedlings were incubated in the liquid 1/2 MS media supplemented with 0.5 μM concanamycin A (ConA) under constant WL (left panel) or in the dark (right panel) to allow autophagosome visualization. overlay of three fluorescence channels is shown in the merged images. white arrows indicate individual mitochondria colocalizing with fluorescence signals from the round shaped GFP-ATG8a structures. scale bars: 10 µm.

Similar articles

Cited by

References

    1. Spinelli JB, Haigis MC.. The multifaceted contributions of mitochondria to cellular metabolism. Nat Cell Biol. 2018;20(7):745–754. - PMC - PubMed
    1. Topf U, Wrobel L, Chacinska A. Chatty mitochondria: keeping balance in cellular protein homeostasis. Trends Cell Biol. 2016;26(8):577–586. - PubMed
    1. Murphy MP. How mitochondria produce reactive oxygen species. Biochem J. 2009;417(1):1–13. - PMC - PubMed
    1. Huang S, Van Aken O, Schwarzländer M, et al. The roles of mitochondrial reactive oxygen species in cellular signaling and stress response in plants. Plant Physiol. 2016;171(3):1551–1559. - PMC - PubMed
    1. Ashrafi G, Schwarz TL. The pathways of mitophagy for quality control and clearance of mitochondria. Cell Death Differ. 2013;20(1):31–42. - PMC - PubMed

Publication types