

Liraglutide attenuates hepatic iron levels and ferroptosis in db/db mice
- PMID: 35311455
- PMCID: PMC9161873
- DOI: 10.1080/21655979.2022.2051858
Liraglutide attenuates hepatic iron levels and ferroptosis in db/db mice
Abstract
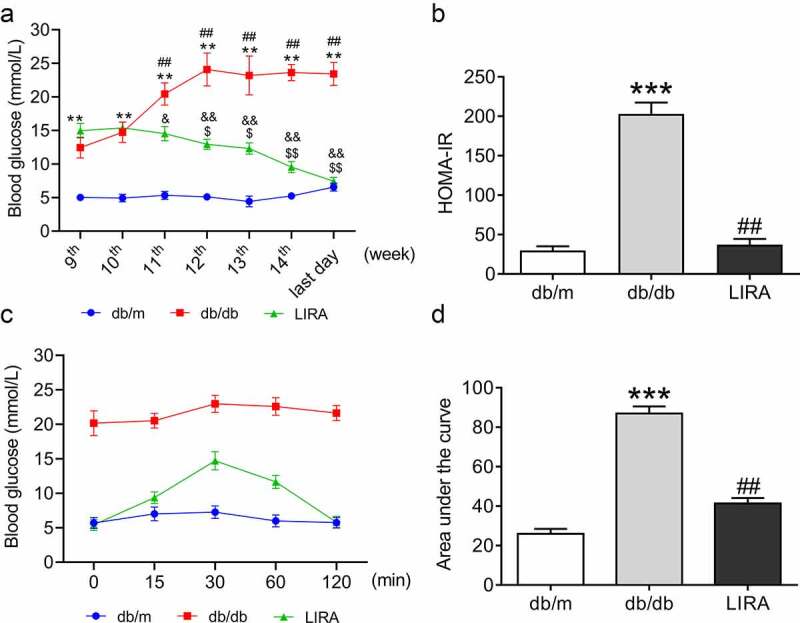
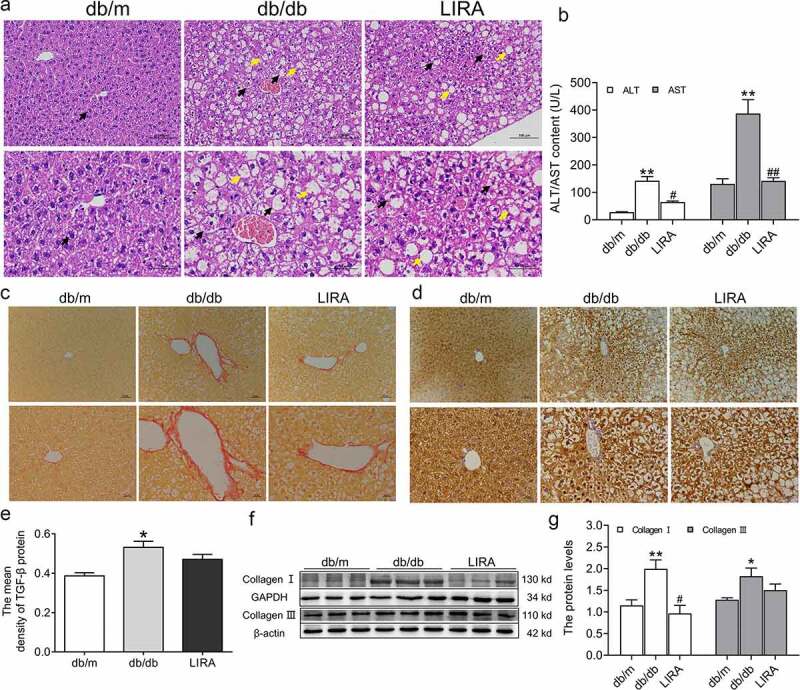
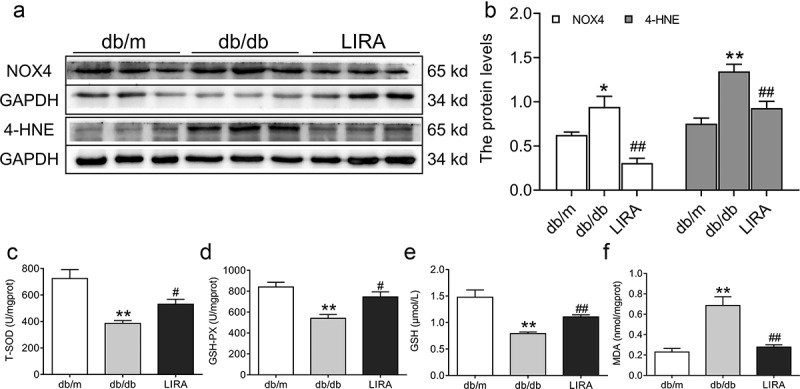
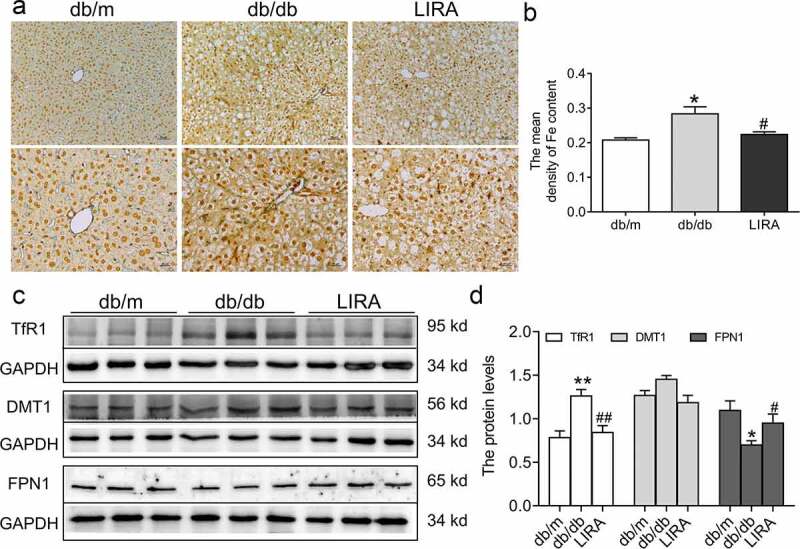
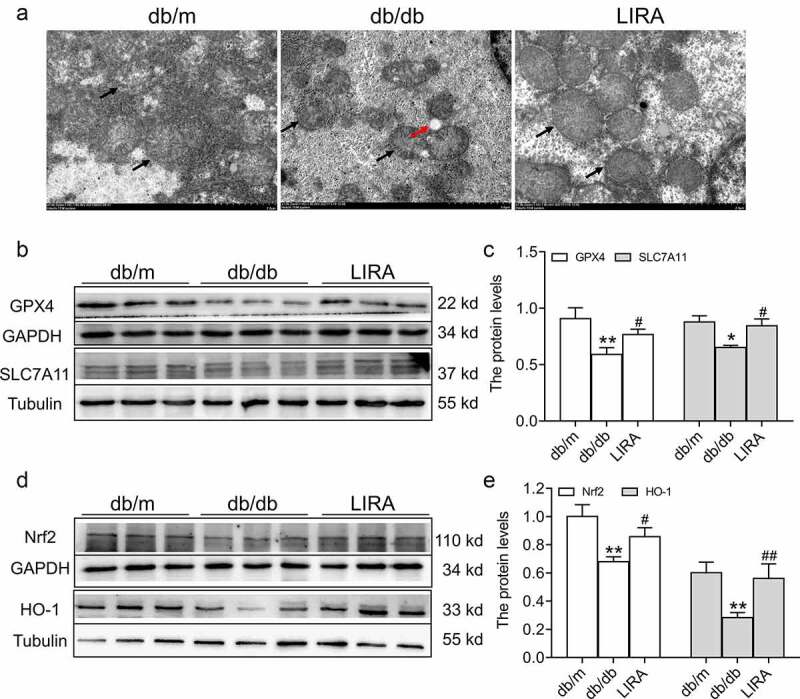
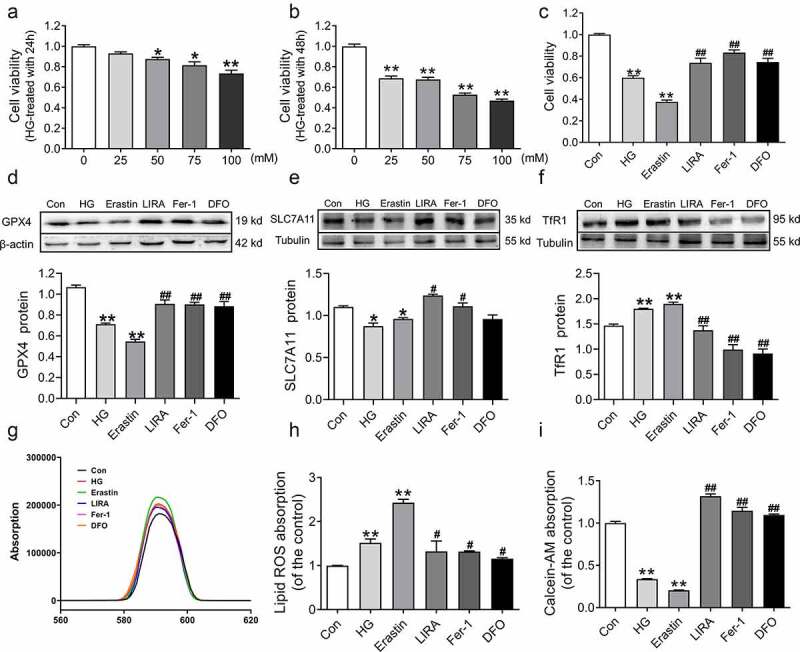
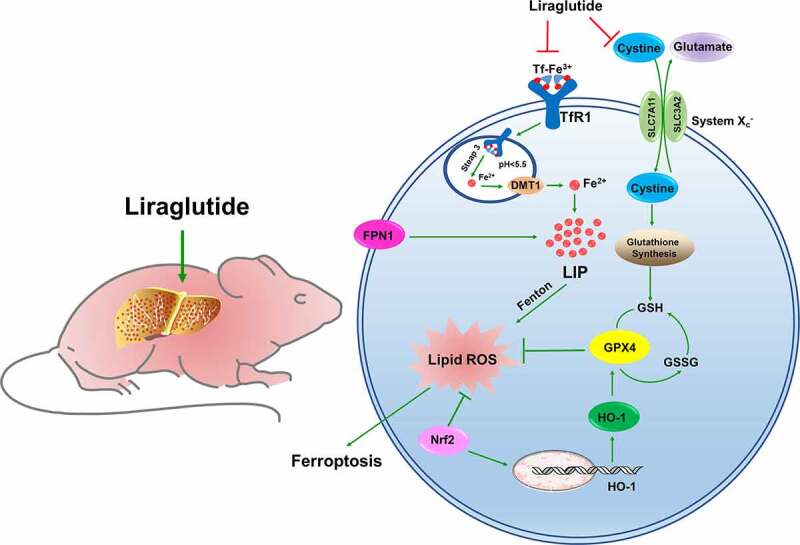
Liver pathological changes are as high as 21%-78% in diabetic patients, and treatment options are lacking. Liraglutide is a glucagon-like peptide-1 (GLP-1) receptor that is widely used in the clinic and is approved to treat obesity and diabetes. However, the specific protection mechanism needs to be clarified. In the present study, db/db mice were used to simulate Type 2 diabetes mellitus (T2DM), and they were intraperitoneally injected daily with liraglutide (200 μg/kg/d) for 5 weeks. Hepatic function, pathologic changes, oxidative stress, iron levels, and ferroptosis were evaluated. First, liraglutide decreased serum AST and ALT levels, and suppressed liver fibrosis in db/db mice. Second, liraglutide inhibited the ROS production by upregulating SOD, GSH-PX, and GSH activity as well as by downregulating MDA, 4-HNE, and NOX4 expression in db/db mice. Furthermore, liraglutide attenuated iron deposition by decreasing TfR1 expression and increasing FPN1 expression. At the same time, liraglutide decreased ferroptosis by elevating the expression of SLC7A11 and the Nrf2/HO-1/GPX4 signaling pathway in the livers of db/db mice. In addition, liraglutide decreased the high level of labile iron pools (LIPs) and intracellular lipid ROS induced by high glucose in vitro. Therefore, we speculated that liraglutide played a crucial role in reducing iron accumulation, oxidative damage and ferroptosis in db/db mice.
Keywords: Liver; ferroptosis; high glucose; iron overload; liraglutide; oxidative stress.
Conflict of interest statement
No potential conflict of interest was reported by the author(s).
Figures

Similar articles
-
Liraglutide Alleviates Cognitive Deficit in db/db Mice: Involvement in Oxidative Stress, Iron Overload, and Ferroptosis.Neurochem Res. 2022 Feb;47(2):279-294. doi: 10.1007/s11064-021-03442-7. Epub 2021 Sep 4. Neurochem Res. 2022. PMID: 34480710
-
Exploring Liraglutide's mechanism in reducing renal fibrosis: the Fsp1-CoQ10-NAD(P)H pathway.Sci Rep. 2025 Jan 12;15(1):1754. doi: 10.1038/s41598-025-85658-z. Sci Rep. 2025. PMID: 39799153 Free PMC article.
-
Effects of liraglutide on astrocyte polarization and neuroinflammation in db/db mice: focus on iron overload and oxidative stress.Front Cell Neurosci. 2023 Jun 1;17:1136070. doi: 10.3389/fncel.2023.1136070. eCollection 2023. Front Cell Neurosci. 2023. PMID: 37323581 Free PMC article.
-
Mechanism of Ferroptosis and Its Role in Type 2 Diabetes Mellitus.J Diabetes Res. 2021 Jun 28;2021:9999612. doi: 10.1155/2021/9999612. eCollection 2021. J Diabetes Res. 2021. PMID: 34258295 Free PMC article. Review.
-
Programmed Cell-Death by Ferroptosis: Antioxidants as Mitigators.Int J Mol Sci. 2019 Oct 8;20(19):4968. doi: 10.3390/ijms20194968. Int J Mol Sci. 2019. PMID: 31597407 Free PMC article. Review.
Cited by
-
Autophagy Regulates Ferroptosis-Mediated Diabetic Liver Injury by Modulating the Degradation of ACSL4.J Diabetes Res. 2024 Dec 24;2024:7146054. doi: 10.1155/jdr/7146054. eCollection 2024. J Diabetes Res. 2024. PMID: 39741964 Free PMC article.
-
Ferroptosis and metabolic syndrome and complications: association, mechanism, and translational applications.Front Endocrinol (Lausanne). 2024 Jan 8;14:1248934. doi: 10.3389/fendo.2023.1248934. eCollection 2023. Front Endocrinol (Lausanne). 2024. PMID: 38260171 Free PMC article. Review.
-
Christensenella regulated by Huang-Qi-Ling-Hua-San is a key factor by which to improve type 2 diabetes.Front Microbiol. 2022 Oct 12;13:1022403. doi: 10.3389/fmicb.2022.1022403. eCollection 2022. Front Microbiol. 2022. PMID: 36312936 Free PMC article.
-
Recent progress in the effect of ferroptosis of HSCs on the development of liver fibrosis.Front Mol Biosci. 2023 Sep 26;10:1258870. doi: 10.3389/fmolb.2023.1258870. eCollection 2023. Front Mol Biosci. 2023. PMID: 37860583 Free PMC article. Review.
-
Emerging Role of Ferroptosis in Diabetic Kidney Disease: Molecular Mechanisms and Therapeutic Opportunities.Int J Biol Sci. 2023 May 11;19(9):2678-2694. doi: 10.7150/ijbs.81892. eCollection 2023. Int J Biol Sci. 2023. PMID: 37324941 Free PMC article. Review.
References
-
- Khan MNA, Khan FA, Sultana S, et al. Impact of new diagnostic criteria of diabetes mellitus. J Coll Physicians Surg Pak. 2007;17(6):327–330. - PubMed
-
- Khunti K, Gavin JR 3rd, Boulton AJM, et al. The Berlin declaration: a call to improve early actions related to type 2 diabetes. Why is primary care important? Care Diabetes. 2018;12(5):383–392. - PubMed
-
- Ming H. Diabetic neuropathy: what now? What’s next? Life Res. 2021;4:10–17.
-
- Ebert EC. Gastrointestinal complications of diabetes mellitus. Dis Mon. 2005;51(12):620–663. - PubMed
-
- Meshkani R, Adeli K. Hepatic insulin resistance, metabolic syndrome and cardiovascular disease. Clin Biochem. 2009;42(13–14):1331–1346. - PubMed
Publication types
MeSH terms
Substances
LinkOut - more resources
Full Text Sources
Medical
Miscellaneous