. 2022 Dec;18(12):2946-2968.
doi: 10.1080/15548627.2022.2055285. Epub 2022 Apr 10.

ATG7-mediated autophagy facilitates embryonic stem cell exit from naive pluripotency and marks commitment to differentiation

Affiliations

ATG7-mediated autophagy facilitates embryonic stem cell exit from naive pluripotency and marks commitment to differentiation

Jilong Zhou et al. Autophagy. 2022 Dec.

Abstract

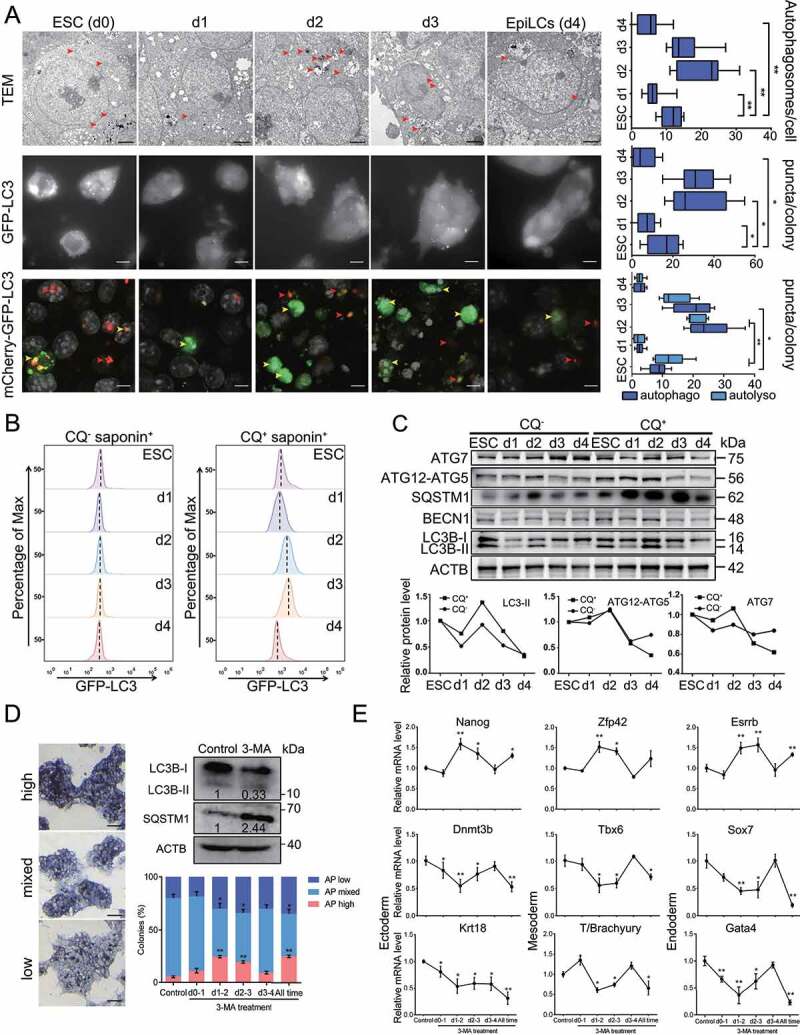
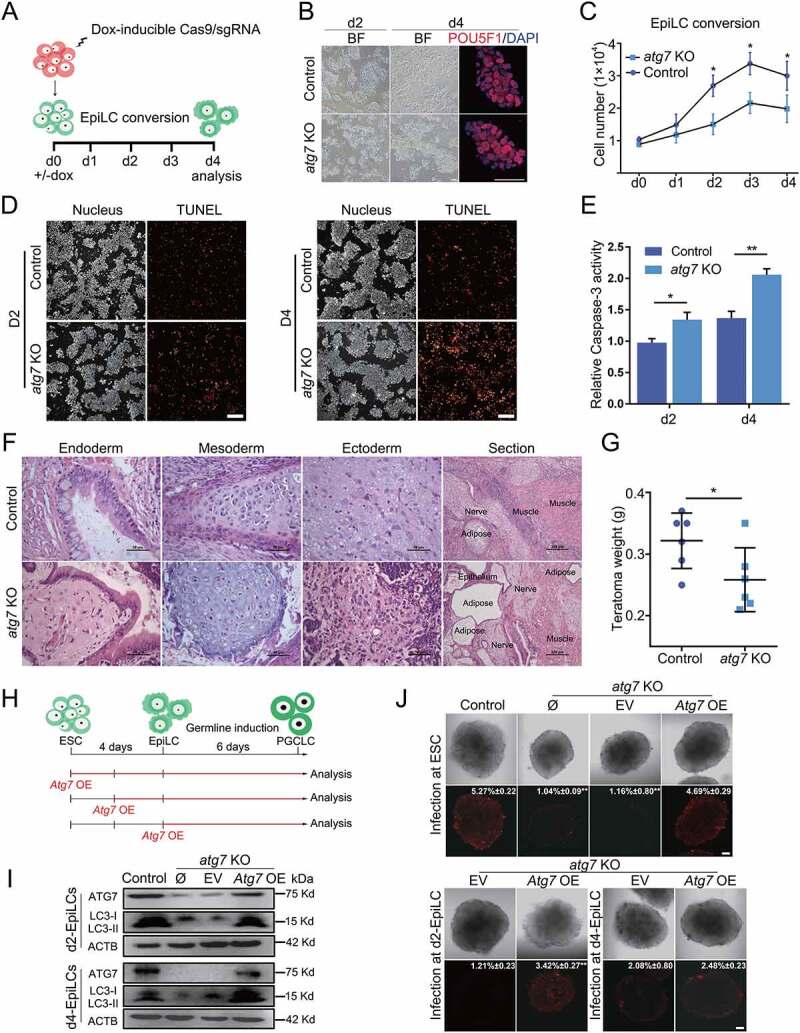
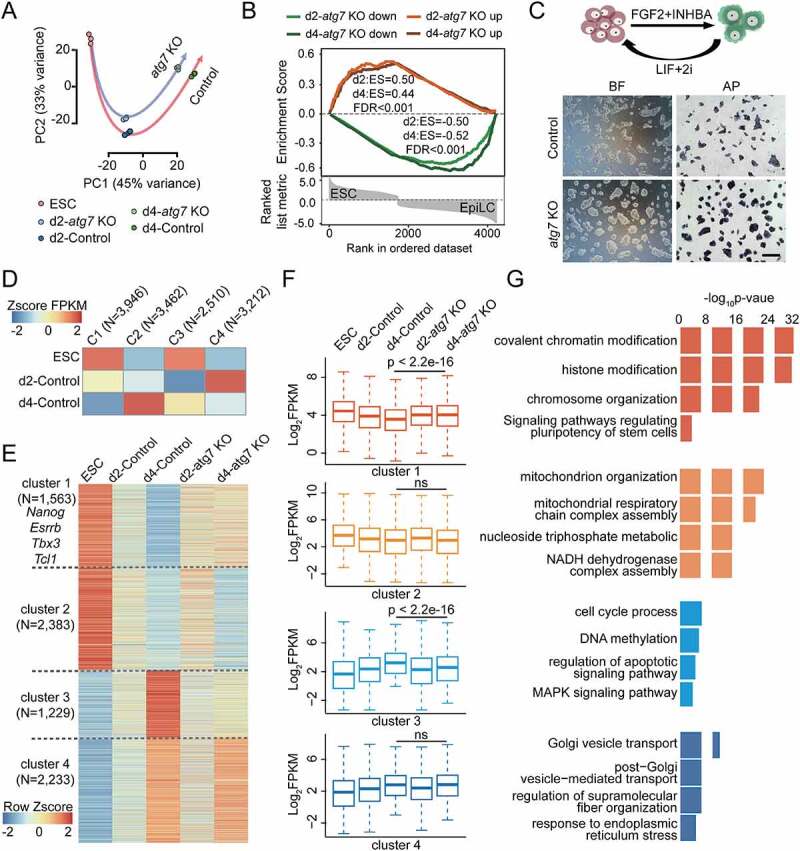
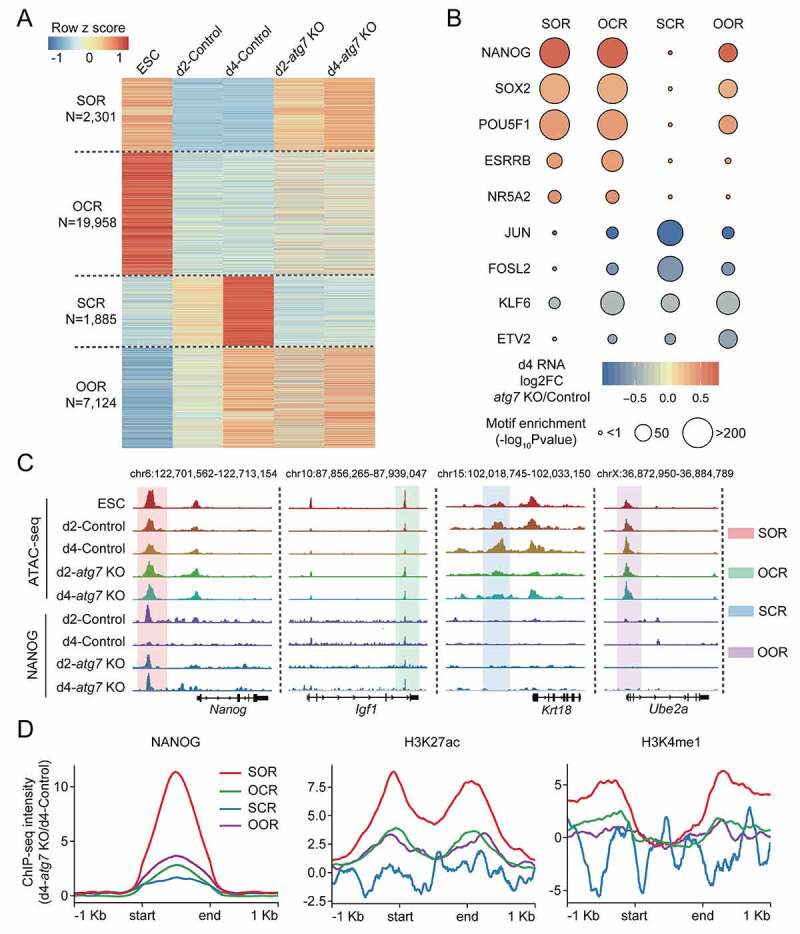
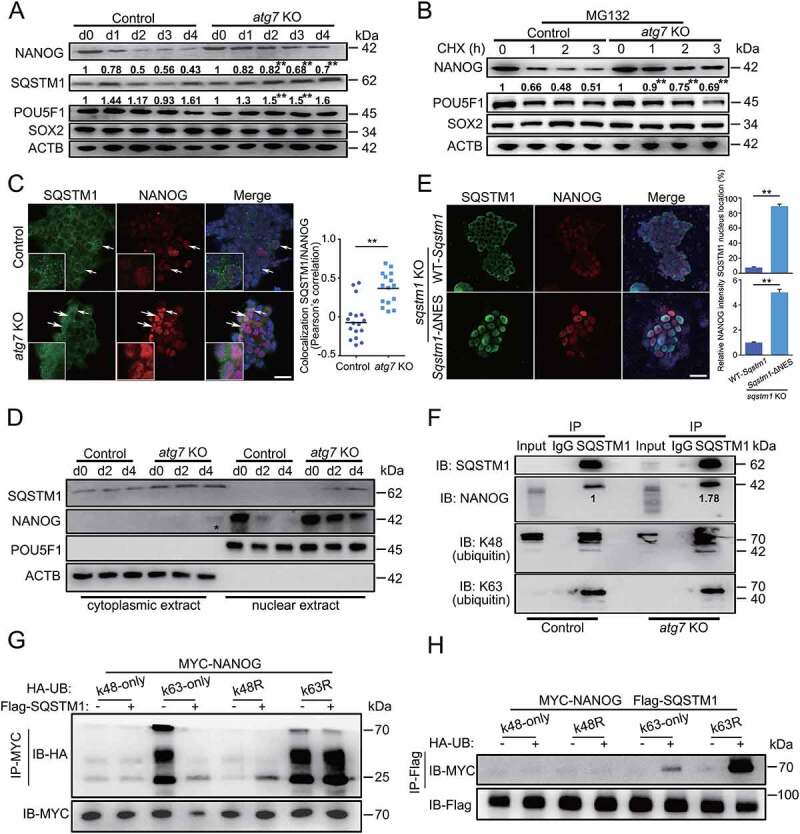
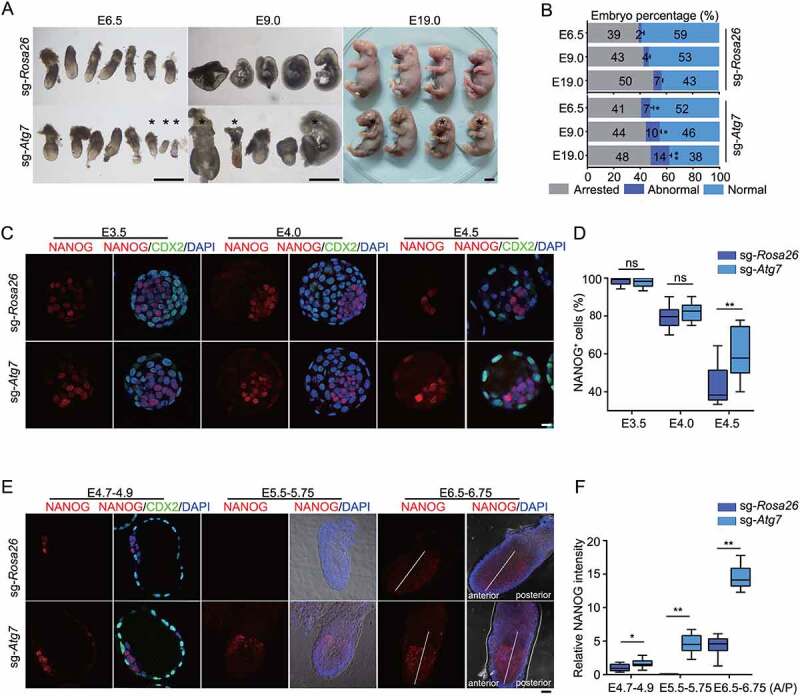
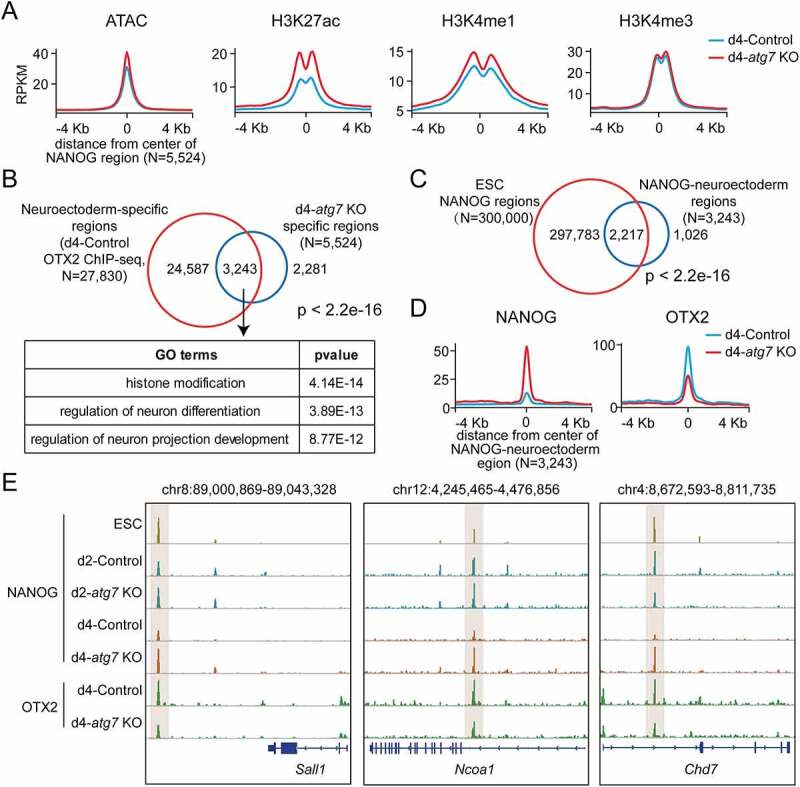
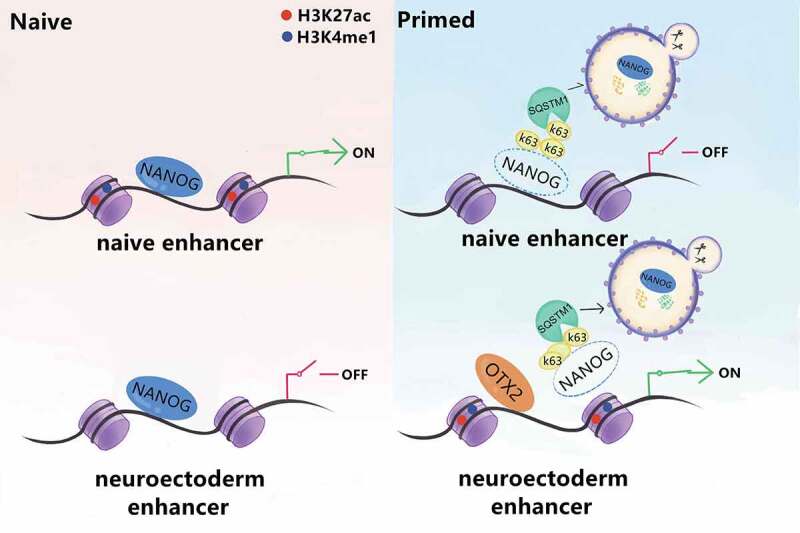
Macroautophagy/autophagy is a conserved cellular mechanism to degrade unneeded cytoplasmic proteins and organelles to recycle their components, and it is critical for embryonic stem cell (ESC) self-renewal and somatic cell reprogramming. Whereas autophagy is essential for early development of embryos, no information exists regarding its functions during the transition from naive-to-primed pluripotency. Here, by using an in vitro transition model of ESCs to epiblast-like cells (EpiLCs), we find that dynamic changes in ATG7-dependent autophagy are critical for the naive-to-primed transition, and are also necessary for germline specification. RNA-seq and ATAC-seq profiling reveal that NANOG acts as a barrier to prevent pluripotency transition, and autophagy-dependent NANOG degradation is important for dismantling the naive pluripotency expression program through decommissioning of naive-associated active enhancers. Mechanistically, we found that autophagy receptor protein SQSTM1/p62 translocated into the nucleus during the pluripotency transition period and is preferentially associated with K63 ubiquitinated NANOG for selective protein degradation. In vivo, loss of autophagy by ATG7 depletion disrupts peri-implantation development and causes increased chromatin association of NANOG, which affects neuronal differentiation by competitively binding to OTX2-specific neuroectodermal development-associated regions. Taken together, our findings reveal that autophagy-dependent degradation of NANOG plays a critical role in regulating exit from the naive state and marks distinct cell fate allocation during lineage specification.Abbreviations: 3-MA: 3-methyladenine; EpiLC: epiblast-like cell; ESC: embryonic stem cell; PGC: primordial germ cell.

Keywords: ATG7; NANOG; autophagy; naive-to-primed transition; peri-implantation development.


Conflict of interest statement

No potential conflict of interest was reported by the author(s).

Figures

Figure 1.
Figure 1.
The dynamics of autophagic flux during the naive-to-primed transition. (A) Autophagosomal structure changes during the naive-to-primed transition. ESCs maintained in 2iL were transferred into FGF2/bFGF and INHBA/Activin A for 4 days. Images at the top show autophagosomes detected by Transmission Electron Microscopy. Red arrowhead indicates autophagosome. Scale bar: 1 µm. Images at the middle show immunofluorescence analysis of GFP-LC3 dots in GFP-LC3 ESCs during pluripotency transition, Scale bar: 20 µm. Images at the bottom show immunofluorescence analysis of mCherry-GFP-LC3 (yellow) and mCherry-LC3 (red) dots in mCherry-GFP-LC3 ESCs, yellow arrowhead indicates autophagosome, red arrowhead indicates autolysosome, Scale bar: 10 µm. Statistical data at the right are presented as means ± s.d. from three representative experiments and at least 10 individual cells. (B) FACS analysis showing changes in autophagic flux during the naive-to-primed transition. GFP-LC3 ESCs for EpiLCs induction were treated with or without 30 µM chloroquine for 6 h, and washed twice with saponin to eliminate soluble GFP-LC3-I. Cells were harvested to perform FACS analysis. (C) Autophagy-related protein expression during the naive-to-primed transition. Western blot indicates expression levels of ATG7, ATG12–ATG5, BECN1, SQSTM1/p62, LC3 during EpiLCs transition with or without chloroquine treatment. Data analysis for LC3-II, ATG12–ATG5 and ATG7 protein expression are shown at the bottom and presented as means. ACTB is shown as a loading control. (D) Inhibition of autophagy by 3-MA affects primed pluripotency. ESCs for EpiLCs induction were transiently treated with or without 5 mM 3-MA at the indicated days, Western blot indicates expression of LC3 and SQSTM1/p62 upon 3-MA treatment. The percentages of three AP signal colonies were calculated at day 4. AP high, AP mixed, AP low colonies are shown at the top. Scale bar: 50 µm. (E) Transient inhibition of 3-MA affects pluripotency and differentiation related gene expression. mRNA levels of the cells from (D) were analyzed by RT-qPCR and Actb was used as internal control. *p< 0.05. **p < 0.01 compared to the control. All the images are representative of at least three independent experiments, error bars represent s.d. *p< 0.05. **p < 0.01. TEM, Transmission Electron Microscopy; IF, Immunofluorescence; CQ, chloroquine; autophago, autophagosome; autolyso, autolysosome.
Figure 2.
Figure 2.
ATG7-deficiency impairs the naive-to-primed transition. (A) Schematic protocol for induction of atg7 KO and control EpiLCs. (B) Morphological feature of EpiLCs induction at days 2 and 4. Representative bright field images of d2-EpiLCs and d4-EpiLCs derived from ESCs with or without Dox treatment. Images for POU5F1 (red) in d4-EpiLCs are shown. DAPI (blue) was used to show the nucleus. Scale bar: 50 µm. (C) Proliferation analysis of atg7 KO and control cells during the naive-to-primed transition with or without Dox treatment. Data are representative of five different experiments and shown as mean ± s.d. *p< 0.05. (D) TUNEL analysis of cell apoptotic rate in atg7 KO and control EpiLCs during naive-to-primed transition. The image is representative of three independent experiments. Scale bar: 100 µm. (E) CASP3 analysis of cell apoptotic rate in atg7 KO and control EpiLCs during naive-to-primed transition. Data were obtained in triplicate and are presented as mean ± s.d. *p< 0.05, **p < 0.01. (F) Hematoxylin and eosin (HE) stained histological sections of teratomas derived from d4-atg7 KO and d4-Control EpiLCs, shown are, from left to right, epithelium, cartilage, nerves. Scale bar: 50 µm. The whole section of teratomas is shown at the right. Scale bar: 200 µm. (G) The weight of teratomas derived from d4-atg7 KO and d4-Control EpiLCs. Error bars represent s.d. n = 6. *p< 0.05. (H) Schematic protocols for PGCLCs specification from ESCs and the rescue experiment for I and J. (I) ATG7 and LC3 protein levels in the rescue assay. Vector containing Atg7 cDNA was transfected at d2- and d4-EpiLC stages, the ATG7 and LC3 protein expressions were detected by western blot. ACTB was used as internal control. (J) Loss of autophagy during the naive-to-primed transition period affects PGCLCs specification. Atg7 overexpression vector was infected at different pluripotent stages. Bright field images representing PGCLCs at day 6. Images for NanoS3-mCherry (red) represents putative PGCLCs. Percentages are mCherry positive cells after FACS. Scale bar: 100 µm. The images shown in B-G, I and J are representative of at least three independent experiments, error bars represent s.d. *p< 0.05. **p < 0.01. BF, bright field; Ø, no infection; EV, empty vector; OE, over expression.
Figure 3.
Figure 3.
The effect of ATG7-mediated autophagy on transcriptome. (A) Principal-component analysis (PCA) of gene expression during EpiLCs induction with or without Dox treatment. (B) GSEA for the top genes are considered as significantly up-regulated (red) or down-regulated (green) in atg7 KO versus Control EpiLCs with respect to the global transcriptional changes observed in ESCs versus EpiLCs. (C) atg7 KO and control cells were treated with FGF2/bFGF and INHBA/Activin A, differentiated into EpiLCs for 3 days, and then re-plated under “2iL”. Left: control and atg7 KO cells after two passages of being re-plated in “2iL”. Right: alkaline phosphatase staining of control and atg7 KO cells after 48 h of being re-plated in “2iL”. The experiment was performed in triplicates. Scale bar: 20 µm. (D) All expressed genes (FPKM > 1 of any one of ESC, d2-Control and d4-Control) were clustered into four classes by kmeans, and the gene set that was continuously down-regulated and continuously up-regulated in d2-Control and d4-Control was selected (C1 and C2). (E) Heat map showing relative expression levels of clusters 1–4 genes from ESCs, d2-atg7 KO, d2-Control and d4-atg7 KO, d4-Control cells. These genes were further classified into four categories based on the fold change (FC) in transcription levels between d4-atg7 KO and d4-Control EpiLCs. (F) Box plots showing the expression levels of cluster 1–4 genes in (E) Mann-Whitney-Wilcoxon two-sided test was used to calculate the P values between d4-atg7 KO and d4-Control data. (G) Functional annotation of the four clusters classified in (E).
Figure 4.
Figure 4.
The effect of ATG7-mediated autophagy on chromatin accessibility. (A) Heat map showing the classification of the ATAC-seq peaks. These include: 1) “stubbornly opened region (SOR)”, defined as those that are stubbornly opened in d4-atg7 KO cells compared to d4-Control cells; 2) “obedient closed region (OCR)”, defined as those that are gradually closed in d2 and d4 as that of controls; 3) “stubbornly closed region (SCR)”, defined as those that are stubbornly closed in d4 atg7 KO cells compared to d4-Control cells; 4) “obedient opened region (OOR)”, defined as those that are gradually opened in d2 and d4 as that of controls. (B) The TF motif identified in the four groups of ATAC-seq peaks that have been classified in (A). (C) Selected genomic views of the ATAC-seq data, and comparison with ChIP-seq data from NANOG, are shown for the indicated SOR, OCR, SCR and OOR groups: Nanog, Igf1, Krt18 and Ube2a. (D) The average ChIP-seq intensity of NANOG is shown within SOR, OCR, SCR and OOR compared with 1 kb flanking regions (left). The average ChIP-seq intensities of H3K27ac (middle) and H3K4me1 (right) are shown in the SOR, OCR, SCR, and OOR overlapping regions with d4-atg7 KO NANOG peaks. The ChIP-seq intensity of d4-atg7 KO is normalized by d4-Control, total mapped reads and region length.
Figure 5.
Figure 5.
The physical interaction between NANOG and SQSTM1/p62. (A) Western blotting for NANOG, SQSTM1/p62, POU5F1 and SOX2 in atg7 KO or control cells during EpiLCs induction. ACTB is shown as a loading control. The relative intensity is shown below the band. (B) The effect of autophagy on NANOG half-life time. After treating cells with cycloheximide (CHX, 10 µg/ml) for indicated time intervals and MG132 (10 µM) for additional 2 h, NANOG, POU5F1 and SOX2 were analyzed by western blotting. ACTB is used as a loading control. The relative intensity is shown below the band. (C) The expression and subcellular location of NANOG and SQSTM1/p62. Immunofluorescence analysis of NANOG and SQSTM1/p62 in d2-atg7 KO and d2-Control EpiLCs. White arrowhead represents the colocation of NANOG and SQSTM1/p62 in the nucleus. Scale bar: 20 µm. Pearson’s correlation illustrated SQSTM1/p62-NANOG colocalization. Plots showed colocalization values for individual cells, for >10 cells per condition. **p < 0.01. (D) SQSTM1/p62 translocates into the nucleus of the cells during naive-to-primed transition. Nucleocytoplasmic separation and western blot analysis showing the expression of SQSTM1/p62 and NANOG. ACTB is used as a cytoplasmic protein control while POU5F1 is used as a nuclear protein control. *represents NANOG transports from the nucleus into the cytoplasm. (E) The NANOG degradation is associated with nuclear shuttling of SQSTM1/p62. WT SQSTM1/p62- or SQSTM1/p62ΔNES plasmids were transfected into sqstm1/p62 KO ESCs. Images for SQSTM1/p62 (green) and NANOG (red) were taken at d2-EpiLCs. Scale bar: 20 µm. Plots showed the nuclear location of SQSTM1/p62 and the relative NANOG intensity, for >10 cells per condition. Error bar represents s.d. **p < 0.01. (F) SQSTM1/p62 interacts with NANOG. Endogenous SQSTM1/p62 was immunoprecipitated with an antibody against SQSTM1/p62. NANOG, ubiquitin (linkage-specific K48), ubiquitin (linkage-specific K63) were detected by western blotting. The relative intensity of NANOG is shown below the band. (G) SQSTM1/p62 targets K63-linked NANOG for degradation. The 293 T cells were transfected with MYC-NANOG (2 µg) along with the indicated plasmids (0.2 µg). 24 h after transfection, immunoprecipitation, and immunoblot analysis were performed with the indicated antibodies. (H) SQSTM1/p62 targets NANOG for K63-linked ubiquitination. The 293 T cells were transfected with MYC-NANOG (2 µg), Flag-SQSTM1/p62 (2 µg) and the ubiquitin plasmids (0.2 µg). Immunoprecipitation and immunoblot analysis were performed 24 h later. All the experiments were performed in triplicates. Error bars represent s.d. **p < 0.01.
Figure 6.
Figure 6.
ATG7-mediated autophagy regulates peri-implantation embryonic development. (A) The effect of ATG7-mediated autophagy on embryonic development. Embryos injected with sgRNAs were transferred into the oviduct of psedudopregnants. Representative images showing conceptuses at E6.5, E9.0 and E19. *represents abnormal embryos. Scale bars: 1 mm. (B) Quantification of arrested, abnormal and normal embryos in (A). The number of total transferred sgRNA-injected embryos minus obtained embryos at indicated time represents arrested embryos. * p < 0.05, **p < 0.01, compared to sgRNA-Rosa26 embryos. (C) The NANOG expression in late pre-implantation stages. Immunofluorescence analysis of NANOG (red), CDX2 (green) and DAPI (blue) was performed at E3.5, E4.0 and E4.5 in sg-Atg7 and sg-Rosa26 embryos to follow NANOG expression in late pre-implantation stages. Each image is representative of three different experiments. Scale bars: 20 µm. (D) Data analysis of NANOG positive cell proportion in ICM of embryos derived from (C). DAPI-positive cell number minus CDX2 positive cell number represents epiblast and hypoblast cell numbers. Data are presented as mean ± s.d. n = 20. **p < 0.01, ns, not significant. (E) The NANOG expression in early post-implantation stages. Immunofluorescence analysis of NANOG (red), CDX2 (green) and DAPI (blue) was performed at E4.7–4.9. Images for Bright field, NANOG (red) and DAPI (blue) were taken at E5.5–5.75 and E6.5–6.75 in sg-Atg7 and sg-Rosa26 embryos. Data are representative of three different experiments. Scale bars: 20 µm. (F) Data analysis of relative NANOG intensity in embryos derived from (E). Data are presented as mean ± s.d. n = 6. * p < 0.05, **p < 0.01. All the experiments were repeated at least three times. sg-Atg7, sgRNA-Atg7; sg-Rosa26, sgRNA-Rosa26.
Figure 7.
Figure 7.
NANOG regulates neuroectoderm-specific enhancers by antagonizing OTX2. (A) Average profiles for ATAC-seq, H3K27ac, H3K4me1, and H3K4me3 around the central position of d4-atg7 KO specific regions in d4-atg7 KO and d4-Control EpiLCs. (B) Venn diagram showing the overlap between the neuroectoderm-specific regions marked by OTX2 ChIP-seq in d4-Control EpiLCs and d4-atg7 KO specific regions (regions colored in red in Fig. S7B). GO enrichment analysis was performed on the 3,243 overlap regions. Two-sided P values (Fisher’s exact test) are shown. (C) Venn diagram showing the overlap between the NANOG-bound regions in ESC [84] and NANOG-neuroectoderm regions (overlap regions in Figure 7B). Two-sided P values (Fisher’s exact test) are shown. (D) Average profiles for NANOG and OTX2 around the central position of NANOG-neuroectoderm regions (overlap regions in Figure 7B) in d4-atg7 KO and d4-Control EpiLCs. (E) Representative genome browser views showing the NANOG and OTX2 in Control, atg7 KO or ESC cells near Sall1, Ncoa1, Chd7 gene loci.
Figure 8.
Figure 8.
Diagram illustrating the proposed mechanisms for alteration of naive-to-primed transition and peri-implantation development in vivo. Our data suggests that autophagy is required for exit from naive state, primed establishment and germline specification. Through degradation of NANOG in an SQSTM1/p62-mediated pathway, autophagy downregulates the NANOG level and NANOG occupancy in naive related enhancers, and therefore dismantles the naive pluripotency expression program. In the primed state, the elimination of NANOG caused by autophagy improves OTX2 binding to its neuro-related enhancers, which further govern the normal neuronal differentiation process both in vivo and in vitro.

Similar articles

Cited by

References

    1. Hackett JA, Surani MA.. Regulatory principles of pluripotency: from the ground state up. Cell Stem Cell. 2014;15(4):416–430. - PubMed
    1. Smith A. Formative pluripotency: the executive phase in a developmental continuum. Development. 2017;144(3):365–373. - PMC - PubMed
    1. Kojima Y, Kaufman-Francis K, Studdert JB, et al. The transcriptional and functional properties of mouse epiblast stem cells resemble the anterior primitive streak. Cell Stem Cell. 2014;14(1):107–120. - PubMed
    1. Pekowska A, Klaus B, Xiang W, et al. Gain of CTCF-anchored chromatin loops marks the exit from naive pluripotency. Cell Syst. 2018;7(5):482–95 e10. - PMC - PubMed
    1. Buecker C, Srinivasan R, Wu Z, et al. Reorganization of enhancer patterns in transition from naive to primed pluripotency. Cell Stem Cell. 2014;14(6):838–853. - PMC - PubMed

Publication types