

Transcriptome Analysis on Key Metabolic Pathways in Rhodotorula mucilaginosa Under Pb(II) Stress
- PMID: 35311507
- PMCID: PMC9004357
- DOI: 10.1128/aem.02215-21
Transcriptome Analysis on Key Metabolic Pathways in Rhodotorula mucilaginosa Under Pb(II) Stress
Abstract
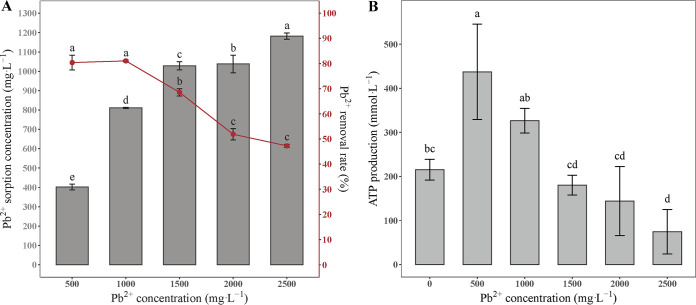
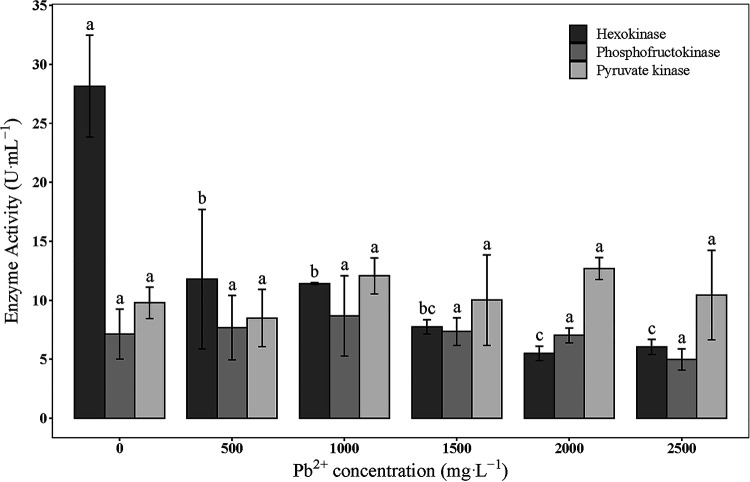
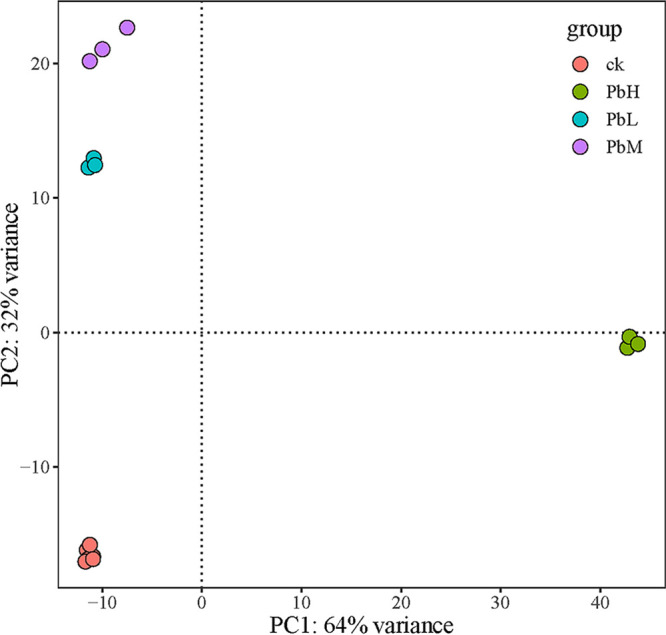
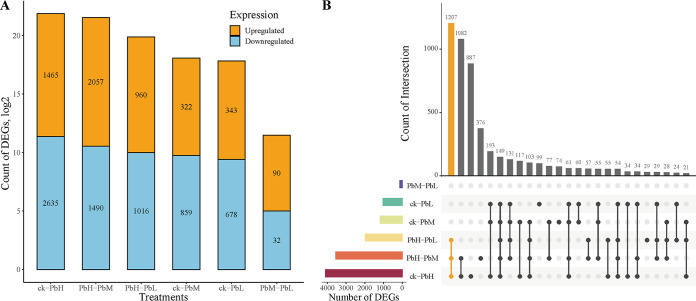
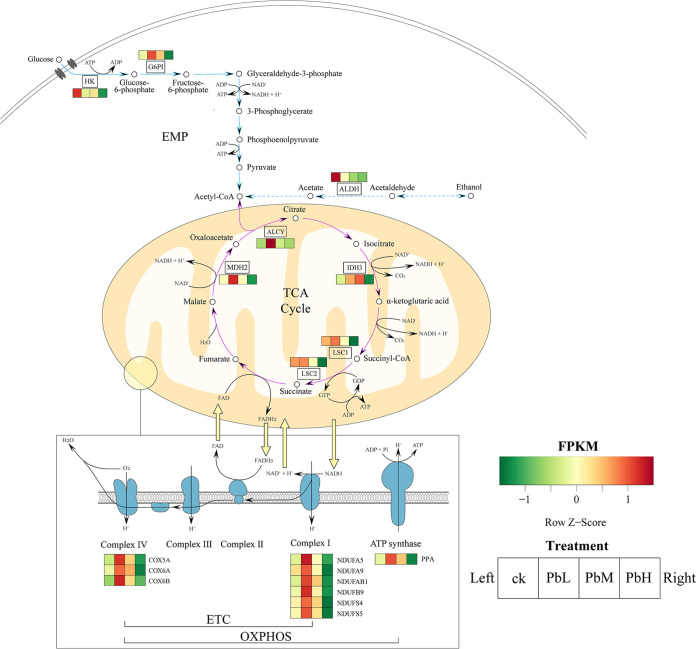
Rhodotorula mucilaginosa shows adaption to a broad range of Pb2+ stress. In this study, three key pathways, i.e., glycolysis (EMP), the tricarboxylic acid (TCA) cycle, and oxidative phosphorylation (OXPHOS), were investigated under 0-2,500 mg · L-1 Pb stress, primarily based on biochemical analysis and RNA sequencing. R. mucilaginosa cells showed similar metabolic response to low/medium (500/1000 mg · L-1) Pb2+ stress. High (2,500 mg · L-1) Pb2+ stress exerted severe cytotoxicity to R. mucilaginosa. The downregulation of HK under low-medium Pb2+ suggested a correlation with the low hexokinase enzymatic activity in vivo. However, IDH3, regulating a key step of circulation in TCA, was upregulated to promote ATP feedstock for downstream OXPHOS. Then, through activation of complex I & IV in the electron transport chain (ETC) and ATP synthase, ATP production was finally enhanced. This mechanism enabled fungal cells to compensate for ATP consumption under low-medium Pb2+ toxicity. Hence, R. mucilaginosa tolerance to such a broad range of Pb2+ concentrations can be attributed to energy adaption. In contrast, high Pb2+ stress caused ATP deficiency. Then, the subsequent degradation of intracellular defense systems further intensified Pb toxicity. This study correlated responses of EMP, TCA, and OXPHOS pathways in R. mucilaginosa under Pb stress, hence providing new insights into the fungal resistance to heavy metal stress. IMPORTANCE Glycolysis (EMP), the tricarboxylic acid (TCA) cycle, and oxidative phosphorylation (OXPHOS) are critical metabolism pathways for microorganisms to obtain energy during the resistance to heavy metal (HM) stress. However, these pathways at the genetic level have not been elucidated to evaluate their cytoprotective functions for Rhodotorula mucilaginosa under Pb stress. In this study, we investigated these three pathways based on biochemical analysis and RNA sequencing. Under low-medium (500-1,000 mg · L-1) Pb2+ stress, ATP production was stimulated mainly due to the upregulation of genes associated with the TCA cycle and the electron transport chain (ETC). Such an energy compensatory mechanism could allow R. mucilaginosa acclimation to a broad range of Pb2+ concentrations (up to 1000 mg · L-1). In contrast, high (2500 mg · L-1) Pb2+ stress exerted its excessive toxicity by provoking ATP deficiency and damage to intracellular resistance systems. This study provided new insights into R. mucilaginosa resistance to HM stress from the perspective of metabolism.
Keywords: Rhodotorula mucilaginosa; TCA; lead; metabolism; transcriptome.
Conflict of interest statement
The authors declare no conflict of interest.
Figures
Similar articles
-
Proteomic analysis of an environmental isolate of Rhodotorula mucilaginosa after arsenic and cadmium challenge: Identification of a protein expression signature for heavy metal exposure.J Proteomics. 2016 Jun 1;141:47-56. doi: 10.1016/j.jprot.2016.04.012. Epub 2016 Apr 16. J Proteomics. 2016. PMID: 27090762
-
Biochemical changes of polysaccharides and proteins within EPS under Pb(II) stress in Rhodotorula mucilaginosa.Ecotoxicol Environ Saf. 2019 Jun 15;174:484-490. doi: 10.1016/j.ecoenv.2019.03.004. Epub 2019 Mar 8. Ecotoxicol Environ Saf. 2019. PMID: 30856560
-
The dynamic roles of intracellular vacuoles in heavy metal detoxification by Rhodotorula mucilaginosa.J Appl Microbiol. 2024 Sep 2;135(9):lxae241. doi: 10.1093/jambio/lxae241. J Appl Microbiol. 2024. PMID: 39284782
-
The tricarboxylic acid (TCA) cycle: a malleable metabolic network to counter cellular stress.Crit Rev Biochem Mol Biol. 2023 Feb;58(1):81-97. doi: 10.1080/10409238.2023.2201945. Epub 2023 Apr 26. Crit Rev Biochem Mol Biol. 2023. PMID: 37125817 Review.
-
Tricarboxylic acid cycle intermediate pool size: functional importance for oxidative metabolism in exercising human skeletal muscle.Sports Med. 2007;37(12):1071-88. doi: 10.2165/00007256-200737120-00005. Sports Med. 2007. PMID: 18027994 Review.
Cited by
-
Comparative secretomic and proteomic analysis reveal multiple defensive strategies developed by Vibrio cholerae against the heavy metal (Cd2+, Ni2+, Pb2+, and Zn2+) stresses.Front Microbiol. 2023 Oct 26;14:1294177. doi: 10.3389/fmicb.2023.1294177. eCollection 2023. Front Microbiol. 2023. PMID: 37954246 Free PMC article.
-
Environmental yeasts differentially impact the development and oviposition behavior of the Asian tiger mosquito Aedes albopictus.Microbiome. 2025 Apr 16;13(1):99. doi: 10.1186/s40168-025-02099-6. Microbiome. 2025. PMID: 40241175 Free PMC article.
-
In Rhodotorula mucilaginosa, active oxidative metabolism increases carotenoids to inactivate excess reactive oxygen species.Front Fungal Biol. 2024 Sep 6;5:1378590. doi: 10.3389/ffunb.2024.1378590. eCollection 2024. Front Fungal Biol. 2024. PMID: 39309729 Free PMC article.
-
Competition of Cd(II) and Pb(II) on the bacterial cells: a new insight from bioaccumulation based on NanoSIMS imaging.Appl Environ Microbiol. 2024 Feb 21;90(2):e0145323. doi: 10.1128/aem.01453-23. Epub 2024 Jan 11. Appl Environ Microbiol. 2024. PMID: 38224623 Free PMC article.
-
Lead (Pb) tolerance in the ectomycorrhizal fungi Suillus brevipes and S. tomentosus.Mycorrhiza. 2024 Dec 21;35(1):6. doi: 10.1007/s00572-024-01179-z. Mycorrhiza. 2024. PMID: 39708163
References
-
- Schneider AR, Gommeaux M, Duclercq J, Fanin N, Conreux A, Alahmad A, Lacoux J, Roger D, Spicher F, Ponthieu M, Cancès B, Morvan X, Marin B. 2017. Response of bacterial communities to Pb smelter pollution in contrasting soils. Sci Total Environ 605-606:436–444. 10.1016/j.scitotenv.2017.06.159. - DOI - PubMed
Publication types
MeSH terms
Substances
Supplementary concepts
LinkOut - more resources
Full Text Sources
