. 2022 Apr 26;13(2):e0040022.
doi: 10.1128/mbio.00400-22. Epub 2022 Mar 21.

Analysis of mRNA Decay Intermediates in Bacillus subtilis 3' Exoribonuclease and RNA Helicase Mutant Strains

Affiliations

Analysis of mRNA Decay Intermediates in Bacillus subtilis 3' Exoribonuclease and RNA Helicase Mutant Strains

Shivani Chhabra et al. mBio. .

Abstract

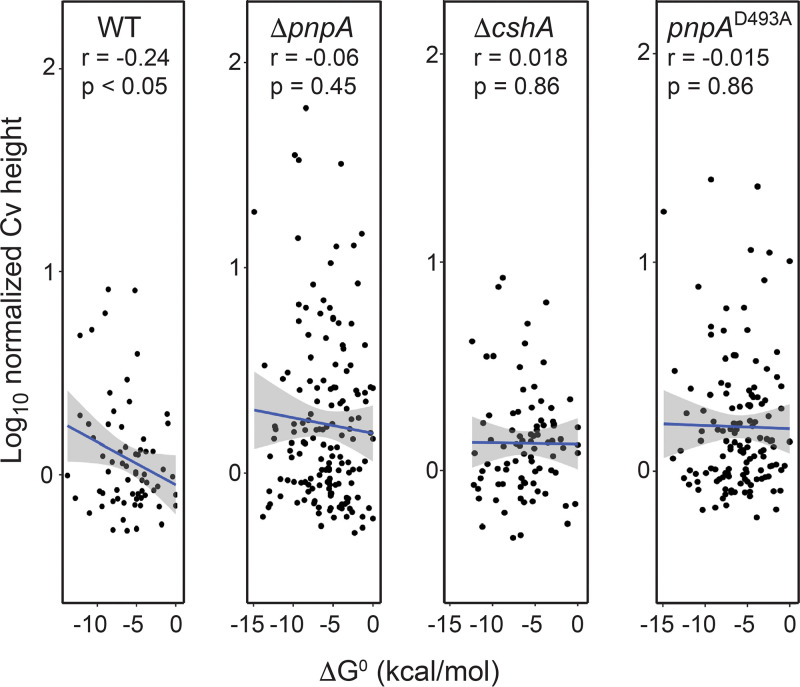
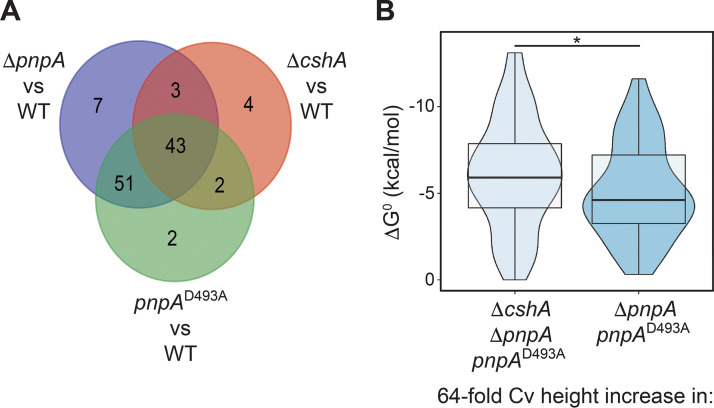
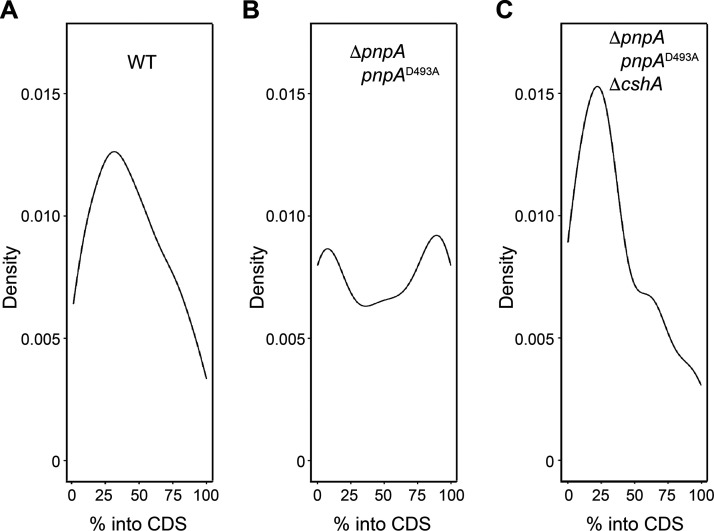
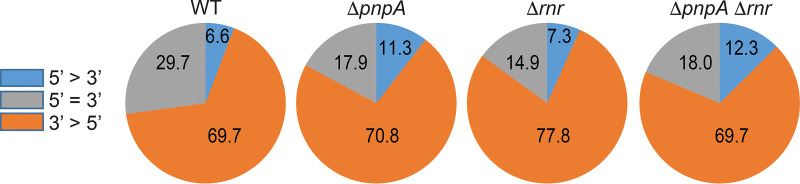
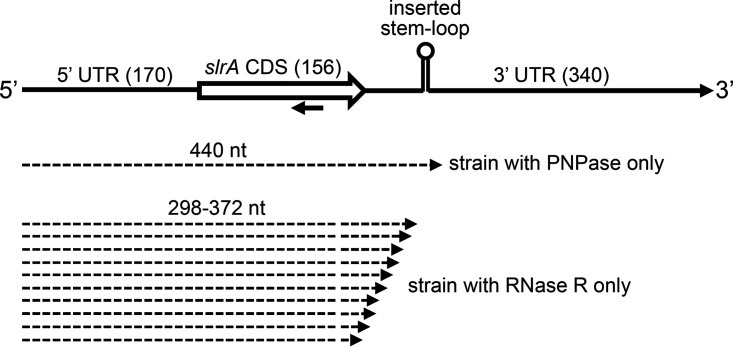
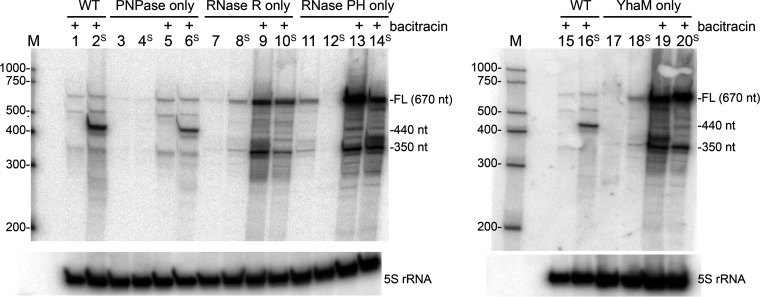
The Bacillus subtilis genome encodes four 3' exoribonucleases: polynucleotide phosphorylase (PNPase), RNase R, RNase PH, and YhaM. Previous work showed that PNPase, encoded by the pnpA gene, is the major 3' exonuclease involved in mRNA turnover; in a pnpA deletion strain, numerous mRNA decay intermediates accumulate. Whether B. subtilis mRNA decay occurs in the context of a degradosome complex is controversial. In this study, global mapping of mRNA decay intermediate 3' ends within coding sequences was performed in strains that were either deleted for or had an inactivating point mutation in the pnpA gene. The patterns of 3'-end accumulation in these strains were highly similar, which may have implications for the role of a degradosome in mRNA decay. A comparison with mapped 3' ends in a strain lacking CshA, the major RNA helicase, indicated that many mRNAs require both PNPase and CshA for efficient decay. Transcriptome sequencing (RNA-seq) analysis of strains lacking RNase R suggested that this enzyme did not play a major role in mRNA turnover in the wild-type strain. Strains were constructed that contained only one of the four known 3' exoribonucleases. When RNase R was the only 3' exonuclease present, it was able to degrade a model mRNA efficiently, showing processive decay even through a strong stem-loop structure that inhibits PNPase processivity. Strains containing only RNase PH or only YhaM were also insensitive to this RNA secondary structure, suggesting the existence of another, as-yet-unidentified, 3' exoribonuclease. IMPORTANCE The ability to rapidly change bacterial gene expression programs in response to environmental conditions is highly dependent on the efficient turnover of mRNA. While much is known about the regulation of gene expression at the transcriptional and translational levels, much less is known about the intermediate step of mRNA decay. Here, we mapped the 3' ends of mRNA decay intermediates in strains that were missing the major 3' exoribonuclease PNPase or the RNA helicase CshA. We also assessed the roles of three other B. subtilis 3' exonucleases in the mRNA decay process. The data confirm the primary role of PNPase in mRNA turnover and suggest the involvement of one or more unknown RNases.

Keywords: 3′ exoribonucleases; Bacillus subtilis; PNPase; RNA helicase; Term-seq; mRNA decay; transcriptomics.


Conflict of interest statement

The authors declare no conflict of interest.

Figures

FIG 1
FIG 1
Gene expression profiles cluster by enzymatic availability. A principal-component analysis (PCA) plot of transcriptomics data collected from each Term-seq replicate is shown.
FIG 2
FIG 2
Term-seq 3′-end density across the cspB transcript. Shown is an IGV screenshot of the 5′ portion of the cspB transcript. Data obtained from each strain are illustrated in two tracks. The top track shows the calculated Cv value at each coordinate, and the bottom track shows the location and height of each identified Cv peak.
FIG 3
FIG 3
Numbers of monocistronic Cv peaks and Cv peak height increases upon the loss of PNPase or CshA activities. (A) Bar graph showing the number of monocistronic coding sequence Cv peaks identified in each strain. (B) Violin plots overlaid with box plots showing the distribution of the log2-normalized Cv peak height fold changes. Each fold change corresponds to the normalized Cv peak height calculated for the strain specified above, divided by the normalized Cv peak height calculated for the strain specified below.
FIG 4
FIG 4
Cv peak overlap between strains. A Venn diagram is shown, where each oval contains the number of monocistronic coding sequence Cv peak locations that were calculated as having a normalized Cv height of ≥0.53 in a particular strain.
FIG 5
FIG 5
Relationship between the normalized Cv peak height and the upstream minimum free energy of RNA structure. A scatterplot shows the log10-transformed normalized Cv peak height and the calculated ΔG value for the RNA sequence 40 nt upstream of the identified Cv peak. For each strain, the plot contains all monocistronic coding sequence Cv peaks identified in the WT strain. The result of the linear regression analysis is shown as a blue line, with the standard error shown as gray shading. The strain designation, Spearman correlation analysis r value, and P value of the linear regression analysis are specified at the top of each plot.
FIG 6
FIG 6
CshA assists PNPase in the degradation of 3′ ends downstream of more stable RNA structures. (A) Venn diagram, where each circle contains the number of monocistronic coding sequence Cv peak locations with a ≥64-fold increase in the normalized Cv height in the specified mutant strain, compared to the WT strain. (B) Violin plots overlaid with box plots showing the distribution of RNA folding minimum free energies for the RNA sequences 40 nt upstream of each Cv peak within the subpopulation specified below the plot. Asterisk indicates p < 0.05 by Wilcoxon Rank Sum Test.
FIG 7
FIG 7
Distribution of Cv peaks across monocistronic coding sequences. (A) Kernel density plot showing the distribution of Cv peaks across the monocistronic coding sequences for all Cv peaks identified in the WT strain. The y axis details the approximate probability of finding a Cv peak at a particular location within a monocistronic coding sequence. (B) Same as for panel A except focusing on the distribution of Cv peaks within the subpopulation found to increase in height by 64-fold in the two PNPase mutant strains compared to the WT strain. (C) Same as for panel A except focusing on the distribution of Cv peaks within the subpopulation found to increase in height by 64-fold in all three mutant strains compared to the WT strain.
FIG 8
FIG 8
Involvement of RNase R in mRNA decay. Pie charts show the percentage of mRNAs with differential read counts in the 5′ and 3′ one-third of each expressed CDS in WT and RNase mutant strains.
FIG 9
FIG 9
Schematic diagram of the slrA gene and 3′-end mapping of prominent decay intermediates. The top line shows segments that comprise the slrA gene, with the number of base pairs indicated in parentheses. The strong stem-loop structure, located 60 bp downstream of the CDS, is shown. The oligonucleotide probe used for Northern blotting is indicated by the leftward-facing arrow. Dashed arrows below the gene diagram represent the lengths of prominent decay intermediates in the indicated strains.
FIG 10
FIG 10
Northern blot analysis of slrA decay intermediates. Total RNA was isolated from B. subtilis mutant strains containing only one of four 3′ exoribonuclease activities, as indicated at the top, with or without bacitracin induction. Lanes with “S” indicate the slrA construct with the strong stem-loop structure inserted downstream of the slrA CDS. The 5S rRNA loading control is shown at the bottom. The marker lane (M) contained RNA Century-Plus markers, with the RNA sizes in nucleotides indicated at the left. Shown are data from one of two biological repeats. FL, full length.

References

    1. Shahbabian K, Jamalli A, Zig L, Putzer H. 2009. RNase Y, a novel endoribonuclease, initiates riboswitch turnover in Bacillus subtilis. EMBO J 28:3523–3533. doi:10.1038/emboj.2009.283. - DOI - PMC - PubMed
    1. Lehnik-Habrink M, Schaffer M, Mader U, Diethmaier C, Herzberg C, Stulke J. 2011. RNA processing in Bacillus subtilis: identification of targets of the essential RNase Y. Mol Microbiol 81:1459–1473. doi:10.1111/j.1365-2958.2011.07777.x. - DOI - PubMed
    1. Yao S, Bechhofer DH. 2010. Initiation of decay of Bacillus subtilis rpsO mRNA by endoribonuclease RNase Y. J Bacteriol 192:3279–3286. doi:10.1128/JB.00230-10. - DOI - PMC - PubMed
    1. Bechhofer DH, Deutscher MP. 2019. Bacterial ribonucleases and their roles in RNA metabolism. Crit Rev Biochem Mol Biol 54:242–300. doi:10.1080/10409238.2019.1651816. - DOI - PMC - PubMed
    1. Bechhofer DH, Wang W. 1998. Decay of ermC mRNA in a polynucleotide phosphorylase mutant of Bacillus subtilis. J Bacteriol 180:5968–5977. doi:10.1128/JB.180.22.5968-5977.1998. - DOI - PMC - PubMed

Publication types

MeSH terms