. 2022 Apr 27;10(2):e0169621.
doi: 10.1128/spectrum.01696-21. Epub 2022 Mar 21.

Interactions and Stability of Gut Microbiota in Zebrafish Increase with Host Development

Affiliations

Interactions and Stability of Gut Microbiota in Zebrafish Increase with Host Development

Fanshu Xiao et al. Microbiol Spectr. .

Abstract

Understanding interactions within the gut microbiome and its stability are of critical importance for deciphering ecological issues within the gut ecosystem. Recent studies indicate that long-term instability of gut microbiota is associated with human diseases, and recovery of stability is helpful in the return to health. However, much less is known about such topics in fish, which encompass nearly half of all vertebrate diversity. Here, we examined the assembly and succession of gut microbiota in more than 550 zebrafish, and evaluated the variations of microbial interactions and stability across fish development from larva to adult using molecular ecological network analysis. We found that microbial interactions and stability in the fish gut ecosystem generally increased with host development. This could be attributed to the development of the zebrafish immune system, the increasing amount of space available for microbial colonization within the gut, and the greater stability of nutrients available for the colonized microbiota in adult zebrafish. Moreover, the potential keystone taxa, even those with relatively low abundances, played important roles in affecting the microbial interactions and stability. These findings indicate that regulating rare keystone taxa in adult fish may have great potential in gut microbial management to maintain gut ecosystem stability, which could also provide references for managing gut microbiota in humans and other animals. IMPORTANCE Understanding gut microbial stability and the underlying mechanisms is an important but largely ignored ecological issue in vertebrate fish. Here, using a zebrafish model and network analysis of the gut microbiota we found that microbial interactions and stability in the gut ecosystem increase with fish development. This finding has important implications for microbial management to maintain gut homeostasis and provide better gut ecosystem services for the host. First, future studies should always consider using fish of different age groups to gain a full understanding of gut microbial networks. Second, management of the keystone taxa, even those that are only present at a low abundance, during the adult stage may be a viable pathway to maintain gut ecosystem stability. This study greatly expands our current knowledge regarding gut ecosystem stability in terms of ecological networks affected by fish development, and also highlights potential directions for gut microbial management in humans and other animals.

Keywords: ecosystem stability; gut microbiota; keystone taxa; microbial interactions; zebrafish.


Conflict of interest statement

The authors declare no conflict of interest.

Figures

FIG 1
FIG 1
Sampling design and the diversity patterns of gut microbiota across zebrafish development from 12 to 98 days post-hatching (dph), which was divided into three stages as referred to in our previous study (5) according to the community patterns of gut microbiota. (a) Number of zebrafish individuals collected as replicates for each sampling point. To decrease the possible effects of diets, which changed more frequently before 12 dph, we chose the 12 dph as the first sampling point to analyze zebrafish gut microbiota. The intervals for most sampling points were 1 week, and different intervals (1 to 14 days) were also applied occasionally to address gut microbial variations within different days across zebrafish development. At each sampling point, we randomly selected at least three zebrafish individuals from each tank (i.e., 9 replicates from 3 tanks). However, to visualize the interactions and stability of gut microbiota by ecological network analysis, we increased the replicates from 27 to 90 at the sampling points of 12, 20, 27, 42, 56, 70, and 98 dph. Many more but different replicates were applied for these seven sampling points to decrease the possible sample effects involved in the network analysis. (b) Alpha diversity succession as visualized by the sampling points, and the adjusted R2 are given together with the corresponding P values (* 0.01 < P < 0.05).
FIG 2
FIG 2
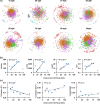
Succession and stability of gut microbial networks across zebrafish development (only for sampling points with ≥ 27 replicates). (a) Visualization of constructed molecular ecological networks generated using the Molecular Ecological Network Analysis (MENA) pipeline based on OTU relative abundances of gut microbiota. Each node represents 1 OTU, and each link represents a correlation between a pair of nodes. Large network modules (≥ 5 nodes) are shown in different colors, and smaller modules (2 to 4 nodes) are shown in gray. Details of network topological attributes are listed in Table S2. (b) Development-dependent changes of network topology included nodes, links, average degree (avgK), and connectedness (Con). In each panel, filled symbols represent networks involved in the significant (P < 0.05) linear regression as shown by the solid line (including 20, 27, 42, 56, and 70 dph), and dotted open symbols represent those that were non-significant (P > 0.05). The adjusted R2 are given together with the corresponding P values (*** P < 0.001). (c) Network stability, as visualized by sampling points, and the adjusted R2 are given together with the corresponding P values (solid lines: * 0.01 < P < 0.05; dotted lines: P > 0.05). The positive cohesion (P) and negative cohesion (N) reflect the magnitude of cooperation and competitive interactions, respectively. A community with a lower value of P or a higher relative fraction of |negative cohesion|: positive cohesion (N:P) indicated a more stable community. The vulnerability reflects how fast the consequence of microbial interactions affect either parts of or the entire network. Generally, a lower network vulnerability suggests a more stable community.
FIG 3
FIG 3
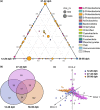
Distribution traits of the networked communities (assemblages of microbial taxa detected in the stage-dependent networks, and zebrafish development were divided into three stages as referred to in our previous study [5] according to the community patterns of gut microbiota). (a) Ternary plots of all networked OTUs (if an OTU was absent from a network, its abundance was set to 0 in all samples at that stage). Each circle represents an OTU, and its size represents the weighted average abundance. The position of each circle was determined by the contribution of the indicated compartments to the total relative abundance. (b) Venn diagrams showing the number of shared and unique network OTUs among developmental stages. (c) DCA ordination showing the dissimilarity of networked communities among developmental stages.
FIG 4
FIG 4
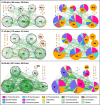
Network modules preserved across developmental stages. Large modules, with ≥ 5 nodes, are shown in circular layout for the constructed networks. Colors of nodes indicate major phyla (Proteobacteria further divided into classes). Red and green links indicate positive and negative correlations, respectively. The corresponding pie charts on the right panel for each stage-dependent network showing the proportions of major phyla (Proteobacteria further divided into classes). The module ID of each large module is indicated by M1 to M15.
FIG 5
FIG 5
Classification of nodes to identify potential keystone OTUs within the stage-dependent gut microbial networks. Zi > 2.5 and Pi > 0.62 indicates network hubs (highly connected nodes within entire network); Zi > 2.5 and Pi ≤ 0.62 indicate module hubs (highly connected nodes within modules); Zi ≤ 2.5 and Pi > 0.62 indicate connectors (nodes that connect modules); and Zi ≤ 2.5 and Pi ≤ 0.62 indicate peripherals (nodes connected in modules with few outside connections). The potential keystone taxa generally include network hubs, module hubs, and connectors.
FIG 6
FIG 6
Variation of diversity and network stability of gut microbiota across zebrafish developmental stages. (a) Alpha diversity as visualized by zebrafish developmental stages. (b) Network stability as visualized by zebrafish developmental stages. Each error bar corresponds to the standard error. The variations among stages were tested through an ANOVA with least-significant-difference (LSD) tests. The presence of different letters denotes significant differences among stages, whereas the same letter indicates no statistical difference. However, the vulnerability of a network is indicated by the maximal vulnerability of nodes in the network. As there is no ANOVA test for the vulnerability, no letters are given for the vulnerability panel. The positive cohesion (P) and negative cohesion (N) reflect the magnitude of cooperation and competitive interactions, respectively. A community with a lower value of P or a higher relative fraction of |negative cohesion|: positive cohesion (N:P) indicates a more stable community. The vulnerability reflects how fast the consequence of microbial interactions affect either parts of or the entire network, and a lower network vulnerability suggests a more stable community.
FIG 7
FIG 7
Effects of the major factors on the network stability as determined by the structural equation model (SEM) analysis. (a) Partial least-squares-path models showing the cascading relationships of different factors. Single-headed arrows indicate the hypothesized direction of causation. Rectangles represent the investigated components, and the numbers in the gray rectangles represent the positive relationship between manifest variables, which indicate that the manifest variables could reflect latent variables as well. Red and green solid lines with arrows indicate significant positive and negative relationships, respectively. The line width is proportional to the strength of the relationship. The numbers associated with arrows represent the direct effects of a latent variable to another latent variable. For example, the direct effect of zebrafish development to network stability is 0.44, and such values were calculated by constructing a reasonable data linear matrix using R packages of “plsmp.” The positive cohesion (P) and negative cohesion (N) reflects the magnitude of cooperation and competitive interactions, respectively. As the communities with lower values of P and N are more stable, their values were multiplied by −1 to make sure the stability retained the same trend with the variation of cohesion. (b) Standardized effects of different factors on the network stability or those from zebrafish development. The effect is called “standard effect” because its value was converted to range between −1 and 1. The direct effects were given by the path coefficients, while the indirect effects were obtained as the result of path coefficients by taking an indirect path. The total effects are the sum of both the direct and indirect effects. Asterisks indicate the statistical significance (*** P < 0.001, and ** 0.001 < P < 0.01); dph, days post-hatching; PD, phylogenetic distance; MPD, mean pairwise distance.

Similar articles

Cited by

References

    1. Roeselers G, Mittge EK, Stephens WZ, Parichy DM, Cavanaugh CM, Guillemin K, Rawls JF. 2011. Evidence for a core gut microbiota in the zebrafish. ISME J 5:1595–1608. doi:10.1038/ismej.2011.38. - DOI - PMC - PubMed
    1. Wallace KN, Pack M. 2003. Unique and conserved aspects of gut development in zebrafish. Dev Biol 255:12–29. doi:10.1016/S0012-1606(02)00034-9. - DOI - PubMed
    1. Stephens WZ, Burns AR, Stagaman K, Wong S, Rawls JF, Guillemin K, Bohannan BJM. 2016. The composition of the zebrafish intestinal microbial community varies across development. ISME J 10:644–654. doi:10.1038/ismej.2015.140. - DOI - PMC - PubMed
    1. Yan Q, Li J, Yu Y, Wang J, He Z, Van Nostrand JD, Kempher ML, Wu L, Wang Y, Liao L, Li X, Wu S, Ni J, Wang C, Zhou J. 2016. Environmental filtering decreases with fish development for the assembly of gut microbiota. Environ Microbiol 18:4739–4754. doi:10.1111/1462-2920.13365. - DOI - PubMed
    1. Xiao F, Zhu W, Yu Y, He Z, Wu B, Wang C, Shu L, Li X, Yin H, Wang J, Juneau P, Zheng X, Wu Y, Li J, Chen X, Hou D, Huang Z, He J, Xu G, Xie L, Huang J, Yan Q. 2021. Host development overwhelms environmental dispersal in governing the ecological succession of zebrafish gut microbiota. NPJ Biofilms Microbiomes 7:5. doi:10.1038/s41522-020-00176-2. - DOI - PMC - PubMed

Publication types

LinkOut - more resources