. 2022 Apr 13;96(7):e0023522.
doi: 10.1128/jvi.00235-22. Epub 2022 Mar 21.

Presence of Natural Killer B Cells in Simian Immunodeficiency Virus-Infected Colon That Have Properties and Functions Similar to Those of Natural Killer Cells and B Cells but Are a Distinct Cell Population

Affiliations

Presence of Natural Killer B Cells in Simian Immunodeficiency Virus-Infected Colon That Have Properties and Functions Similar to Those of Natural Killer Cells and B Cells but Are a Distinct Cell Population

Andrew Cogswell et al. J Virol. .

Abstract

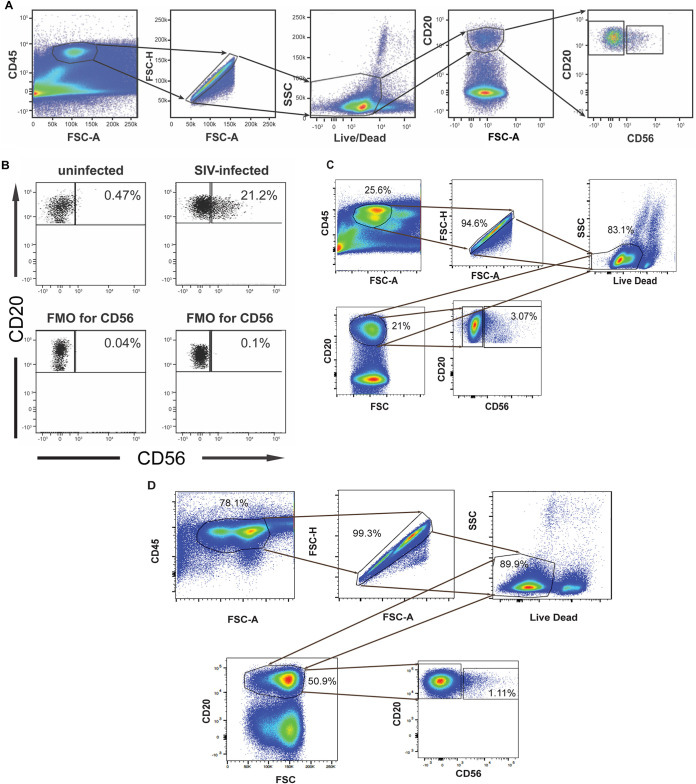
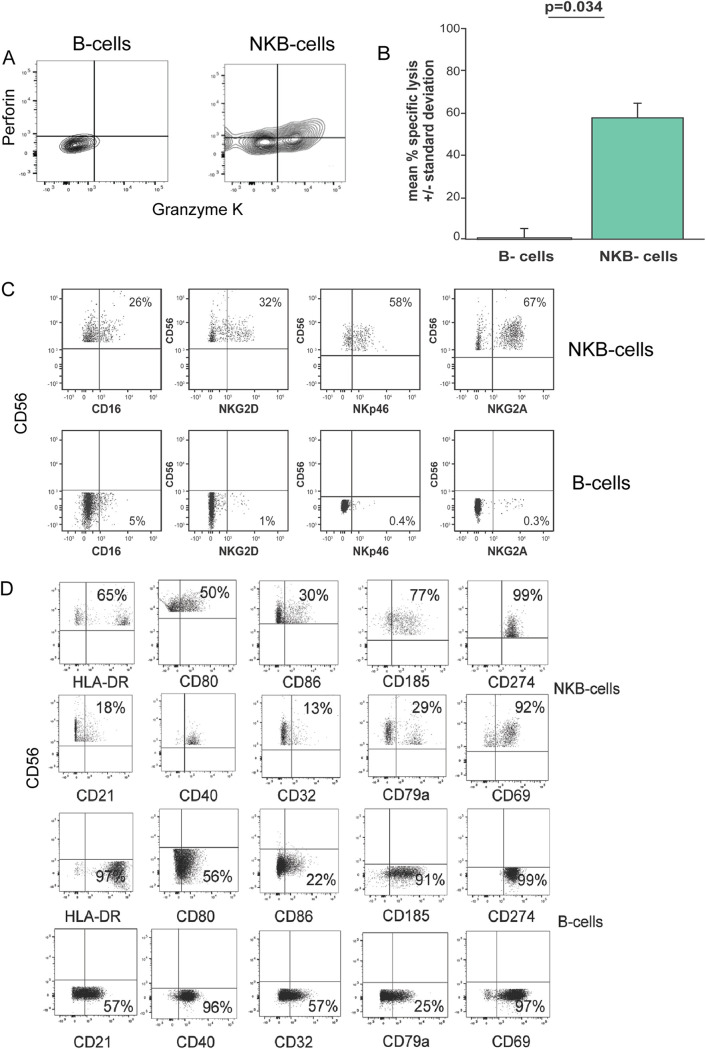
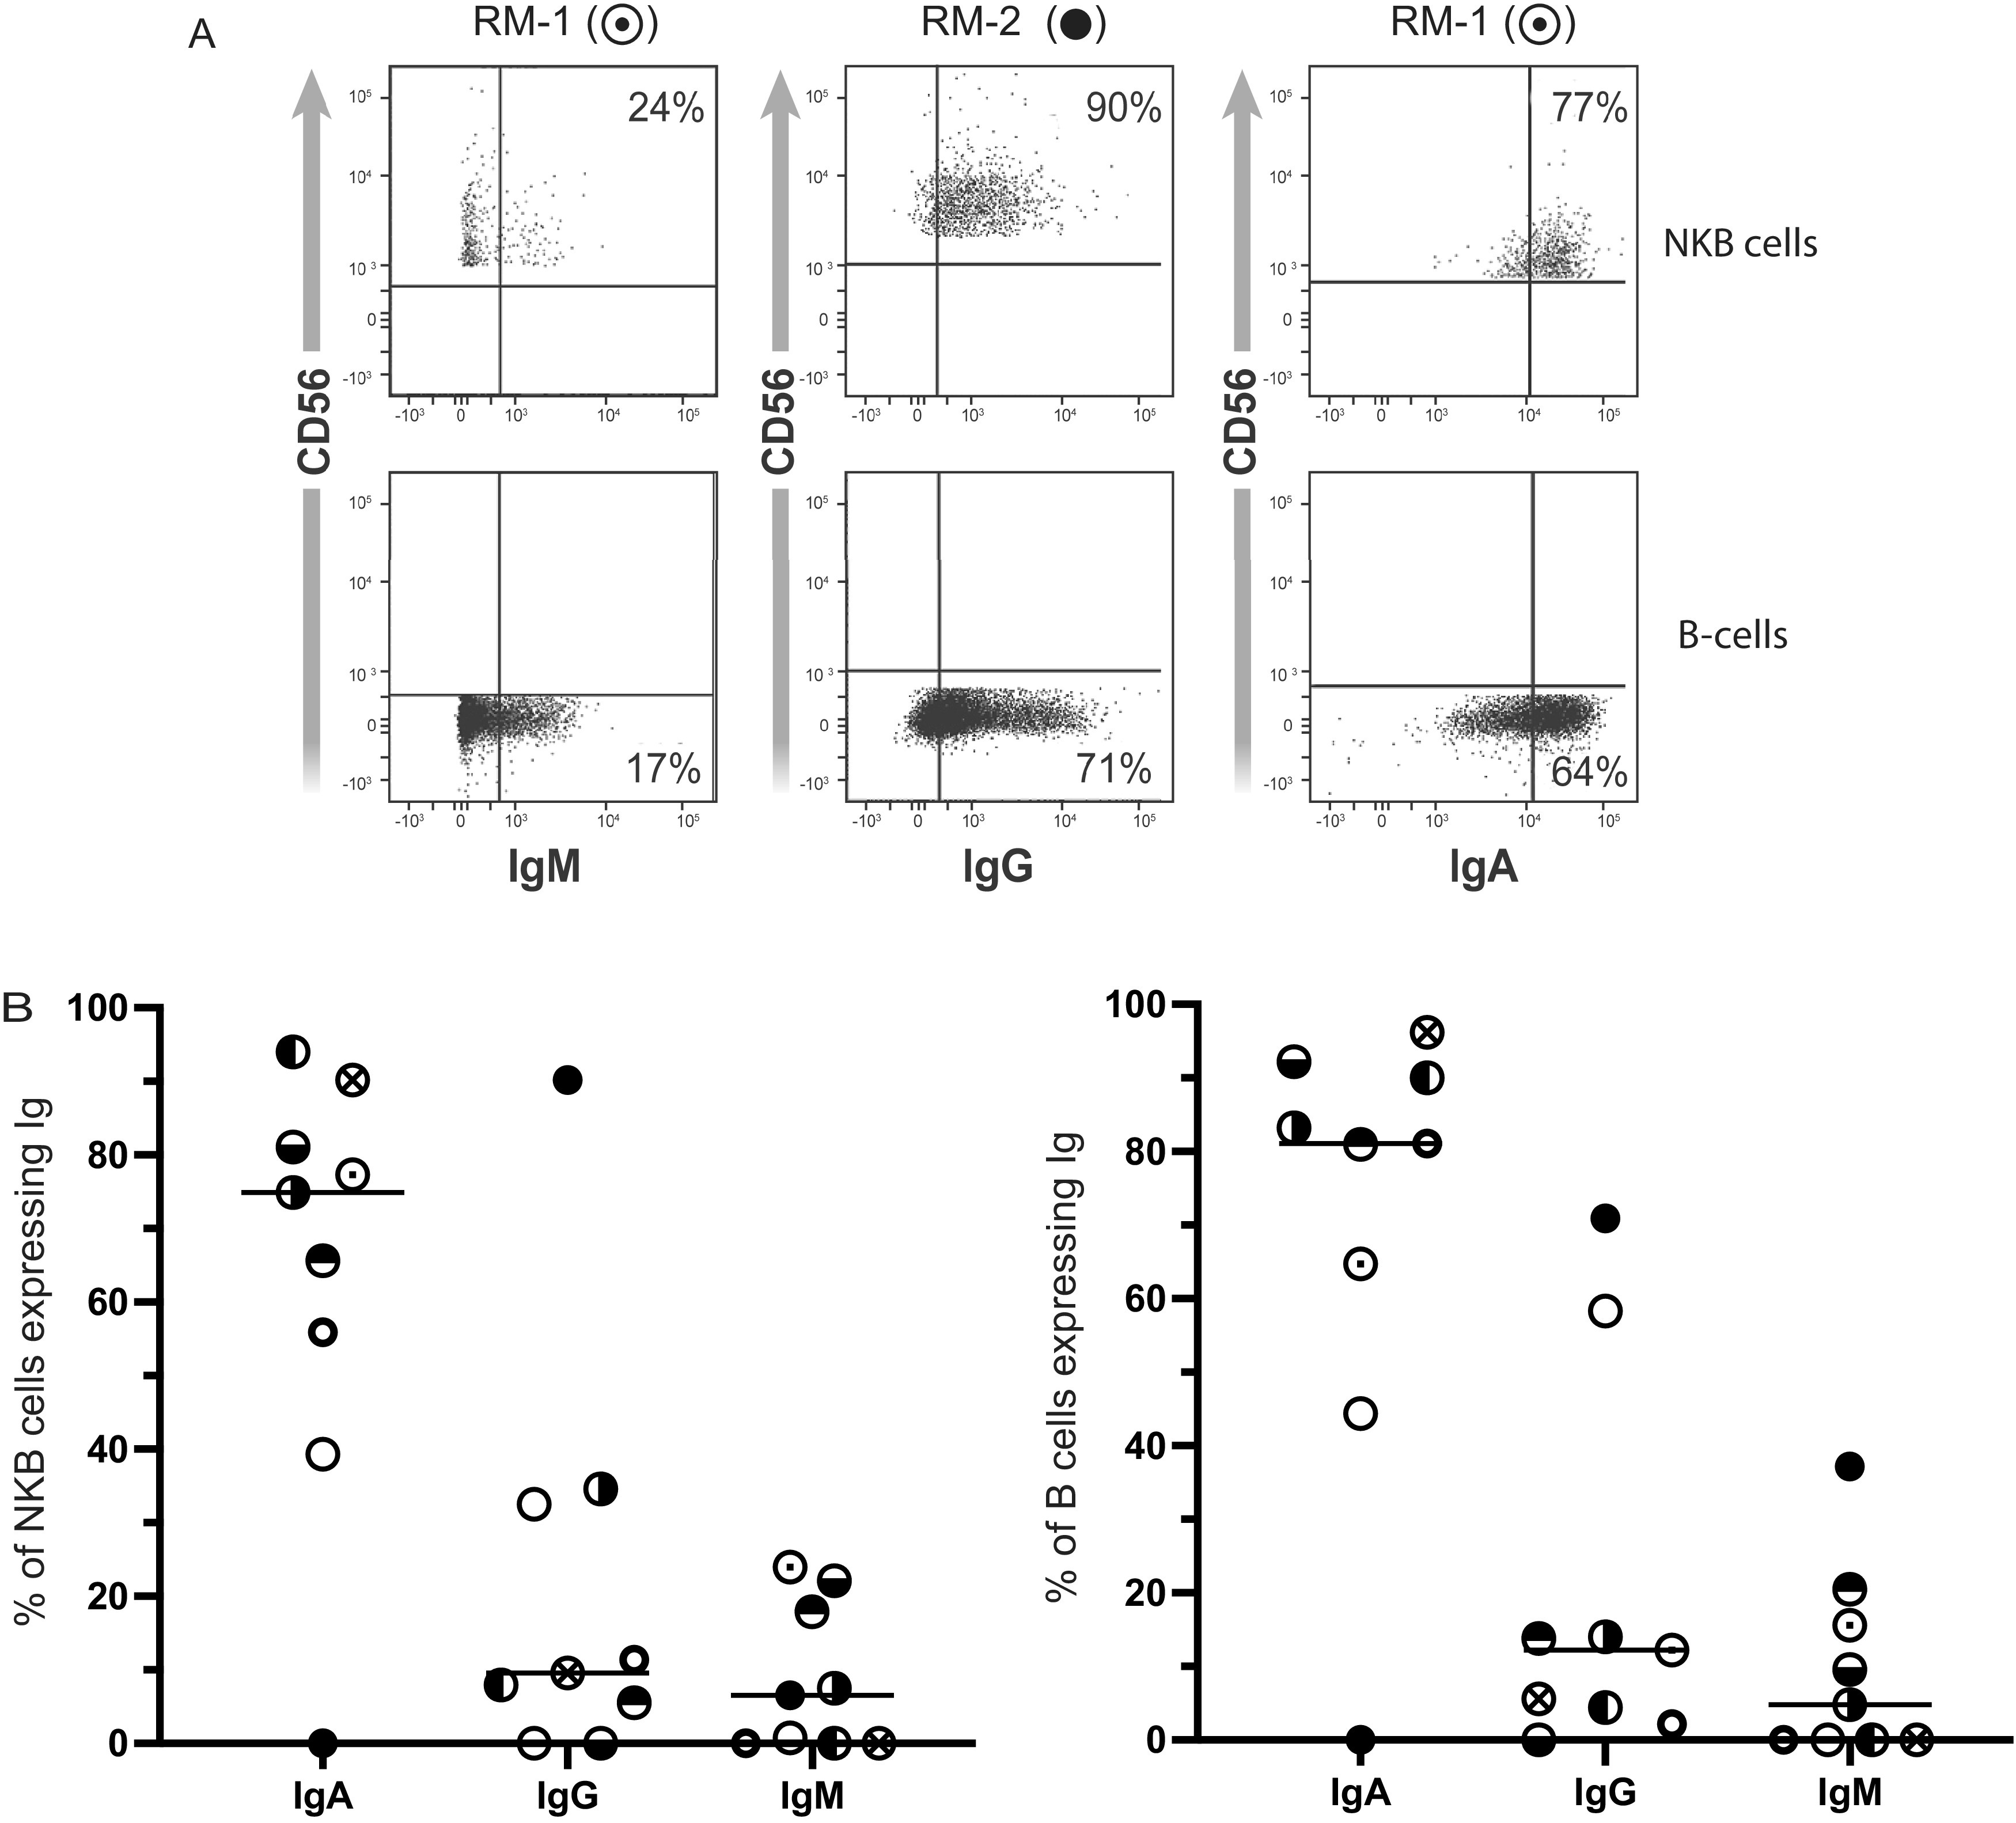
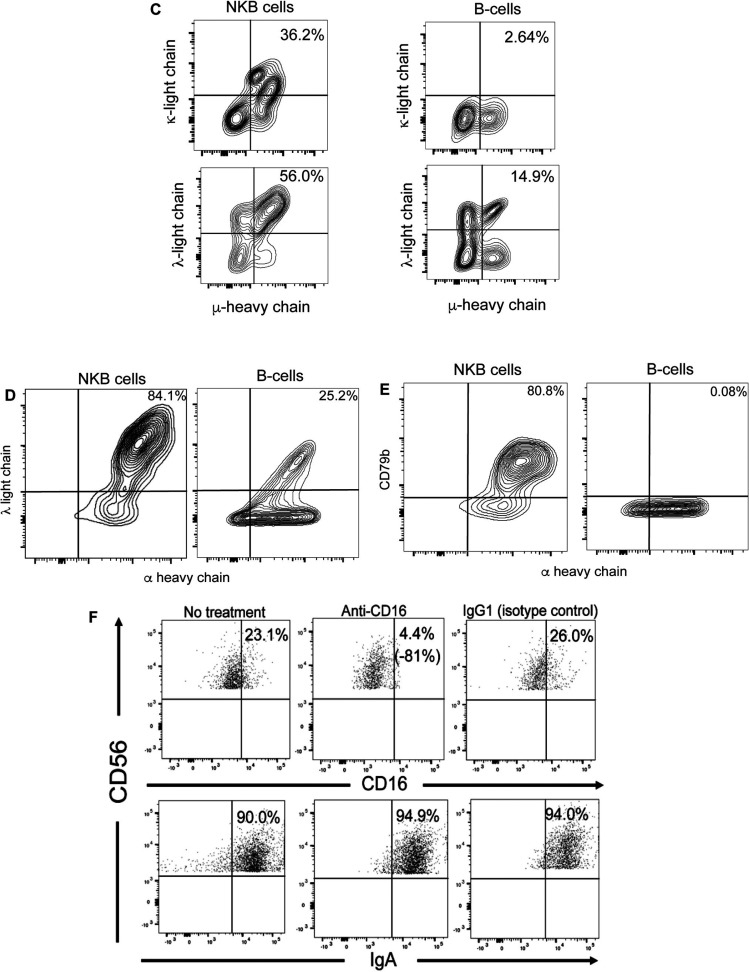
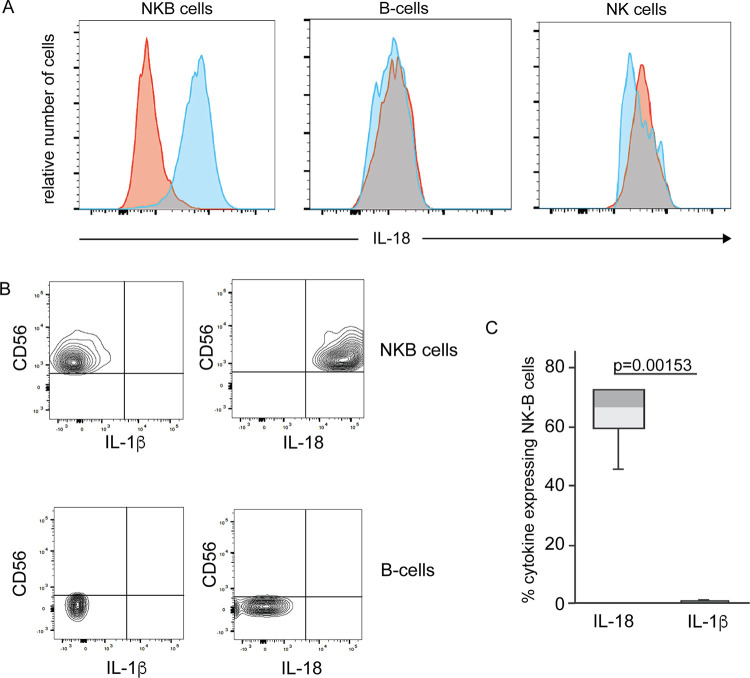
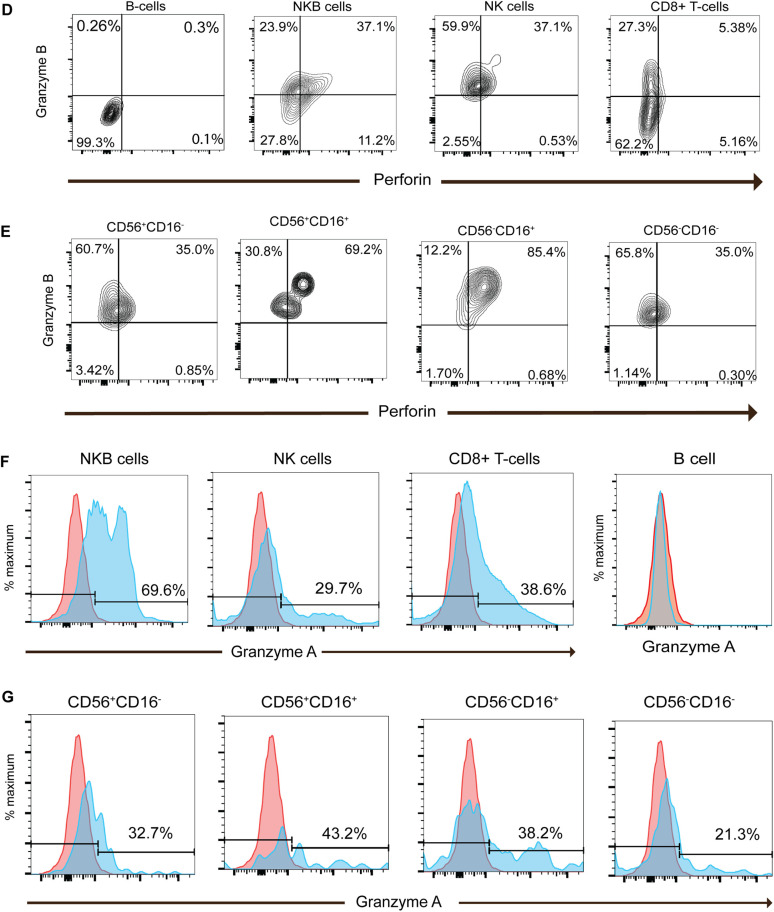
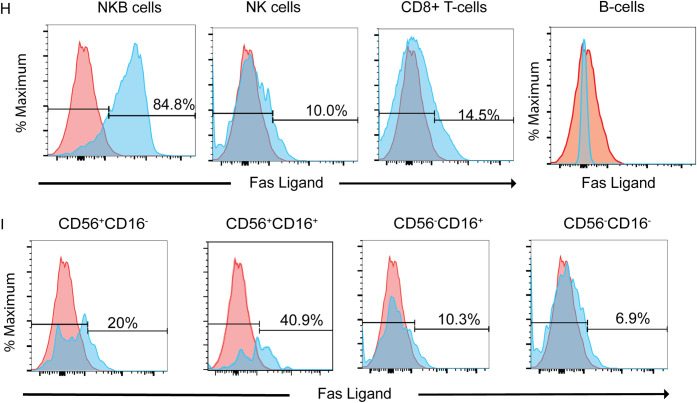
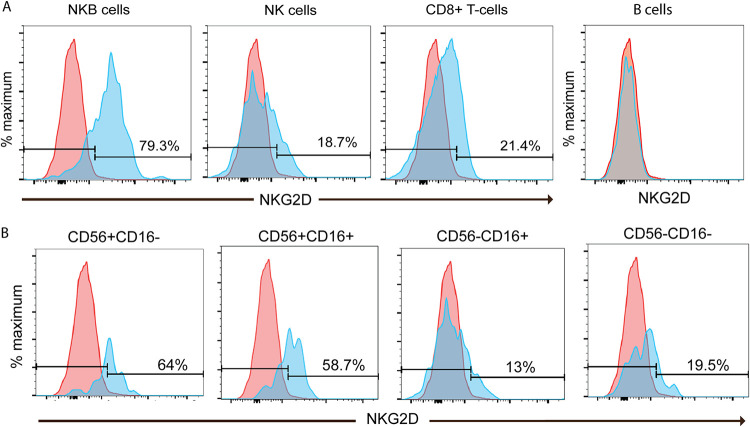
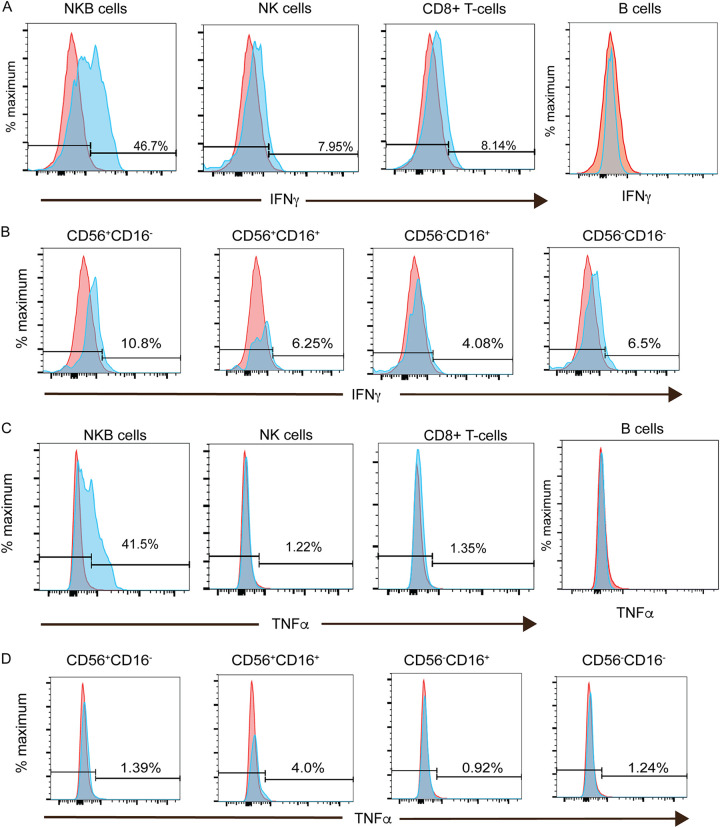
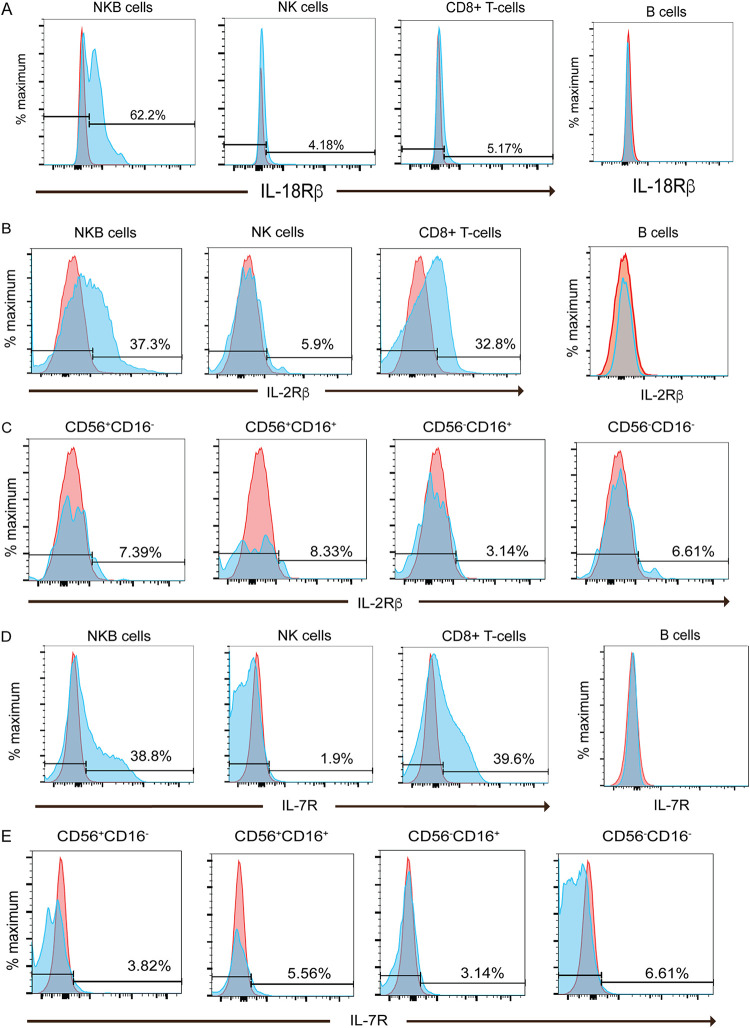
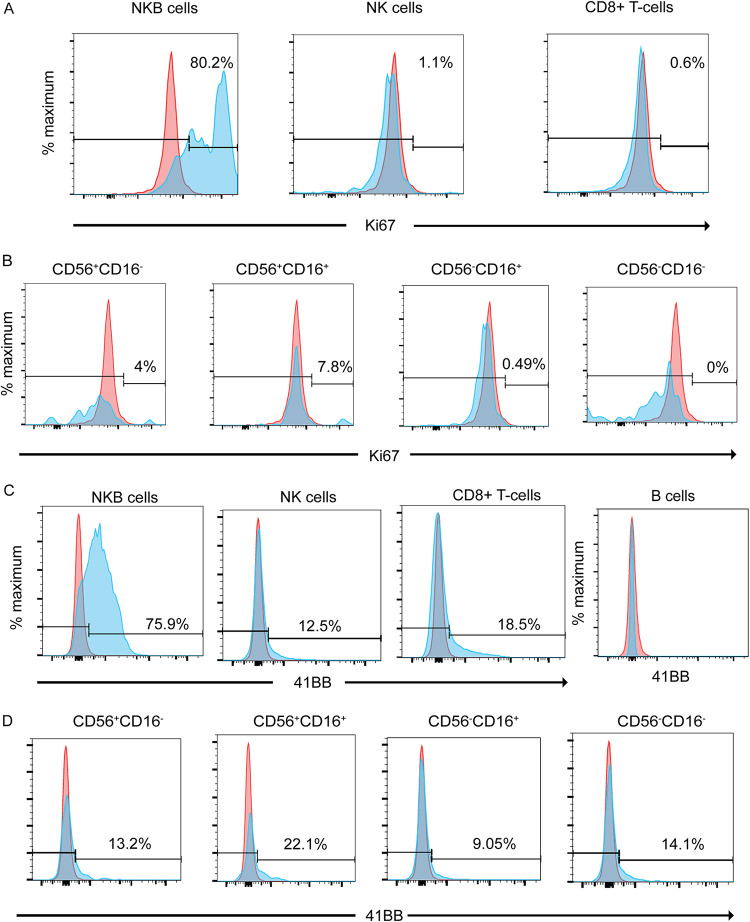
Here, we report the appearance of natural killer B (NKB) cells within the colon during simian immunodeficiency virus (SIV) infection of susceptible monkeys. Using RNA sequencing (RNAseq) and flow cytometry, we show that NKB cells are unique cells with features and functions of both NK and B cells. NKB cells express receptors and ligands found on B cells that are important for (i) antigen presentation; (ii) activities associated with class switching, affinity maturation, and B-cell memory formation in secondary lymphoid follicles; and (iii) antigen recognition. The predominant immunoglobulins (Igs) expressed on NKB cells are IgA, although NKB cells can express surface IgM and IgG. There is dominant lambda expression over the kappa light chain characteristic of mucosal B cells. In addition to B-cell aspects, NKB cells express NK cell activation receptors and Fas ligand. We show in this study that NKB cells express perforin and granzymes and lyse cells in a lytic assay. In addition to NK cell cytolytic function, NKB cells also produce the inflammatory cytokines interferon gamma, tumor necrosis factor alpha, and interleukin-18 (IL-18). Finally, we noted the increased capacity of NKB cells to proliferate compared to NK cells and CD8+ T cells from the SIV-infected colon. The increased proliferation and inflammatory cytokine production may be related to the relatively high expression levels of IL-15 receptor beta, IL-7 receptor, IL-18 receptor, and 41BB relative to the same receptors on CD8 and NK cells. The properties of NKB cells may point to their role in the enhanced inflammation observed in the SIV-infected gut. IMPORTANCE There is low-level but significant mucosal inflammation in the gastrointestinal tract secondary to human immunodeficiency virus (HIV) infection that has long-term consequences for the infected host. This inflammation most likely originates from the immune response that appears as a consequence of HIV. Here, we show in an animal model of HIV that the chronically SIV-infected gut contains cytotoxic natural killer B cells that produce inflammatory cytokines and proliferate during infection.

Keywords: B cells; cytokines; cytotoxic; gastrointestinal; gut inflammation; human immunodeficiency virus; immunoglobulin A; mucosal immunity; natural killer cells; simian immunodeficiency virus.


Conflict of interest statement

The authors declare no conflict of interest.

Figures

FIG 1
FIG 1
NKB cells are present in SIV-infected but barely present in uninfected colons. (A) The approach used to identify NKB cells by flow cytometry within the colons of SIV-infected macaques. (B) CD45+ CD20+ CD56+ cells within the lamina propria of the colons of uninfected macaques and SIV-infected macaques. (C) CD45+ CD20+ CD56+ cells within acutely SIV-infected colons. (D) CD45+ CD20+ CD56+ cells within SIV-infected mesocolic lymph nodes. FSC, forward scatter; SSC, side scatter; A, area; H, height.
FIG 2
FIG 2
NKB cells in the SIV-infected colon are cytolytic and possess markers and receptors found on NK and B cells. (A) Intracellular staining of perforin and granzyme K within B cells and NKB cells. (B) Mean specific lysis of K562 cells in a 4-h cytolytic assay using B cells and NKB cells as effector cells. Error bars are the standard deviations from three separate wells of target and effector cells at a 1:1 effector-to-target cell ratio. (C) Frequency of NKB cells expressing markers and receptors present on NK cells. Results for NKB cells are shown in the top row, and results for B cells are shown in the bottom row. (D) Frequency of NKB cells expressing markers and receptors typically expressed on B cells. Results for NKB cells are shown in the top two rows. Results for B cells are shown in the bottom two rows.
FIG 3
FIG 3
NKB cells in the SIV-infected colon possess immunoglobulin on their cell surface. (A) IgM, IgG, and IgA expression among NKB cells (top row) and B cells (bottom row) from 2 different SIV-infected colons. Symbols above each figure represent the symbols indicated in panel B. (B) Percentages of IgA, IgG, and IgM expressed by NKB cells and B cells among 9 different SIV-infected colons. Each symbol represents a different infected colon. (C) NKB and B cells stained for the surface λ or κ light chains and μ heavy chain. (D) NKB and B cells stained for the surface α heavy chain and λ light chain. (E) NKB and B cells stained for the surface α heavy chain and intracellular CD79b. (F) Cells from the colon were surface stained to identify NKB cells and then exposed to unlabeled anti-CD16 antibody or IgG1 (isotype control) for 30 min at 4°C. The cells were then stained with fluorochrome-conjugated anti-CD16 (same clone as the one for the unlabeled antibodies) or anti-IgA antibodies used to identify surface IgA.
FIG 3
FIG 3
NKB cells in the SIV-infected colon possess immunoglobulin on their cell surface. (A) IgM, IgG, and IgA expression among NKB cells (top row) and B cells (bottom row) from 2 different SIV-infected colons. Symbols above each figure represent the symbols indicated in panel B. (B) Percentages of IgA, IgG, and IgM expressed by NKB cells and B cells among 9 different SIV-infected colons. Each symbol represents a different infected colon. (C) NKB and B cells stained for the surface λ or κ light chains and μ heavy chain. (D) NKB and B cells stained for the surface α heavy chain and λ light chain. (E) NKB and B cells stained for the surface α heavy chain and intracellular CD79b. (F) Cells from the colon were surface stained to identify NKB cells and then exposed to unlabeled anti-CD16 antibody or IgG1 (isotype control) for 30 min at 4°C. The cells were then stained with fluorochrome-conjugated anti-CD16 (same clone as the one for the unlabeled antibodies) or anti-IgA antibodies used to identify surface IgA.
FIG 4
FIG 4
NKB cells but not NK cells or B cells in the SIV-infected colon express interleukin-18. (A) Histograms of CD45+ CD20+ CD56+ (NKB), CD45+ CD20+ CD56 and CD45+ CD20 CD56+ (NK) cells from an SIV-infected colon stained for interleukin-18 (IL-18) (blue histograms). Fluorescence-minus-one-stained cells were used as controls (red histograms). (B) Example of two-dimensional (2D) plots of CD56 versus IL-18 or IL-1β within NKB cells (top row) and B cells (bottom row). (C) Percentage of NKB cells expressing IL-18 and IL-1β within six SIV-infected colons. The horizontal lines in the boxes indicate the medians, boxes are the upper and lower quartiles, and vertical lines indicate variability outside the upper and lower quartiles. Individual points are outliers. The P values for statistical significance were determined using a Mann-Whitney U test. The P value threshold for significance was <0.05.
FIG 5
FIG 5
Frequency of NKB cells relative to NK cells and CD8+ T cells in the SIV-infected colon that express cytolytic molecules. (A) The approach used to identify NKB cell (CD45+ CD20+ CD56+) and NK cell (CD45+ CD202 CD3 CD8a+ NKG2A/C+) subsets based on CD56 and CD16 staining by flow cytometry within the colons of SIV-infected macaques. (B) Gating strategy for NKB cells not expressing CD3. (C) Gating strategy used for identifying CD8+ T cells. (D) NKB cells, NK cells, and CD8+ T cells were evaluated by flow cytometry for the intracellular expression of perforin and granzyme B. Gates were set based on the intracellular expression of perforin and granzyme B within B cells. (E) Perforin and granzyme B coexpression within NK cell (NKG2A/C and CD8a CD3 CD20) subsets based on the differential expression of CD56 and CD16. Gates were set based on the intracellular expression of perforin and granzyme B within B cells. (F) NKB cells, NK cells, and CD8+ T cells were evaluated by flow cytometry for the intracellular expression of granzyme A (blue histograms). Gates were set based on granzyme A expression within B cells (red histograms), where expression was similar to that for the FMO control. (G) Granzyme A expression was measured within the various NK cell subsets (blue histogram). Gates were set based on granzyme A expression within B cells (red histograms). (H) NKB cells, NK cells, and CD8+ T cells were evaluated for Fas ligand (FasL) surface expression by flow cytometry (blue histograms). Gates were set based on FasL expression within B cells (red histograms), where expression was within the FMO control. (I) FasL expression on NK cell subsets based on the differential expression of CD56 and CD16 (blue histograms). Gates were set based on FasL expression on B cells (red histograms).
FIG 5
FIG 5
Frequency of NKB cells relative to NK cells and CD8+ T cells in the SIV-infected colon that express cytolytic molecules. (A) The approach used to identify NKB cell (CD45+ CD20+ CD56+) and NK cell (CD45+ CD202 CD3 CD8a+ NKG2A/C+) subsets based on CD56 and CD16 staining by flow cytometry within the colons of SIV-infected macaques. (B) Gating strategy for NKB cells not expressing CD3. (C) Gating strategy used for identifying CD8+ T cells. (D) NKB cells, NK cells, and CD8+ T cells were evaluated by flow cytometry for the intracellular expression of perforin and granzyme B. Gates were set based on the intracellular expression of perforin and granzyme B within B cells. (E) Perforin and granzyme B coexpression within NK cell (NKG2A/C and CD8a CD3 CD20) subsets based on the differential expression of CD56 and CD16. Gates were set based on the intracellular expression of perforin and granzyme B within B cells. (F) NKB cells, NK cells, and CD8+ T cells were evaluated by flow cytometry for the intracellular expression of granzyme A (blue histograms). Gates were set based on granzyme A expression within B cells (red histograms), where expression was similar to that for the FMO control. (G) Granzyme A expression was measured within the various NK cell subsets (blue histogram). Gates were set based on granzyme A expression within B cells (red histograms). (H) NKB cells, NK cells, and CD8+ T cells were evaluated for Fas ligand (FasL) surface expression by flow cytometry (blue histograms). Gates were set based on FasL expression within B cells (red histograms), where expression was within the FMO control. (I) FasL expression on NK cell subsets based on the differential expression of CD56 and CD16 (blue histograms). Gates were set based on FasL expression on B cells (red histograms).
FIG 6
FIG 6
Frequency of NKB cells from SIV-infected colons expressing surface NKG2D. (A) NKB cells, NK cells, and CD8+ T cells were evaluated for the surface expression of NKG2D by flow cytometry (blue histograms). Gates were set based on NKG2D expression within B cells (red histograms), where expression was within the FMO control. (B) NKG2D expressed on NK cell (NKG2A/C+ CD8α CD3 CD20) subsets from SIV-infected colons based on the differential expression of CD56 and CD16 (blue histograms). Gates were set based on the surface expression of NKG2D on B cells (red histograms).
FIG 7
FIG 7
Frequency of NKB cells relative to NK cells and CD8+ T cells in the SIV-infected colon expressing interferon gamma and tumor necrosis factor alpha. (A and C) NKB cells, NK cells, and CD8+ T cells were evaluated by flow cytometry for the intracellular expression of IFN-γ (A) and TNF-α (C) (blue histograms). Gates were set based on the intracellular expression of IFN-γ and TNF-α within B cells (red histograms), where expression was within the FMO controls. (B and D) IFN-γ (B) and TNF-α (D) within NK cell (NKG2A/C+ CD8α+ CD3 CD20) subsets based on the differential expression of CD56 and CD16 (blue histogram). Gates were set based on NKG2D expression on B cells (red histograms).
FIG 8
FIG 8
Frequency of NKB cells relative to NK cells and CD8+ T cells in the SIV-infected colon expressing surface interleukin-18 receptor beta, interleukin-2 receptor beta, and interleukin-7 receptor. (A) NKB cells, NK cells, and CD8+ T cells were evaluated by flow cytometry for the surface expression of IL-18Rβ (blue histograms). Gates were set based on the expression of IL-18Rβ within and on B cells (red histograms). (B and D) NKB cells, NK cells, and CD8+ T cells were evaluated by flow cytometry for the surface expression of IL-2Rβ (B) and IL-7R (D) (blue histograms). Gates were set based on the intracellular expression of IL-2Rβ and IL-7R within B cells (red histograms). (C and E) IL-2Rβ (C) and IL-7R (E) on NK cell (NKG2A/C+ CD8α+ CD3 CD20) subsets based on the differential expression of CD56 and CD16 (blue histograms). Gates were set based on the intracellular expression of IL-2Rβ and IL-7R within B cells (red histograms).
FIG 9
FIG 9
41BB surface expression and proliferation of NKB cells relative to NK cells and CD8+ T cells in the SIV-infected colon. (A) NKB cells, NK cells, and CD8+ T cells within SIV-infected colons were evaluated for proliferation by flow cytometry by detecting the marker Ki67 (blue histograms). (B) Ki67 was also assessed in NK cell (NKG2A/C+ CD8α+ CD3 CD20) subsets based on the differential expression of CD56 and CD16 (blue histograms). (C) Flow cytometry was used to evaluate the surface expression of 41BB on NKB cells, NK cells, and CD8+ T cells within the SIV-infected colon (blue histograms). (D) Surface expression of 41BB on NK cell subsets in the SIV-infected colon (blue histograms). Gates were set based on the expression of Ki67 and 41BB within and on B cells (red histograms).

Similar articles

Cited by

References

    1. Weaver LT, Austin S, Cole TJ. 1991. Small intestinal length: a factor essential for gut adaptation. Gut 32:1321–1323. 10.1136/gut.32.11.1321. - DOI - PMC - PubMed
    1. Macdonald TT. 2008. The gut is still the biggest lymphoid organ in the body. Mucosal Immunol 1:246–247.
    1. Pabst R, Russell MW, Brandtzaeg P. 2008. Tissue distribution of lymphocytes and plasma cells and the role of the gut. Trends Immunol 29:206–208. 10.1016/j.it.2008.02.006. - DOI - PubMed
    1. Chassaing B, Kumar M, Baker MT, Singh V, Vijay-Kumar M. 2014. Mammalian gut immunity. Biomed J 37:246–258. 10.4103/2319-4170.130922. - DOI - PMC - PubMed
    1. Zhou B, Yuan Y, Zhang S, Guo C, Li X, Li G, Xiong W, Zeng Z. 2020. Intestinal flora and disease mutually shape the regional immune system in the intestinal tract. Front Immunol 11:575. 10.3389/fimmu.2020.00575. - DOI - PMC - PubMed

MeSH terms