

Impact of Early ARV Initiation on Relative Proportions of Effector and Regulatory CD8 T Cell in Mesenteric Lymph Nodes and Peripheral Blood During Acute SIV Infection of Rhesus Macaques
- PMID: 35311550
- PMCID: PMC9006892
- DOI: 10.1128/jvi.00255-22
Impact of Early ARV Initiation on Relative Proportions of Effector and Regulatory CD8 T Cell in Mesenteric Lymph Nodes and Peripheral Blood During Acute SIV Infection of Rhesus Macaques
Abstract
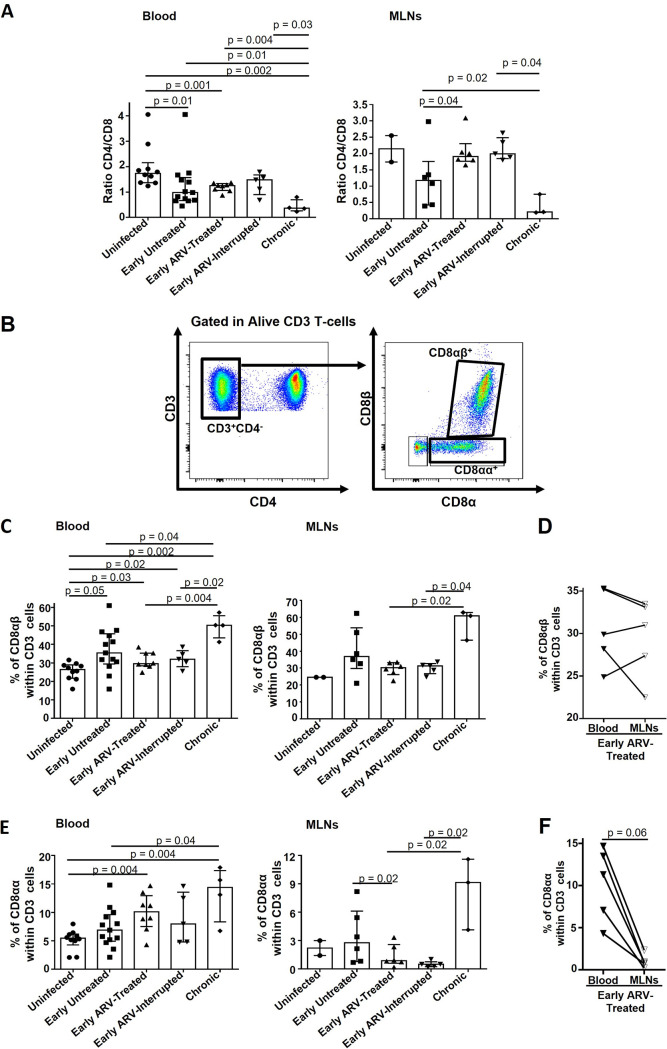
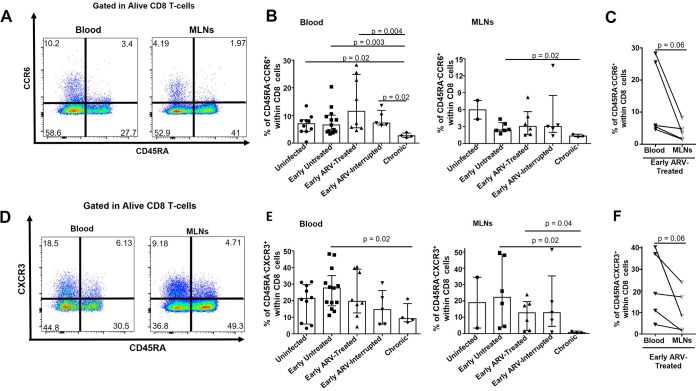
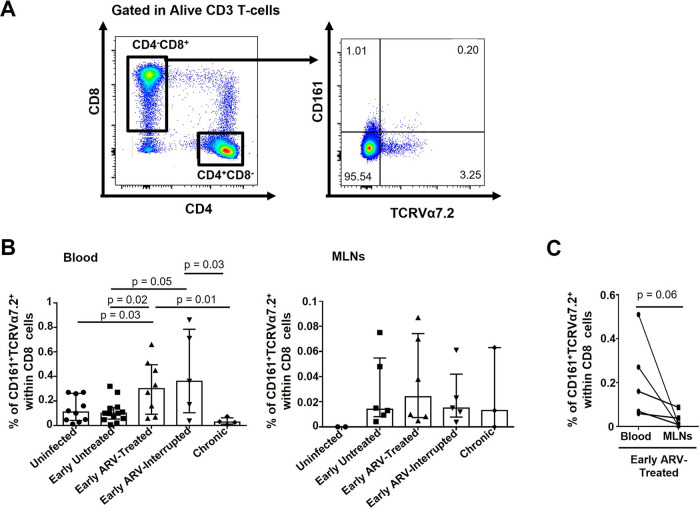
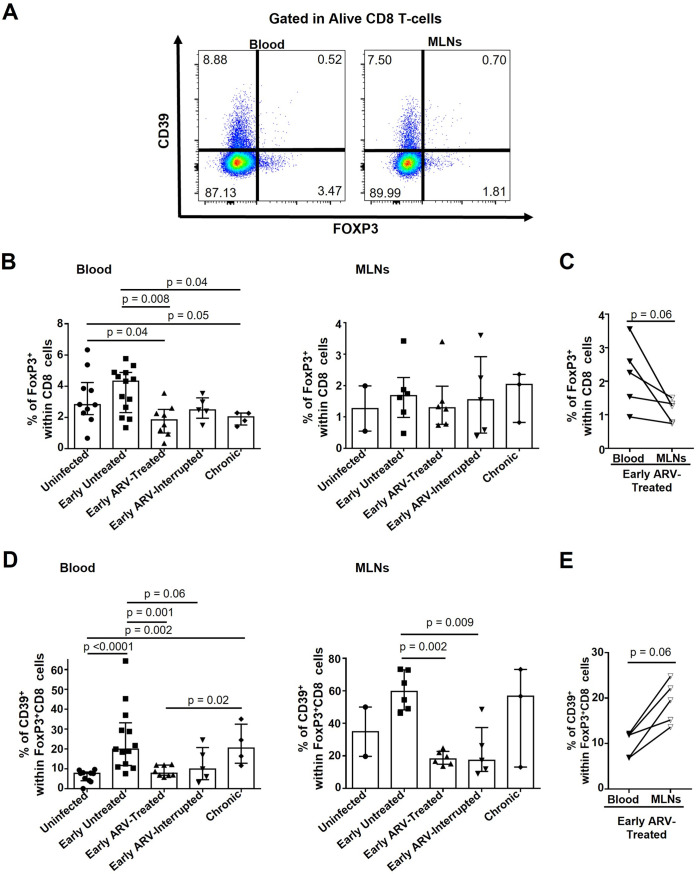
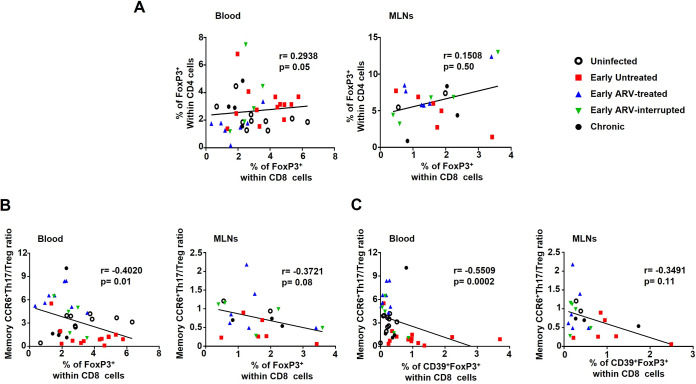
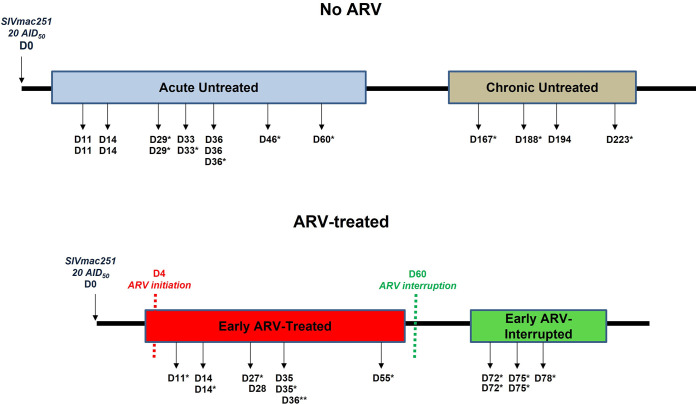
CD8 T cells are key players in the clearance of human immunodeficiency virus (HIV)-infected cells, such that CD8 T-cell dysfunction contributes to viral persistence despite antiretroviral (ARV) therapy. Mesenteric lymph nodes (MLNs) are major sites of gut mucosal immunity. While different CD8 T cell subsets such as CD8 alpha-alpha (CD8αα), CD8 alpha-beta (CD8αβ), CD8 regulatory T cells (Treg), and mucosa-associated invariant T cells (MAIT) are present in the gut and exhibit distinct functions, their dynamics remain poorly understood due to the lack of accessibility to these tissues in humans. We thus assessed CD8 T cells in MLNs versus peripheral blood in simian immunodeficiency virus (SIV)-infected rhesus macaques (RMs) following early ARV therapy initiation. SIV infection was associated with an increase over time of both CD8αβ and CD8αα T cells in the blood and MLNs, whereas early ARV initiation significantly decreased the frequencies of CD8αα but not CD8αβ T cells in MLNs. A significant decrease in the expression of chemokine receptors CCR6 and CXCR3 by CD8 T cells, which are essential for T-cell trafficking to the inflammatory sites, was observed in chronically SIV-infected RMs. Surprisingly, while MAIT cells are increased in ARV-treated RMs, their frequencies in MLN are extremely low and were not impacted by ARV. The acute infection resulted in an early CD39+FoxP3+ CD8 Tregs increase in both compartments, which was normalized after early ARV. Frequencies of CD8 Treg cells were positively correlated with frequencies of CD4 Tregs and accordingly negatively correlated with the Th17/Treg ratio in the blood but not in MLNs. Overall, our results underscore the difference in CD8 T-cell subset dynamics in the blood and MLNs. IMPORTANCE Changes in CD8 T-cell subsets during acute SIV/HIV infections and following early ARV initiation in gut lymphoid tissues are poorly understood. Using an acute SIV infection model in rhesus macaques, we assessed the impact of early ARV, initiated 4 days postinfection, on relative proportions of CD8 T-cell subsets in MLNs compared to blood. We found that acute SIV infection and early ARV initiation differentially affect the distribution of effector CD8 T cells, CD8 MAIT cells, and CD8 Tregs in MLNs compared to blood. Overall, early ARV initiation maintains the frequency of effector CD8 T cells while reducing immunosuppressive CD39+ CD8 Tregs. Our study provides deeper insight into the dynamics of the CD8 T-cell compartment in gut mucosal immune surveillance during acute SIV infection and following early ARV initiation.
Keywords: CD8 T cells; CD8 regulatory T cells (CD8 Treg); GALT; early antiretroviral therapy; gut; gut mucosal immunity; human immunodeficiency virus (HIV); simian immunodeficiency virus (SIV).
Conflict of interest statement
The authors declare no conflict of interest.
Figures
Similar articles
-
Double-Negative T-Cells during Acute Human Immunodeficiency Virus and Simian Immunodeficiency Virus Infections and Following Early Antiretroviral Therapy Initiation.Viruses. 2024 Oct 14;16(10):1609. doi: 10.3390/v16101609. Viruses. 2024. PMID: 39459942 Free PMC article.
-
Differential Dynamics of Regulatory T-Cell and Th17 Cell Balance in Mesenteric Lymph Nodes and Blood following Early Antiretroviral Initiation during Acute Simian Immunodeficiency Virus Infection.J Virol. 2019 Sep 12;93(19):e00371-19. doi: 10.1128/JVI.00371-19. Print 2019 Oct 1. J Virol. 2019. PMID: 31315987 Free PMC article.
-
Mucosal T Helper 17 and T Regulatory Cell Homeostasis Correlate with Acute Simian Immunodeficiency Virus Viremia and Responsiveness to Antiretroviral Therapy in Macaques.AIDS Res Hum Retroviruses. 2019 Mar;35(3):295-305. doi: 10.1089/AID.2018.0184. Epub 2019 Jan 2. AIDS Res Hum Retroviruses. 2019. PMID: 30398361 Free PMC article.
-
Walk on the wild side: SIV infection in African non-human primate hosts-from the field to the laboratory.Front Immunol. 2023 Jan 12;13:1060985. doi: 10.3389/fimmu.2022.1060985. eCollection 2022. Front Immunol. 2023. PMID: 36713371 Free PMC article. Review.
-
Monkeying around with MAIT Cells: Studying the Role of MAIT Cells in SIV and Mtb Co-Infection.Viruses. 2021 May 8;13(5):863. doi: 10.3390/v13050863. Viruses. 2021. PMID: 34066765 Free PMC article. Review.
Cited by
-
Optimization and use of near infrared imaging to guide lymph node collection in rhesus macaques (Macaca mulatta).J Med Primatol. 2022 Oct;51(5):270-277. doi: 10.1111/jmp.12605. Epub 2022 Jul 15. J Med Primatol. 2022. PMID: 35841132 Free PMC article.
-
FoxP3+ CD8 T-cells in acute HIV infection and following early antiretroviral therapy initiation.Front Immunol. 2022 Jul 29;13:962912. doi: 10.3389/fimmu.2022.962912. eCollection 2022. Front Immunol. 2022. PMID: 35967314 Free PMC article.
-
Mucosal immunity in acute HIV: a review of recent work.Curr Opin HIV AIDS. 2025 May 1;20(3):193-198. doi: 10.1097/COH.0000000000000917. Epub 2025 Jan 24. Curr Opin HIV AIDS. 2025. PMID: 39903645 Review.
-
Efficient enzyme-free method to assess the development and maturation of the innate and adaptive immune systems in the mouse colon.Sci Rep. 2024 May 14;14(1):11063. doi: 10.1038/s41598-024-61834-5. Sci Rep. 2024. PMID: 38744932 Free PMC article.
-
Double-Negative T-Cells during Acute Human Immunodeficiency Virus and Simian Immunodeficiency Virus Infections and Following Early Antiretroviral Therapy Initiation.Viruses. 2024 Oct 14;16(10):1609. doi: 10.3390/v16101609. Viruses. 2024. PMID: 39459942 Free PMC article.
References
MeSH terms
Substances
Grants and funding
- HBF-123682/Gouvernement du Canada | Canadian Institutes of Health Research (IRSC)
- MOP-133476/Gouvernement du Canada | Canadian Institutes of Health Research (IRSC)
- MOP-142195/Gouvernement du Canada | Canadian Institutes of Health Research (IRSC)
- HB2-164064/Gouvernement du Canada | Canadian Institutes of Health Research (IRSC)
LinkOut - more resources
Full Text Sources
Research Materials
