. 2022 Apr 21;42(4):e0045221.
doi: 10.1128/mcb.00452-21. Epub 2022 Mar 21.

Target-Dependent Coordinated Biogenesis of Secondary MicroRNAs by miR-146a Balances Macrophage Activation Processes

Affiliations

Target-Dependent Coordinated Biogenesis of Secondary MicroRNAs by miR-146a Balances Macrophage Activation Processes

Susanta Chatterjee et al. Mol Cell Biol. .

Abstract

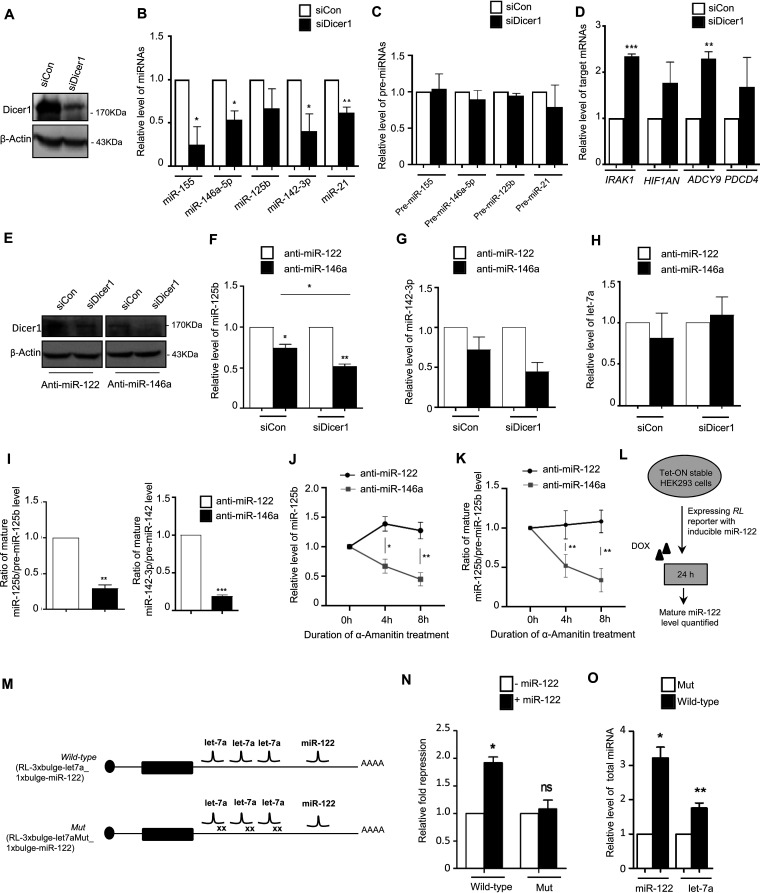
MicroRNAs (miRNAs) repress protein expression by binding to the target mRNAs. Exploring whether the expression of one miRNA can regulate the abundance and activity of other miRNAs, we noted the coordinated biogenesis of miRNAs in activated macrophages. miRNAs with higher numbers of binding sites (the "primary" miRNAs) induce expression of other miRNAs ("secondary" miRNAs) having binding sites on the 3' untranslated region (UTR) of common target mRNAs. miR-146a-5p, in activated macrophages, acts as a "primary" miRNA that coordinates biogenesis of "secondary" miR-125b, miR-21, or miR-142-3p to target new sets of mRNAs to balance the immune responses. During coordinated biogenesis, primary miRNA drives the biogenesis of secondary miRNA in a target mRNA- and Dicer1 activity-dependent manner. The coordinated biogenesis of miRNAs was observed across different cell types. The target-dependent coordinated miRNA biogenesis also ensures a cumulative mode of action of primary and secondary miRNAs on the secondary target mRNAs. Interestingly, using the "primary" miR-146a-5p-specific inhibitor, we could inhibit the target-dependent biogenesis of secondary miRNAs that can stop the miRNA-mediated buffering of cytokine expression and inflammatory response occurring in activated macrophages. Computational analysis suggests the prevalence of coordinated biogenesis of miRNAs also in other contexts in human and in mouse.

Keywords: activated macrophages; anti-inflammatory miRNAs; cooperative miRNA biogenesis; coordinated biogenesis of miRNAs; macrophage activation; macrophage polarization; miRNA biogenesis; primary miRNA; target mRNA-dependent miRNA biogenesis; target-dependent miRNA biogenesis.


Conflict of interest statement

The authors declare no conflict of interest.

Figures

FIG 1
FIG 1
LPS induces expression of groups of miRNAs in murine macrophages. (A) Expression of miR-146a-5p and miR-21 in murine macrophages after treatment with increasing concentrations of LPS. PCR data reveals a dose-dependent increase of miR-146a-5p and miR-21 expression levels after LPS treatment for 24 h in RAW264.7 cells (n = 3). (B) Changes in the levels of different miRNAs against time during LPS (10 ng/mL) treatment. qRT-PCR data show changes in miR-155, miR-146a-5p, miR-125b, miR-142-3p, and miR-21 expression after LPS induction. Values at 0 h are taken as units (n = 3). (C to E) LPS treatment of PEC increases the expression of LPS-responsive (miR-146a-5p, miR-125b, miR-142-3p) but not nonresponsive (let-7a) miRNAs. (C) Treatment was done with 10 ng/mL of LPS for 24 h. (D) Real-time quantification of respective targets. TRAF6 and IRAK1 (of miR-146a), IRF4 and HIF1AN (of miR-125b), and PDCD4 and MAP2K3 (of miR-21) were measured and plotted after 24 h of LPS treatment. (E) Relative levels of total and Ago2-associated HIF1AN mRNA in control versus 24-h LPS-treated PEC. Average CT values are plotted for each sample (n = 3). 18s rRNA or GAPDH and U6 snRNA were used as endogenous targets in qRT-PCR of mRNA and miRNA quantification, respectively. Student’s t tests were used for all comparisons. P < 0.05 (*); P < 0.01 (**); P < 0.001 (***); P < 0.0001 (****).
FIG 2
FIG 2
miR-146a-5p regulates biogenesis of groups of miRNAs in LPS-induced murine macrophages. (A) Schematic representation of experiments done with miR-146a-5p-inactivated macrophages treated with LPS. RAW264.7 murine macrophages were transfected with either 30 nM anti-miR-146a or anti-miR-122 (control) oligonucleotides. After transfection, cells were induced with 10 ng/mL LPS for the respective times. (B and C) miR-125b (B) and miR-142-3p (C) levels after LPS induction in anti-miR-146a- or anti-miR-122-transfected RAW264.7 murine macrophages. Relative levels of miRNA were estimated by qRT-PCR and plotted (n = 3). Values at 0 h are taken as units. (D) Cellular levels of miR-21 in anti-miR-146a-, anti-miR-122-, and anti-miR-155-transfected RAW264.7 cells after LPS treatment. Relative levels of miRNA were estimated by qRT-PCR and plotted (n = 2). (E) Relative levels of primary (pri-) and precursors (pre-) of miR-125b or miR-142-3p in anti-miR-146a-transfected RAW264.7 cells treated with LPS for 24 h (n = 3). Values in control anti-miR-122-transfected cells were set as units. (F) Cellular levels of pre-miR-125b and pre-miR-142-3p in anti-miR-146a-transfected RAW264.7 cells treated with LPS for 24 h (n = 3). Values in control anti-miR-122-transfected cells were set as units. The small-RNA population isolated with the small-RNA-specific mirVana RNA isolation kit was used for the analysis (n = 3). (G) Relative level of let-7a in anti-miR-146a-transfected LPS-treated RAW264.7 cells (n = 3). Values in control anti-miR-122-transfected cells were set as units. (H) Cellular levels of miRNP-associated proteins in anti-miR-146a- and control anti-miR-122-transfected LPS-treated macrophages. miRNP-associated proteins and processing enzymes Dicer1, Ago2, TRBP2, and Drosha were Western blotted in miR-146a-5p-inactivated LPS-treated RAW264.7 cells. β-Actin served as an endogenous control. 18s rRNA or GAPDH and U6 snRNA were used as endogenous targets in qRT-PCR of mRNA and miRNA quantification, respectively. Student’s t tests were used for all comparisons. P < 0.05 (*); P < 0.01 (**); P < 0.001 (***); P < 0.0001 (****).
FIG 3
FIG 3
miR-146a-5p and coregulated secondary miRNAs share binding sites on different mRNAs encoding TLR4 signaling components. (A and B) Expression of TRAF6 (A) and IRAK1 (B) mRNAs in anti-miR-146a- and control anti-miR-122-transfected macrophages after 10 ng/mL of LPS treatment over 0- to 24-h time points (n = 3). Relative levels of miRNA were estimated by qRT-PCR and plotted (n = 3). Values at 0 h are taken as units. (C to E) Schematic representation of the 3′ UTRs of TRAF6 and IRAK1 mRNA. (C) The respective miRNA binding sites are shown on the 3′ UTR of these two mRNAs. TRAF6 and IRAK1 murine mRNAs both bear single and nonconserved miR-21 binding sites on their 3′ UTR as predicted by TargetScan. (D and E) The exact positions of the miRNA binding sites and the types of seed matches of binding sites are listed. (F) A schematic representation of reporter RL-IRAK1 mRNA with 3′ UTR of IRAK1 mRNA with respective miRNA binding sites is shown in the upper panel. Relative levels of Renilla luciferase reporter RL-IRAK1 expression in cells transfected with increasing concentrations of anti-miR-146a are shown in the left panel. Relative repression of the RL-IRAK1 reporter in cells transfected without anti-miR-146a oligonucleotides has been taken as units. Relative levels of the Renilla luciferase reporter RL-IRAK1 in anti-miR-146a-transfected or both anti-miR-142-3p- and anti-miR-146a-transfected LPS-treated RAW264.7 cells are shown in the right panel. RL-con or RL-IRAK1 reporters were cotransfected with firefly luciferase (FF) expression plasmid, where FF expression was used as a transfection control (n = 3). Relative repression levels of RL-IRAK1 reporter in control anti-miR-122-transfected cells were taken as units. 18s rRNA or GAPDH and U6 snRNA were used as endogenous targets in qRT-PCR of mRNA and miRNA quantification, respectively. Student’s t tests were used for all comparisons. P < 0.05 (*); P < 0.01 (**); P < 0.001 (***); P < 0.0001 (****).
FIG 4
FIG 4
Coordinated biogenesis of secondary miRNAs driven by miR-146a-5p is linked with increased activity of secondary miRNAs in activated macrophages. (A) Schematic representation of the RL-MAD1 luciferase reporter mRNA with one miR-125b binding site on its 3′ UTR. A dual-luciferase assay shows reduction in repressive activity of miR-125b in anti-miR-125b-transfected RAW264.7 cells treated with LPS (left panel). Repression of RL-MAD1 was observed in LPS-treated anti-miR-125b-treated cells after 24 h of miR-146a induction (right panel). Repression levels at 0 h for both anti-miR-transfected cells are taken as units. (B) A dual-luciferase assay shows reduction in miR-125b activity in anti-miR-146a-transfected RAW264.7 cells treated with LPS. A Renilla reporter without any miRNA binding sites (RL-con) was used as a control to get the relative level of repression represented as the ratio of FF normalized RL-con to RL-MAD1 expression. A firefly luciferase (FF) construct without miRNA sites was used to normalize the transfection efficiency between the sets used for this assay (n = 3). (C) A dual-luciferase assay was used to score the level of repression for miR-125b or miR-142-3p reporters (RL-1x-perf-miR-125b and RL-1x-perf-miR-142-3p, respectively) in control anti-miR-122- or anti-miR-146a-transfected RAW264.7 cells treated with LPS. A Renilla reporter without any miRNA binding sites (RL-con) was used as a control. An FF construct without miRNA sites was used to normalize the transfection efficiency between the sets (n = 3). Values obtained with anti-miR-122-transfected cells were taken as units. (D and E) A dual-luciferase assay shows a reduced level of repression for miR-146a-5p reporter alone (RL-3xb-miR-146a) (D) and along with dual miR-146a/miR-125b reporter having binding sites for both miRNAs (RL-3xb-miR-146a-1xb-miR-125b) (E) in control anti-miR-122- and anti-miR-146a-transfected RAW264.7 cells treated with LPS. A Renilla reporter without any miRNA binding sites (RL-con) was used as a control. An FF construct without miRNA sites was used to normalize the transfection efficiency between the sets used for this assay (n = 3). Values obtained with anti-miR-122-transfected cells were taken as units. (F and G) Relative association of miR-125b and miR-142-3p with Ago2 after immunoprecipitation in LPS-treated control anti-miR-122- or anti-miR-146a-transfected cells (F). Reduced association of miR-125b target mRNA HIF1AN with Ago2 was also observed in anti-miR-146a-transfected cells (G). Macrophages were activated with LPS after transfection with the FHA-Ago2 expression construct and respective anti-miR inhibitor oligonucleotides. Western blot analyses of HA confirmed the amount of Ago2 pulled down postimmunoprecipitation that was used for normalization (n = 3). Values obtained with anti-miR-122-transfected cells were taken as units. (H) Association of miR-125b and miR-142-3p with endogenous Ago2 after immunoprecipitation with anti-Ago2 antibody from LPS-treated anti-miR-146a- or control anti-miR-22-transfected cells (n = 3). Values obtained with anti-miR-122-transfected cells were taken as units. (I and J) Relative levels of association of miR-125b and miR-142-3p with HA-Ago3 (I) and HA-Ago4 (J), respectively, after immunoprecipitation with anti-HA antibody from LPS-treated anti-miR-146a- or control miR-122-transfected cells. Western blot analyses of HA confirmed the amount of Ago variants pulled down postimmunoprecipitation that were used for normalization (n = 2). Values obtained with anti-miR-122-transfected cells were taken as units. (K) Reduced association of miR-21 with Ago2 after 24 h of LPS induction in anti-miR-146a-transfected cells. Macrophages have been activated with LPS after cotransfection with FHA-Ago2 expression plasmid and the respective anti-miR inhibitors (n = 3). Values obtained with anti-miR-122-transfected cells were taken as units. Immunoprecipitation was done with anti-HA antibody. (L) Levels of miR-21 target mRNAs after miR-146a inhibition determined by qRT-PCR in anti-miR-146a-transfected cells (n = 3). Values obtained with anti-miR-122-transfected cells were taken as units. (M) Derepression of miR-125b and miR-142-3p endogenous targets after 24 h of LPS induction in anti-miR-146a-transfected cells. qRT-PCR analyses of endogenous miR-125b targets (HIF1AN and MAP2K7) and miR-142-3p targets (ADCY9 and HMGB1) were done to estimate the relative mRNA content after anti-miR-146a transfection (n = 3). Values obtained with anti-miR-122-transfected cells were taken as units. (N) ChIP assay to study the relative enrichment of miR-125b and miR-142-3p endogenous target genes with RNA Pol II after 24 h of LPS induction in control anti-miR-122- or anti-miR-146a-transfected cells. Enrichment with IgG for the respective genes was used as a normalization control (n = 3). (O) miR-125b level does not affect cellular miR-146a-5p content. qRT-PCR data shows no effect of excess miR-125b on miR-146a level in murine macrophages transfected with miR-125b expression plasmid pmiR-125b against pCIneo control plasmid-transfected cells (n = 3). Values obtained with pCIneo plasmid-transfected cells were taken as units. (P and Q) Unaltered activities of miR-146a-5p on target mRNAs in pmiR-125b-transfected cells. Real-time PCR data show no significant change in the levels of endogenous targets of miR-146a-5p, TRAF6 and IRAK1, after miR-125b overexpression (n = 2). Decreased HIF1AN level confirmed increased activities of miR-125b after its overexpression (P). Dual-luciferase assay data exhibit no detectable change in miR-146a reporter RL-IRAK1 expression but increased repression of miR-125b reporter RL-MAD1 after miR-125b overexpression from pmiR-125 plasmid. Firefly luciferase (FF) constructs were used to normalize the transfection levels between the sets used in the assay (Q) (n = 3). Values obtained with control pCIneo plasmid-transfected cells were taken as units. 18s rRNA or GAPDH and U6 snRNA were used as endogenous targets in qRT-PCR of mRNA and miRNA quantification, respectively. Student’s t tests were used for all comparisons. P < 0.05 (*); P < 0.01 (**); P < 0.001 (***); P < 0.0001 (****).
FIG 5
FIG 5
Dicer1-mediated processivity of secondary miRNAs drives TDCB. (A to D) Knockdown of Dicer1 inhibits LPS-induced upregulation of groups of LPS-responsive miRNAs. (A) Western blots show confirmation of Dicer1 knockdown in LPS-treated murine macrophages. Western blots show reduced level of Dicer1 after siDicer1-mediated knockdown in RAW264.7 cells. β-Actin served as an endogenous control. (B) qRT-PCR-based relative quantification shows reduced levels of miR-155, miR-146a, miR-125b, miR-142-3p, and miR-21 in Dicer1-knocked-down cells treated with LPS (4 h treatment for miR-155, 24 h treatment for other miRNA measurements) (n = 3). (C) qRT-PCR-based relative quantifications were used to measure the levels of respective precursor miRNAs after Dicer1 knockdown in LPS-treated cells at same time-points as in panel B (n = 2). (D) Levels of target mRNAs of the respective miRNAs were measured upon Dicer1 depletion by siDicer1 in LPS-activated macrophages. In all cases, n = 3. Values in control siRNA-transfected cells (siCon) were taken as units. (E to H) Dicer1 knockdown exhibits an additive impact on the TDCB phenomenon after inhibiting primary miRNA miR-146-5p. (E) Confirmation of Dicer1 knockdown in anti-miR-146a-treated LPS-induced cells. β-Actin serves as an endogenous control. (F and G) qRT-PCR-based relative quantification shows reduced cellular levels in the miR-146a-5p-inhibited condition for both miR-125b and miR-142-3p, which are further reduced in Dicer1-knocked-down cells. (H) qRT-PCR-based relative quantification confirmed an unchanged let-7a level under identical conditions (n = 3). Values in anti-miR-122-transfected cells were taken as units. (I) Ratio of cellular levels of miR-125b and miR-142-3p to their respective precursors quantified in anti-miR-146a- and control anti-miR-122-transfected LPS-treated cells (n = 3). (J and K) The relative level of miR-125b (J) and the ratio of miR-125b to its precursor (K) were quantified after 10 μg/mL α-amanitin treatment for the respective time points in anti-miR-146a- and anti-miR-122-transfected 24-h LPS-treated cells (n = 3). (L) Scheme of the experiments to test coordinated biogenesis of miRNAs in HEK293 cells. (M) Design of the reporter constructs used for testing coordinated biogenesis of miRNA by its targets in HEK293 cells. RL reporters with wild-type or mutant let-7a miRNA binding sites and miR-122 sites in their 3′ UTRs are shown. (N) miR-122 represses target mRNA bearing functional let-7a sites but not with mutated let-7a sites present in cis with a single miR-122 site. HEK293 cells were transfected with RL-3xbulge-let-7a_1xbulge-miR-122 or RL-3xbulgeMut_1xbulge-miR-122, with or without a doxycycline-inducible miR-122 expression construct, and fold repression was measured by a luciferase assay done with the above-mentioned reporters and a Renilla reporter without any miRNA binding sites (RL-con). Relative fold repression values are plotted by taking the values without miR-122 expression as units in both cases (n = 3). (O) Target-dependent increased biogenesis of let-7a and miR-122 after transfection with let-7a target site containing RL-3xbulge-let-7a_1xbulge-miR-122 construct but not with let-7a mutant sites bearing the construct in HEK cells expressing miR-122 in an inducible manner (n = 3). 18s rRNA or GAPDH and U6 snRNA were used as endogenous targets in qRT-PCR of mRNA and miRNA quantification, respectively. Student’s t tests were used for all comparisons. P < 0.05 (*); P < 0.01 (**); P < 0.001 (***); P < 0.0001 (****). The concentration of LPS and duration of LPS induction on macrophages were 10 ng/mL and 24 h, respectively, wherever not mentioned.
FIG 6
FIG 6
Network analyses and expression mapping reveal the group of miRNAs and their targets that are coordinately regulated by miR-146a-5p. (A) Schematic representation of the methodology utilized to predict CB regulator-target relationships for miR-146a-5p based on miRNA-mRNA network analysis. mRNA-A (gene A) bears two or more miR-146a-5p binding sites and fewer numbers of miRNA-2 (secondary miRNA) binding sites. Additionally, mRNA-B (gene B) harbors two or more miRNA-2 binding sites but no miR-146a-5p binding sites. (B) The set of predicted coordinate biogenesis relationships (miRNA-1:mRNA-A→miRNA-2:mRNA-B) considering mmu-miR-146a-5p as the regulatory miRNA is exemplified here. The fold change status of differentially expressed mRNAs in murine macrophages exposed to LPS (10 ng/mL) for 24 h (GEO accession no. GSE19490) was included in the analysis to identify downregulated gene A and gene B. (C to E) miR-146a-5p influences expression of miR-16 and miR-21-3p and their secondary effector mRNAs after LPS induction in anti-miR-146a-transfected murine macrophages. (C) qRT-PCR data confirm miR-16 and miR-21-3p level downregulation in anti-miR-146a-transfected LPS-treated RAW264.7 cells after 24 h of treatment. (D) Increased accumulations of their respective precursors are also evident in the same context. (E) Expressions of their target mRNAs were also found to be derepressed in the same cells. 18s rRNA or GAPDH and U6 snRNA levels were used as endogenous targets for real-time qRT-PCR-based mRNA and miRNA quantification, respectively. 18s rRNA or GAPDH and U6 snRNA were used as endogenous targets in qRT-PCR of mRNA and miRNA quantification, respectively. Student’s t tests were used for all comparisons. P < 0.05 (*); P < 0.01 (**); P < 0.001 (***); P < 0.0001 (****).
FIG 7
FIG 7
Possible CB regulator-target relationships considering hsa-miR-146a-5p as the regulator in the human system. (A) Considering hsa-miR-146a-5p as the regulatory miRNA (miRNA-1), the possible set of miRNA-1:mRNA-A→miRNA-2:mRNA-B coordinate biogenesis relationships have been exemplified here. The fold change status of differentially expressed mRNAs in macrophages exposed to LPS (10 ng/mL) for 24 h (GEO accession no. GSE85333) has been included for downregulated gene A and gene B. (B) CB regulator-target relationships in human monocyte-derived macrophages in response to Mycobacterium tuberculosis infection.
FIG 8
FIG 8
miR-146a-5p could promote coordinated biogenesis of secondary miRNAs in non-LPS-activated murine macrophages. (A) Scheme of experiment to study miR-146a-5p-mediated coordinated biogenesis of miRNAs in Tet-On RAW264.7 cells. (B) Levels of miR-125b and miR-142-3p in cells expressing miR-146a-5p in an inducible manner in the presence of doxycycline. Relative levels of miRNAs were measured after treatment with 400 ng/mL of doxycycline for 24 h. qRT-PCR data confirm induced expression of miR-146a-5p and coordinated upregulation of two candidate miRNAs, miR-125b and miR-142-3p. Let-7a, a non-CB pair miRNA of miR-146-5p, did not show any change in Tet-On RAW264.7 cells after miR-146a induction (n = 3). (C) Expression of endogenous targets of miR-125b and miR-142-3p in RAW264.7 cells expressing miR-146a-5p in the presence of doxycycline. The qRT-PCR-based quantification also confirmed the increased miR-146a-mediated repression of its target TRAF6 after inducible expression of miR-146a-5p (n = 3). (D and E) Cellular levels of primary (pri-) and precursors (pre-) of miR-125b or miR-142-3p in RAW264.7 cells expressing miR-146a-5p in the presence and absence of doxycycline (n = 3). Values in non-doxycycline-treated cells are taken as units. (F and G) Ratios of cellular levels of miR-125b and miR-142-3p to their respective precursors were quantified in RAW264.7 cells expressing miR-146a-5p in the presence of doxycycline (n = 3). Values in non-doxycycline-treated cells are taken as units. (H and I) Repressive activity of miR-125b after induction of miR-146a-5p in RAW264.7 macrophage. A dual-luciferase assay was done with RL-MAD1 reporter mRNA having miR-125b binding sites in its 3′ UTR. RL-MAD1 but not RL-HMGA2, which harbors the 3′ UTR of HMGA2 with seven let-7a sites on its 3′ UTR, showed repression in cells expressing miR-146a-5p after 24 h of doxycycline induction. RL reporters without miRNA sites were used as a control. Firefly luciferase acts as a normalization control (n = 3). (J) The level of miR-21 is increased upon inducible expression of miR-146a-5p in macrophages (left panel). The relative level of pri-miR-21 was unchanged under the same condition (right panel). (K) PDCD4, an endogenous target of miR-21, was found to be repressed in cells expressing miR-146-5p (n = 3). (L) miRNP-associated proteins do not show alteration in expression upon inducible miR-146a-5p expression in RAW264.7 macrophages. miRNP-associated proteins and processing enzymes Dicer1, Ago2, TRBP2, and Drosha did not show any significant change in their expression in miR-146a-5p-induced cells. (M) Experimental scheme that is followed for experiments described for panels N to P, where anti-miRs and the doxycycline-inducible miR-146a-5p construct were cotransfected in Tet-On RAW264.7 cells. (N to P) Effect of miR-146a-5p inhibition in Tet-On RAW264.7 cells expressing miR-146a-5p in an inducible manner. Reduced miR-146a-5p (N), miR-125b (O), and unchanged let-7a (P) levels in miR-146a-5p-expressing cells in the presence of miR-146a inhibitor but not in the presence of anti-miR-122 in Tet-On RAW264.7 cells after 24 h of doxycycline treatment are shown. 18s rRNA or GAPDH and U6 snRNA levels have been used as an endogenous target for real-time qRT-PCR of mRNA and miRNA quantification, respectively. Student’s t tests were used for all comparisons. P < 0.05 (*); P < 0.01 (**); P < 0.001 (***); P< 0.0001 (****).
FIG 9
FIG 9
Targeting of primary miRNA miR-146a-5p affects the cellular response in LPS-activated RAW264.7 cells. (A) Induction with LPS causes activation of MAPK signaling molecules. (B) Inhibition of miR-146a-5p activity leads to overactivation of MAPK signaling molecules. Representative Western blot data confirm the increased phosphorylation status of P-p38 and P-ERK1/2 molecules upon LPS treatment in anti-miR-146a-treated but not in control anti-miR-122-treated RAW264.7 macrophages. Cellular levels of HSP70 and P-MSK1 were also measured. p38, ERK1/2, and MSK1 were also detected in anti-miR-146a and control anti-miR-122-transfected cells. β-Actin served as an internal control. (C) Comparative densitometric analysis data obtained from Western blots were plotted to show the changed phosphorylation status of MAPK signaling molecules P-p38 and P-ERK1/2 in anti-miR146a-treated LPS-induced cells compared to control anti-miR-122-transfected cell sets. (D and E) Effect of anti-miR-146a treatment on LPS-induced expression of TNF-α levels in RAW264.7 cells. (D) Relative levels of proteins were measured by ELISA and plotted for both anti-miR-146a- and anti-miR-122-transfected cells. (E) Changes in levels of proinflammatory cytokine TNF-α (left panel) and IL-1β (right panel) mRNAs after 24 h of LPS induction in anti-miR-146a-transfected RAW264.7 murine macrophages. Levels in control anti-miR-122-transfected cells were considered as units. (F) Increased generation of nitric oxide in cells with reduced miR-146a activity upon LPS treatment. Griess assay-based quantification revealed increased NO production in anti-miR-146a-transfected cells compared to control anti-miR-122-transfected cells after 16 h and 24 h of LPS treatment (n = 3). (G and H) Inhibition of miR-146a activity leads to increased levels of phagocytosis and apoptosis in LPS-treated murine macrophages. (G) The percentage of phagocytosis was measured using fluorescence-labeled latex bead entry, and data were plotted. (H) miR-146a-5p plays a crucial role in combating LPS induced apoptosis in RAW264.7 cells. Western blot data confirm an increased cellular level of cleaved PARP in anti-miR-146a-transfected macrophages. (I) The percentages of apoptotic cells were calculated in a TUNEL assay done for anti-miR-122- and anti-miR-146a-transfected LPS-induced murine macrophages (n = 3). (J) Proposed coordinated biogenesis-regulated inflammatory network (CBIN) that operates inside activated macrophages to balance the immune response to protect cells from overactivation and cellular death. Blue and green arrows represent the TDCB phenomenon in murine macrophages. The 18s rRNA or GAPDH level has been used as an endogenous target for real-time qRT-PCR of mRNA quantification. Concentrations of LPS for induction on macrophages were 10 ng/mL for the indicated time points. Student’s t tests were used for all comparisons. P < 0.05 (*); P < 0.01 (**); P < 0.001 (***).
FIG 10
FIG 10
Possible CB regulator-target relationships considering mmu-miR-155 as the regulator are shown. A set of predicted coordinate biogenesis relationships (miRNA-1:mRNA-A→miRNA-2:mRNA-B) considering mmu-miR-155-5p as the regulatory primary miRNA is exemplified here. (A) Possible coordinate biogenesis network of miR-155-5p in murine macrophage under LPS exposure using miR-155 knock-out macrophage cells. (B) Possible coordinate biogenesis network of miR-155-5p in macrophage polarization. (C) Possible coordinate biogenesis network of miR-125a/b in hematopoietic cells.
FIG 11
FIG 11
Progressive dampening mode of action of primary miRNAs on secondary targets. (A) Schematic representation of the COORD-BIO web server that provides information regarding coordinate biogenesis relationships in Homo sapiens and Mus musculus. COORD-BIO is available at http://www.hpppi.iicb.res.in/coordB2/index.html. (B) Change in expression of miR-125b in response to changing concentration of miR-146a-5p in RAW264.7 cells expressing the miR-146-5p in an inducible manner. The curve fitting of the data points is represented by a polynomial regression equation (equation 1) considering miRNA-125b as a secondary miRNA. The expression of an miRNA in a specific regulatory layer (nth layer) should be identified by the proposed equation (equation 2). (C) Schematic representation of target-dependent coordinated regulation of miRNA genesis showing how the concentration of miRNAs is probably being regulated through multiple layers. (D) Probable relation of a specific mRNA concentration with the levels of its primary and secondary miRNAs (equations 3 and 4). Plotting of data for two targets, TRAF6 (primary target of miR-146a-5p) and HIF1AN (primary target of secondary miRNA, i.e., miR-125b, and coordinated biogenesis-mediated secondary target of miR-146a-5p), against primary miRNA miR-146a-5p concentration. This data suggests a dampening effect of an miRNA on their non-“primary”targets, and the effect is reduced in an exponential way with the distance between the subsequent layers which the miRNA and the target mRNA belong to, respectively. (E) Graphical model of cooperative biogenesis of miRNAs in mammalian cells. In step a, target mRNA (mRNA A)-dependent cognate miRNA (miRNA 1 in black) biogenesis occurs, and in step b, the newly generated miRNP1 (Ago2-miRNA1) influences biogenesis and activity of other secondary miRNAs (miRNA 2 in red) that share the binding sites on the same 3′ UTR of common target mRNA in a cooperative manner. The miRNP2 (Ago2-miRNA2) targets new target mRNA B (green) that do not have miRNA 1 target sites. In step c, increased coordinated biogenesis of primary and secondary miRNAs leads to increased target mRNA degradation or translational repression of both primary and secondary target mRNAs (mRNA A and B).

Similar articles

Cited by

References

    1. O'Brien J, Hayder H, Zayed Y, Peng C. 2018. Overview of microRNA biogenesis, mechanisms of actions, and circulation. Front Endocrinol (Lausanne) 9:402. 10.3389/fendo.2018.00402. - DOI - PMC - PubMed
    1. Bartel DP. 2004. MicroRNAs: genomics, biogenesis, mechanism, and function. Cell 116:281–297. 10.1016/s0092-8674(04)00045-5. - DOI - PubMed
    1. Bose M, Bhattacharyya SN. 2016. Target-dependent biogenesis of cognate microRNAs in human cells. Nat Commun 7:12200. 10.1038/ncomms12200. - DOI - PMC - PubMed
    1. O'Connell RM, Rao DS, Chaudhuri AA, Baltimore D. 2010. Physiological and pathological roles for microRNAs in the immune system. Nat Rev Immunol 10:111–122. 10.1038/nri2708. - DOI - PubMed
    1. Chan JJ, Tay Y. 2018. Noncoding RNA:RNA regulatory networks in cancer. Int J Mol Sci 19:1310. 10.3390/ijms19051310. - DOI - PMC - PubMed

Publication types

LinkOut - more resources