. 2022 Apr 26;7(2):e0001822.
doi: 10.1128/msystems.00018-22. Epub 2022 Mar 21.

Surgical Treatment for Colorectal Cancer Partially Restores Gut Microbiome and Metabolome Traits

Affiliations

Surgical Treatment for Colorectal Cancer Partially Restores Gut Microbiome and Metabolome Traits

Hirotsugu Shiroma et al. mSystems. .

Abstract

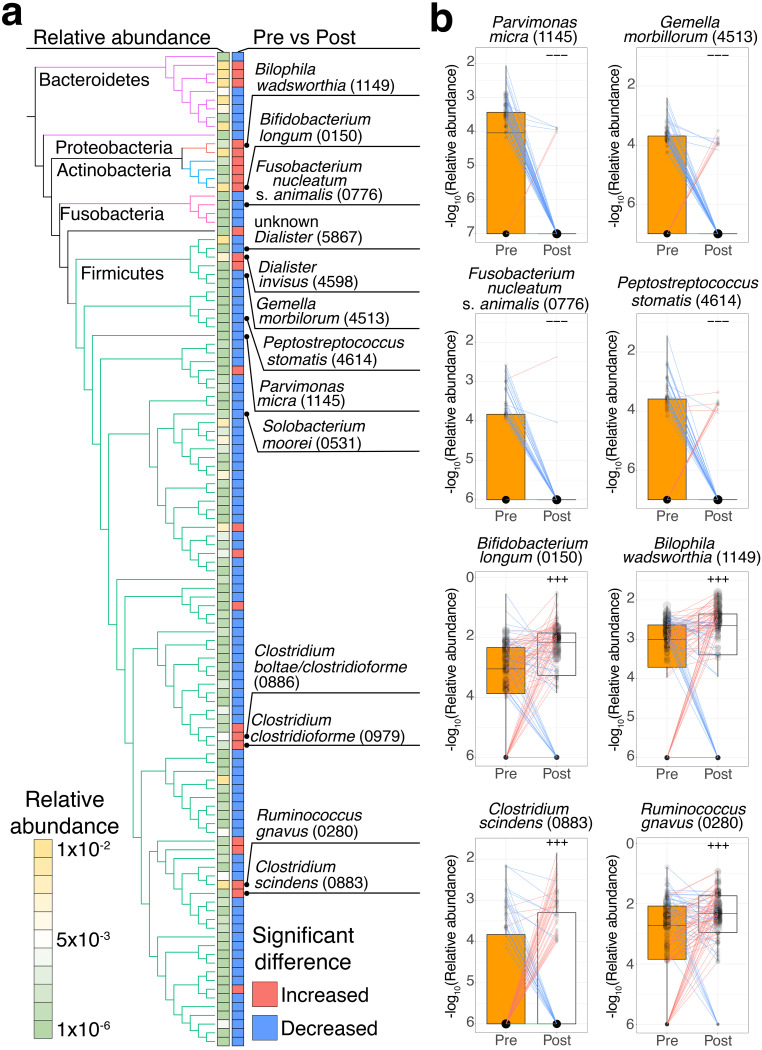
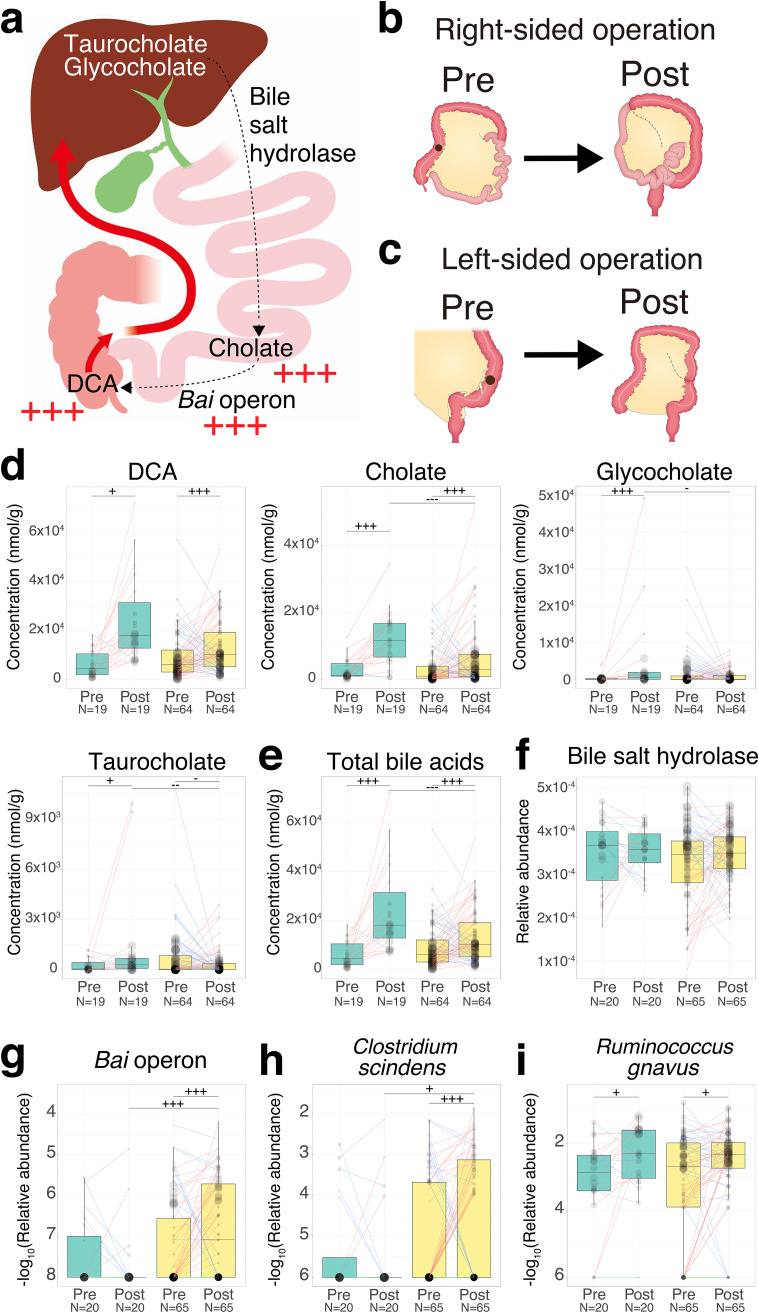
Accumulating evidence indicates that the gut microbiome and metabolites are associated with colorectal cancer (CRC). However, the influence of surgery for CRC treatment on the gut microbiome and metabolites and how it relates to CRC risk in postoperative CRC patients remain partially understood. Here, we collected 170 fecal samples from 85 CRC patients pre- and approximately 1 year postsurgery and performed shotgun metagenomic sequencing and capillary electrophoresis-time of flight mass spectrometry-based metabolomics analyses to characterize alterations between pre- and postsurgery. We determined that the relative abundance of 114 species was altered postsurgery (P < 0.005). CRC-associated species, such as Fusobacterium nucleatum, were decreased postsurgery. On the other hand, Clostridium scindens, carcinogenesis-associated deoxycholate (DCA)-producing species, and its biotransformed genes (bai operon) were increased postsurgery. The concentration of 60 fecal metabolites was also altered postsurgery (P < 0.005). Two bile acids, cholate and DCA, were increased postsurgery. We developed methods to estimate postoperative CRC risk based on the gut microbiome and metabolomic compositions using a random forest machine-learning algorithm that classifies large adenoma or early-stage CRC and healthy controls from publicly available data sets. We applied methods to preoperative samples and then compared the estimated CRC risk between the two groups according to the presence of large adenoma or tumors 5 years postsurgery (P < 0.05). Overall, our results show that the gut microbiome and metabolites dynamically change from pre- to postsurgery. In postoperative CRC patients, potential CRC risk derived from gut microbiome and metabolites still remains, which indicates the importance of follow-up assessments. IMPORTANCE The gut microbiome and metabolites are associated with CRC progression and carcinogenesis. Postoperative CRC patients are reported to be at an increased CRC risk; however, how gut microbiome and metabolites are related to CRC risk in postoperative patients remains only partially understood. In this study, we investigated the influence of surgical CRC treatment on the gut microbiome and metabolites. We found that the CRC-associated species Fusobacterium nucleatum was decreased postsurgery, whereas carcinogenesis-associated DCA and its producing species and genes were increased postsurgery. We developed methods to estimate postoperative CRC risk based on the gut microbiome and metabolomic compositions. We applied methods to compare the estimated CRC risk between two groups according to the presence of large adenoma or tumors after 5 years postsurgery. To our knowledge, this study is the first report on differences between pre- and postsurgery using metagenomics and metabolomics data analysis. Our methods might be used for CRC risk assessment in postoperative patients.

Keywords: colorectal cancer; human gut microbiome; metabolomics; metagenomics; surgery.


Conflict of interest statement

The authors declare a conflict of interest. Dr. Shinji Fukuda and Dr. Takuji Yamada are founders of Metabologenomics. The company is focused on the design and control of the gut environment for human health. The company had no control over the interpretation, writing or publication of this work. The terms of these arrangements are being managed by Keio University and Tokyo Institute of Technology according to their conflict of interest policies.

Figures

FIG 1
FIG 1
Distinct fecal microbiome, gene, and metabolome compositions between pre- and postsurgical CRC patients. (a to c) NMDS analysis based on the Bray-Curtis distance was carried out to visualize the influence of surgical treatment on the overall community structure of the genus-level taxonomic profile (a), KO-level functional profile (b), and metabolome profile (c) in pre- and postsurgical treatment samples. n represents the number of samples. (d to f) Violin and box plots show the Bray-Curtis dissimilarity of the genus-level taxonomic profile (d), KO-level functional profile (e), and metabolome profile (f) of fecal samples at two different time points within the same participants. n represents the number of paired samples in the same individuals. The boxes in box plots represent 25th to 75th percentiles, black lines indicate the median, and whiskers extend to the lowest and highest values within 1.5 times the interquartile range. (d and e) The Voigt et al. data sets obtained from healthy individuals at two different time points were used as the control for taxonomic and functional profile analysis (22). (f) The Nagata et al. data sets were used as control data from a healthy individual cohort for metabolomic analysis (23). PERMANOVA shows a difference between presurgical and postsurgical treatment in community structure in each profile in panels a to c. Statistical analysis was performed by a one-sided Wilcoxon rank-sum test in panels d to f. Significant differences are denoted as follows: +++, elevation (P < 0.005); ++, elevation (P < 0.01); +, elevation (P < 0.05); −−−, depletion (P < 0.005); −−, depletion (P < 0.01); and −, depletion (P < 0.05).
FIG 2
FIG 2
Different enrichment patterns of the fecal microbiota between pre- and postsurgical treatment. (a) Comparison of the relative abundance of different species between the presurgical treatment (n = 85) and postsurgical treatment (n = 85) groups. The phylogenetic tree and two heatmaps represent a phylogenetic relationship among 114 significantly different species, their average relative abundance in pre- and postsurgical treatment samples (n = 170, legend), and their significant differences between pre- and postsurgical treatment (P < 0.005; red, increase; blue, decrease), respectively. The edges in the phylogenetic tree represent five phyla (Firmicutes, green; Fusobacteria, pink; Actinobacteria, blue; Proteobacteria, orange; Bacteroidetes, purple). (b) Each box plot shows the −log10-transformed relative abundances of species in pre- (n = 85) and postsurgical treatment (n = 85) samples (pretreatment, orange; posttreatment, white). Each line in the box plot shows alteration patterns between pre- and postsurgical treatment within samples derived from the same patients (increase, red; decrease, blue; neither increase nor decrease, green). The sizes of points in the box plot reflect the distribution of the population in each category. Significant differences characteristics are denoted as follows: +++, increase (P < 0.005); −−−, decrease (P < 0.005). One-sided Wilcoxon signed-rank test was performed to characterize the increasing or decreasing trend in the pre- and postsurgical groups in panels a and b.
FIG 3
FIG 3
Different enrichment patterns of fecal metabolites between pre- and postsurgical treatment. (a) Comparison of metabolite concentrations between the presurgical treatment (n = 83) and postsurgical treatment (n = 83) groups. The x axis represents the average log2-transformed fold change between pre- and postsurgical treatment, while the y axis represents the −log10-transformed P values obtained from the one-sided Wilcoxon signed-rank test. The horizontal dashed line shows a −log10-transformed P value of 0.005. The sizes of the circles in the legend represent the average concentration of each metabolite in pre- and postsurgical treatment samples. Elevation or depletion in at least one of the multistep CRC progression stages is colored red and blue, respectively (see Materials and Methods). (b and c) Each box plot shows the concentration of each metabolite (b) and total bile acids (c) in pre- (n = 85) and postsurgical treatment (n = 85) samples (pretreatment, orange; posttreatment, white). Each line in the box plot shows alteration patterns between pre- and postsurgical treatment within samples derived from the same patients (increase, red; decrease, blue; neither increase nor decrease, green). The sizes of points in the box plot reflect the distribution of the population in each category. A one-sided Wilcoxon signed-rank statistical test was performed to characterize the increasing or decreasing trend in the pre- and postsurgical groups. Significant differences characteristics are denoted as follows: +++, increase (P < 0.005); −−−, decrease (P < 0.005).
FIG 4
FIG 4
Distinct enrichment patterns of bile acid-related genes between pre- and postsurgical treatment. (a and d) Each box plot shows the relative abundances (a) or −log10-transformed relative abundances (d) of genes or operons, respectively, in pre- (n = 85) and postsurgical (n = 85) treatment groups (pretreatment, orange; posttreatment, white). Each line in the box plot shows alteration patterns between pre- and postsurgical treatment groups within the samples derived from the same patient (increase, red; decrease, blue). The sizes of points in the box plot reflect the distribution of the population in each category. A one-sided Wilcoxon signed-rank statistical test was performed to characterize increasing or decreasing trends by comparing pre- and postsurgical treatment groups. Significant differences are denoted as follows: +++, increase (P < 0.005); −−−, decrease (P < 0.005). (b and e) Each pie chart shows the percentage of contributors to genes or operons. The percentages of contributors are indicated in parentheses. (c) Gene arrangement of the bai operon in seven metagenome-assembled genomes (MAGs). Samples are shown, and their category is indicated in parentheses. The colors in the legends reflect the gene name. Taxonomic assignments for MAGs were carried out by GTDB-Tk (see Materials and Methods).
FIG 5
FIG 5
Influence of right- or left-sided operations on bile acid metabolism. (a) Overview of bile acid metabolism in the gastrointestinal tract. Metabolites were placed corresponding to their production sites. The black arrow represents biotransformation by bacterial metabolism. The red arrow represents the flow of bile acid reabsorption. The red plus sign represents the increase in metabolites or operons in the postsurgical samples compared to the presurgical samples (one-sided Wilcoxon signed-rank test, P < 0.005). (b) The right-sided surgery was defined by resection of not only the right colon but also part of the terminal ileum. (c) The left-sided surgery was defined by resection of part of the left colon. The black point represents the position of CRC in panels b and c. (d to i) Each box plot shows the concentration of each metabolite (d), total bile acids (e), the relative abundance of genes (f), the −log10 transformed relative abundance of operon (g), and the −log10 transformed relative abundance of species (h and i). The sizes of the points in the box plots reflect the distribution of the population in each category. The colors of boxes in the box plot represent the right (green)- or left (yellow)-sided surgery groups, which were based on the CRC location presurgery. Each line in the box plot shows alteration patterns between pre- and postsurgical treatment groups within samples derived from the same patient (increase, red; decrease, blue; neither increase nor decrease, green). The number of samples is represented at the bottom of each category. A one-sided Wilcoxon rank-sum statistical test was performed to characterize the elevation or depletion pattern between samples from before right- and left-sided surgery or after right- and left-sided surgery. A one-sided Wilcoxon signed-rank statistical test was performed to characterize the increase or decrease trend between samples from before and after right- or left-sided surgery. Significant difference characteristics are denoted as follows: +++, elevation or increase (P < 0.005); ++, elevation or increase (P < 0.01); +, elevation or increase (P < 0.05); −−−−, depletion or decrease (P < 0.005); −−, depletion or decrease (P < 0.01); and −, depletion or decrease (P < 0.05).
FIG 6
FIG 6
Application of the classifier to samples obtained from pre- and postsurgical treatment. (a and b) We built four stage-specific random forest-based binary classifiers to distinguish cases in each of the stages (MP, n = 61; stage 0, n = 57; stage I/II, n = 85; stage III/IV, n = 59) from healthy controls (H, n = 245) (see Materials and Methods). We applied the classifiers to pre- and postoperative metagenomic and metabolomic samples from 76 patients with low and high postoperative CRC risk to obtain normalized probability (pre- and postoperative samples from patients at low postoperative CRC risk, n = 58; pre- and postoperative samples from high postoperative CRC risk patients, n = 18). The low and high CRC group classification was based on the postoperative colonoscopy findings for about 5 years following surgery. The box plots represent the normalized probability derived from each classifier in preoperative (a) and postoperative samples (b). Dashed lines show the median of normalized probability (red, healthy controls; each, MP). A one-sided Wilcoxon rank-sum statistical test was performed to characterize the elevation or depletion patterns in the group at postoperative CRC risk compared to the group at low postoperative CRC risk. Significant differences are denoted as follows: +, increase (P < 0.05). (c) Heatmap shows the rank of the top 10 contributors in each classifier (see Materials and Methods). The y axis is ordered by the rank of contributors from the stage III/IV classifier. Color represents the category of contributors (species, red; KO, blue; metabolite, black). Color and the number in the heatmap represent the rank of contributors in each classifier (Legend).

Similar articles

Cited by

References

    1. Bray F, Ferlay J, Soerjomataram I, Siegel RL, Torre LA, Jemal A. 2018. Global cancer statistics 2018: GLOBOCAN estimates of incidence and mortality worldwide for 36 cancers in 185 countries. CA Cancer J Clin 68:394–424. doi:10.3322/caac.21492. - DOI - PubMed
    1. Kakeji Y, Takahashi A, Udagawa H, Unno M, Endo I, Kunisaki C, Taketomi A, Tangoku A, Masaki T, Marubashi S, Yoshida K, Gotoh M, Konno H, Miyata H, Seto Y, National Clinical Database. 2018. Surgical outcomes in gastroenterological surgery in Japan: report of National Clinical database 2011–2016. Ann Gastroenterol Surg 2:37–54. doi:10.1002/ags3.12052. - DOI - PMC - PubMed
    1. Yabuuchi Y, Imai K, Hotta K, Ito S, Kishida Y, Yamaguchi T, Shiomi A, Kinugasa Y, Yoshida M, Tanaka M, Kawata N, Kakushima N, Takizawa K, Ishiwatari H, Matsubayashi H, Ono H. 2018. Higher incidence of metachronous advanced neoplasia in patients with synchronous advanced neoplasia and left-sided colorectal resection for colorectal cancer. Gastrointest Endosc 88:348–359.e1. doi:10.1016/j.gie.2018.03.011. - DOI - PubMed
    1. Mulder SA, Kranse R, Damhuis RA, Ouwendijk RJT, Kuipers EJ, van Leerdam ME. 2012. The incidence and risk factors of metachronous colorectal cancer: an indication for follow-up. Dis Colon Rectum 55:522–531. doi:10.1097/DCR.0b013e318249db00. - DOI - PubMed
    1. Bouvier A-M, Latournerie M, Jooste V, Lepage C, Cottet V, Faivre J. 2008. The lifelong risk of metachronous colorectal cancer justifies long-term colonoscopic follow-up. Eur J Cancer 44:522–527. doi:10.1016/j.ejca.2008.01.007. - DOI - PubMed

Publication types