. 2022 Apr 27;10(2):e0226121.
doi: 10.1128/spectrum.02261-21. Epub 2022 Mar 21.

The Identity of the Constriction Region of the Ribosomal Exit Tunnel Is Important to Maintain Gene Expression in Escherichia coli

Affiliations

The Identity of the Constriction Region of the Ribosomal Exit Tunnel Is Important to Maintain Gene Expression in Escherichia coli

Sarah B Worthan et al. Microbiol Spectr. .

Abstract

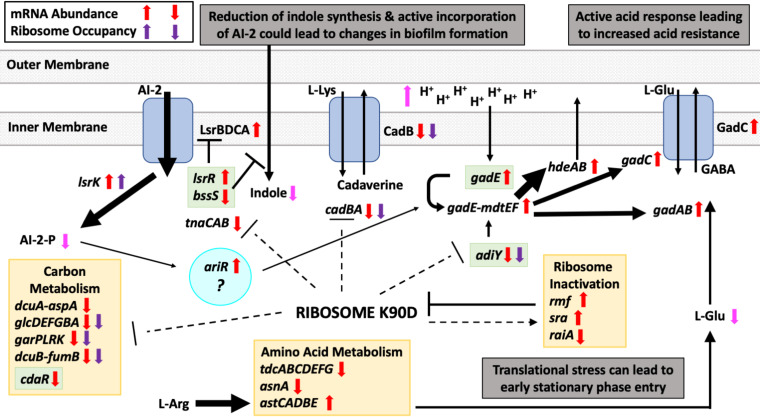
Mutational changes in bacterial ribosomes often affect gene expression and consequently cellular fitness. Understanding how mutant ribosomes disrupt global gene expression is critical to determining key genetic factors that affect bacterial survival. Here, we describe gene expression and phenotypic changes presented in Escherichia coli cells carrying an uL22(K90D) mutant ribosomal protein, which displayed alterations during growth. Ribosome profiling analyses revealed reduced expression of operons involved in catabolism, indole production, and lysine-dependent acid resistance. In general, translation initiation of proximal genes in several of these affected operons was substantially reduced. These reductions in expression were accompanied by increases in the expression of acid-induced membrane proteins and chaperones, the glutamate-decarboxylase regulon, and the autoinducer-2 metabolic regulon. In agreement with these changes, uL22(K90D) mutant cells had higher glutamate decarboxylase activity, survived better in extremely acidic conditions, and generated more biofilm in static cultures compared to their parental strain. Our work demonstrates that a single mutation in a non-conserved residue of a ribosomal protein affects a substantial number of genes to alter pH resistance and the formation of biofilms. IMPORTANCE All newly synthesized proteins must pass through a channel in the ribosome named the exit tunnel before emerging into the cytoplasm, membrane, and other compartments. The structural characteristics of the tunnel could govern protein folding and gene expression in a species-specific manner but how the identity of tunnel elements influences gene expression is less well-understood. Our global transcriptomics and translatome profiling demonstrate that a single substitution in a non-conserved amino acid of the E. coli tunnel protein uL22 has a profound impact on catabolism, cellular signaling, and acid resistance systems. Consequently, cells bearing the uL22 mutant ribosomes had an increased ability to survive acidic conditions and form biofilms. This work reveals a previously unrecognized link between tunnel identity and bacterial stress adaptation involving pH response and biofilm formation.

Keywords: acid resistance; biofilms; ribosomes; translational control.


Conflict of interest statement

The authors declare no conflict of interest.

Figures

FIG 1
FIG 1
Comparative analysis of the extended loop amino acid sequences of uL4 and uL22 from diverse prokaryotic and eukaryotic organisms. (A) Figure obtained from the PDB:4UY8 structure (65), shows the extended loops of ribosomal proteins uL4 (blue sticks) and uL22 (green sticks) surround the lumen of the ribosomal exit tunnel (gray surface). Non-conserved residues uL4 (R61 & R67) and uL22(K90 & R92), are shown in red. The orientation of the PTC and the tunnel exit are indicated with arrows. (B) Weblogo results of multiple protein alignment analyses of segments of the extended loops of uL4 and uL22 proteins that constitute the constriction region of the ribosomal exit tunnel. These four Weblogos represent the conservation and frequency of amino acid residues at specific positions (E. coli numbering). Prokaryotic sequences are shown on top (231 species) while eukaryotic sequences are shown on bottom (56 species). Residue positions studied in this work are marked with an asterisk. No archaea sequences were included in the alignments of prokaryotes.
FIG 2
FIG 2
Cell growth of wild type and ribosomal protein mutant strains in rich media. Plots representing the growth of strains expressing wild type (WT) uL4 and uL22 proteins and indicated uL4(R61D) or uL22(K90D) mutant proteins. Growth is shown (A) over a 10-h period and (B) from 200 to 600 min to emphasize disparities in growth. y axes displayed Log2 values of determined Klett units. Arrows indicate the time where cultures samples were obtained for ribosome profiling and RNA-seq analyses. Each curve shown is the resulting average of three independent experiments. Doubling times for each strain were calculated using data points between 140 min and 150 min and 240 min from several replicate growth curves as indicated in Materials and Methods. It should be noted that these cells replicate slowly which we suspect is because they contain several deletions used to analyze the expression of the tnaC-tnaA-lacZ reporter gene (Table S1).
FIG 3
FIG 3
Differential changes of translational and mRNA levels in the uL22(K90D) mutant strain. (A) Scatterplot showing Log2 fold changes of RPF read counts versus their corresponding Log2 fold changes of mRNA read counts per gene plotted. (B) Volcano plot showing significance versus changes in translation efficiency (RPF read counts/mRNA read counts) of all tested genes. (C) Volcano plot showing significance versus changes in mRNA read counts. Affected genes from the same operons and/or within the same cellular pathways are color-coded in green, blue, and red. Data to make above graphs can be found in supplemental file.
FIG 4
FIG 4
RPFs and mRNA coverage profiles of acid resistance-related genes in the uL22(K90D) mutant strain. Individual read density of RPFs (top panels) and mRNA levels (bottom panels) of uL22(K90D) and uL22(WT) samples are shown. The figure was obtained using GWIPS-viz. Each panel is auto scaled for each gene and by group. RPFs and mRNA read count units are arbitrary. Chromosomal (Chr) positions of each gene are shown above. Reduction of RPFs signatures at the beginning of genes are indicated with red asterisks. Black arrows indicate the position of transcription initiation for genes of interest. Blue bars indicate open reading frames of genes of interest (A) cadC-cadBA, (B) adiY, and (C) gadE. Green lines mark methionine codon positions. Red lines indicate stop codon positions.
FIG 5
FIG 5
Glutamate decarboxylase (GAD) activity and survival of wild type uL22 and uL22(K90D) strains in acidic conditions. (A) Representative picture of our GAD activity assays. GAD activity was determined in uL22 (WT) and uL22(K90D) cultures, with and without 0.6 mM indole following 4 h of growth in LB-pH 7 media as indicated in Materials and Methods. (B) Plot representation of the GAD activity determined by light absorption at OD620 versus number of CFU/mL used in each reaction. Error bars represent standard deviation of n = 4 independent experiments. (C) uL22 (WT) and uL22(K90D) cultures, grown in LB-pH 7 media with and without 0.6 mM indole, were subjected to acidification in LB-pH 2.5 for 1 h. The CFU/mL before and after acid treatment were determined through aerobic plate counts (see Materials and Methods). Acid challenge data were expressed as percent survival obtained by dividing the CFU/mL values after acid treatment by the CFU/mL values obtained before treatment. Error bars represent standard deviation of the indicated number of independent experiments. *** P = 0.0074, and P = 0.0098, without (–) and with (+) addition of indole, respectively (Student’s t test).
FIG 6
FIG 6
Biofilm formation observed in wild-type and uL22(K90D) strains. Biofilm formation was tested in LB media in the absence (n = 6) or presence (n = 2) of 0.5 mM indole prior to 24 h of static incubation as indicated in Materials and Methods. Error bars represent standard deviation. Asterisk denotes a P value of 0.010 (Student’s t test).
FIG 7
FIG 7
Model of gene regulation observed in the uL22(K90D) mutant strain. An overview of the interconnections between genes and substrates affected in the uL22(K90D) strain. Dotted lines mark genes showing reduced translation efficiency due to the activity of ribosomes containing uL22(K90D) mutant proteins. The gray mesh boxes represent the inner cellular membrane of E. coli. Blue boxes represent membrane channels and transporters and arrows indicate movement of molecules across the channels and transporters. Green boxes enclose regulatory genes. Cyan circle encloses a possible key gene that controls the phenotypes observed in the uL22(K90D) mutant strain. Black arrows indicate movement of metabolites, chemical reactions, or proteins interactions with targeted genes; the thickness of the arrow is proportional to the activity of the event. Magenta arrows represent the level of accumulation expected for certain metabolites.

Similar articles

References

    1. Dao Duc K, Batra SS, Bhattacharya N, Cate JHD, Song YS. 2019. Differences in the path to exit the ribosome across the three domains of life. Nucleic Acids Res 47:4198–4210. doi:10.1093/nar/gkz106. - DOI - PMC - PubMed
    1. Wilson DN, Beckmann R. 2011. The ribosomal tunnel as a functional environment for nascent polypeptide folding and translational stalling. Curr Opin Struct Biol 21:274–282. doi:10.1016/j.sbi.2011.01.007. - DOI - PubMed
    1. Dunkle JA, Xiong L, Mankin AS, Cate JH. 2010. Structures of the Escherichia coli ribosome with antibiotics bound near the peptidyl transferase center explain spectra of drug action. Proc Natl Acad Sci USA 107:17152–17157. doi:10.1073/pnas.1007988107. - DOI - PMC - PubMed
    1. Lu J, Deutsch C. 2005. Folding zones inside the ribosomal exit tunnel. Nat Struct Mol Biol 12:1123–1129. doi:10.1038/nsmb1021. - DOI - PubMed
    1. Nakatogawa H, Ito K. 2002. The ribosomal exit tunnel functions as a discriminating gate. Cell 108:629–636. doi:10.1016/s0092-8674(02)00649-9. - DOI - PubMed

Publication types

MeSH terms

Substances