. 2022 Mar 21:11:e72555.
doi: 10.7554/eLife.72555.

Structural insights into recognition of chemokine receptors by Staphylococcus aureus leukotoxins

Affiliations

Structural insights into recognition of chemokine receptors by Staphylococcus aureus leukotoxins

Paul Lambey et al. Elife. .

Abstract

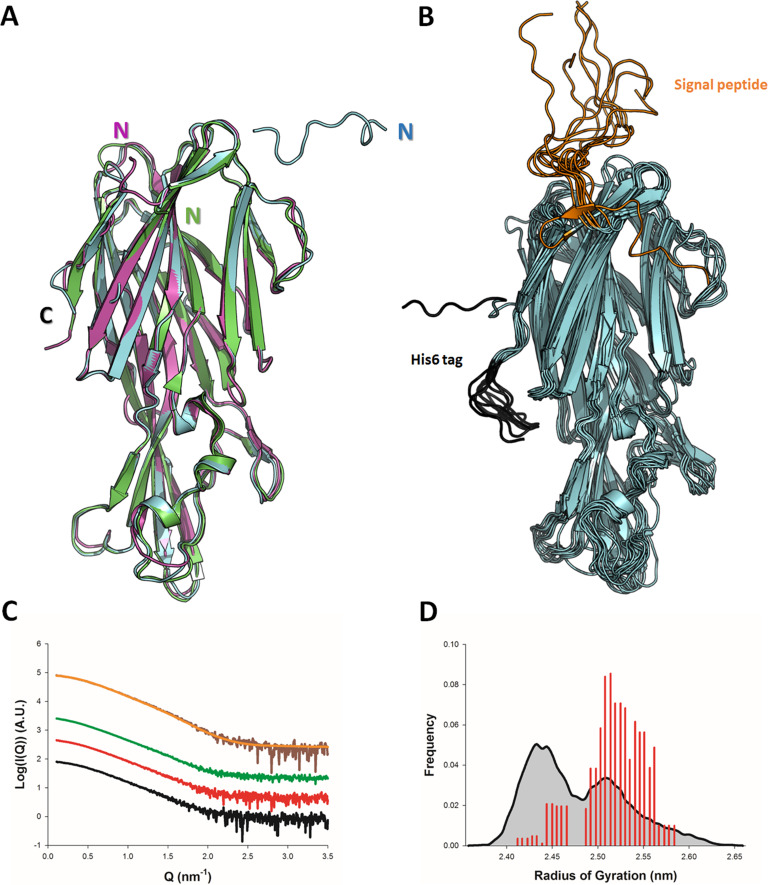
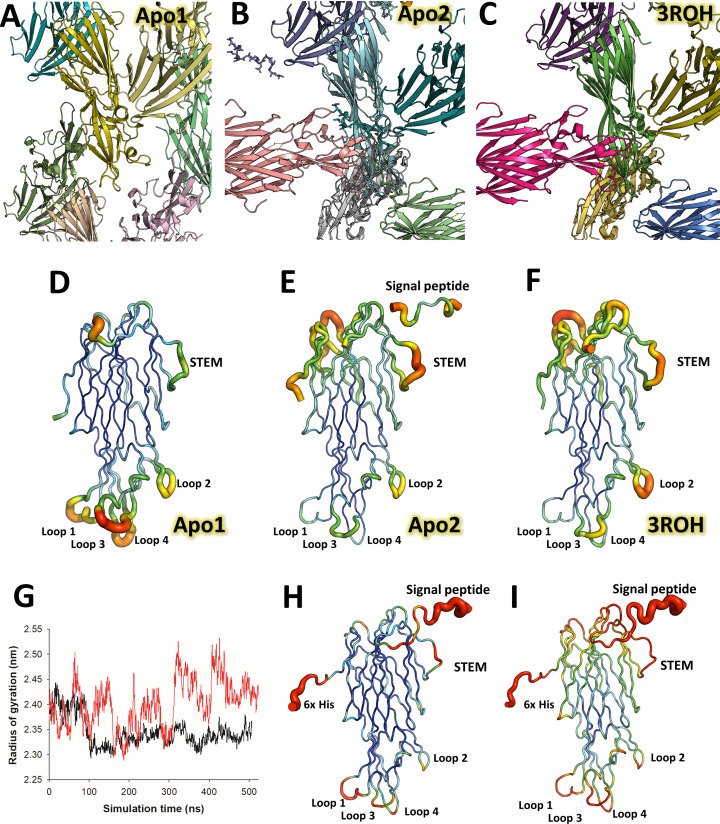
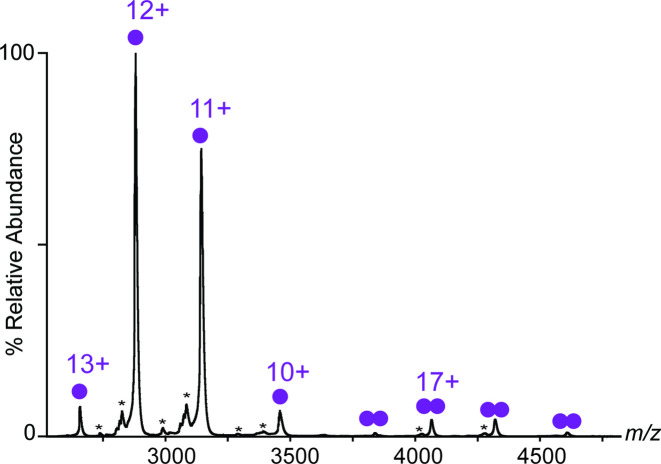
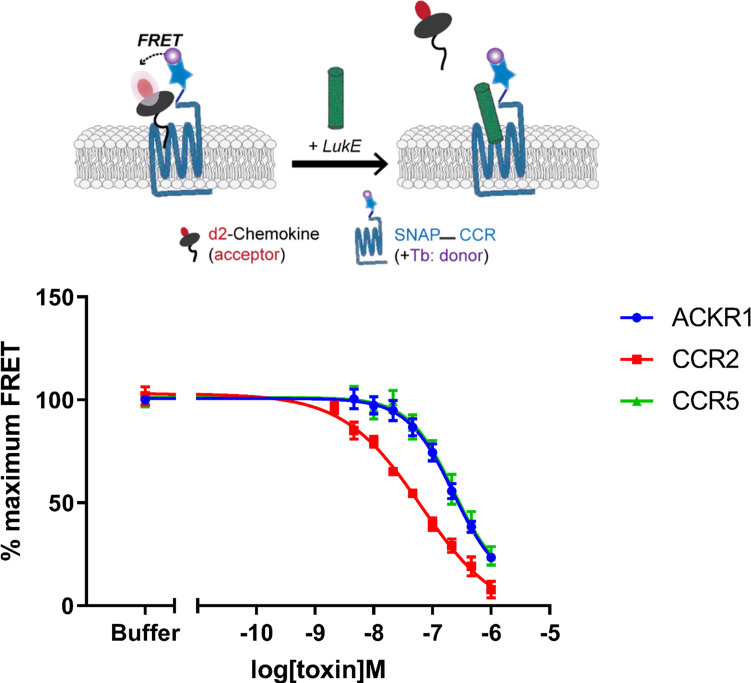
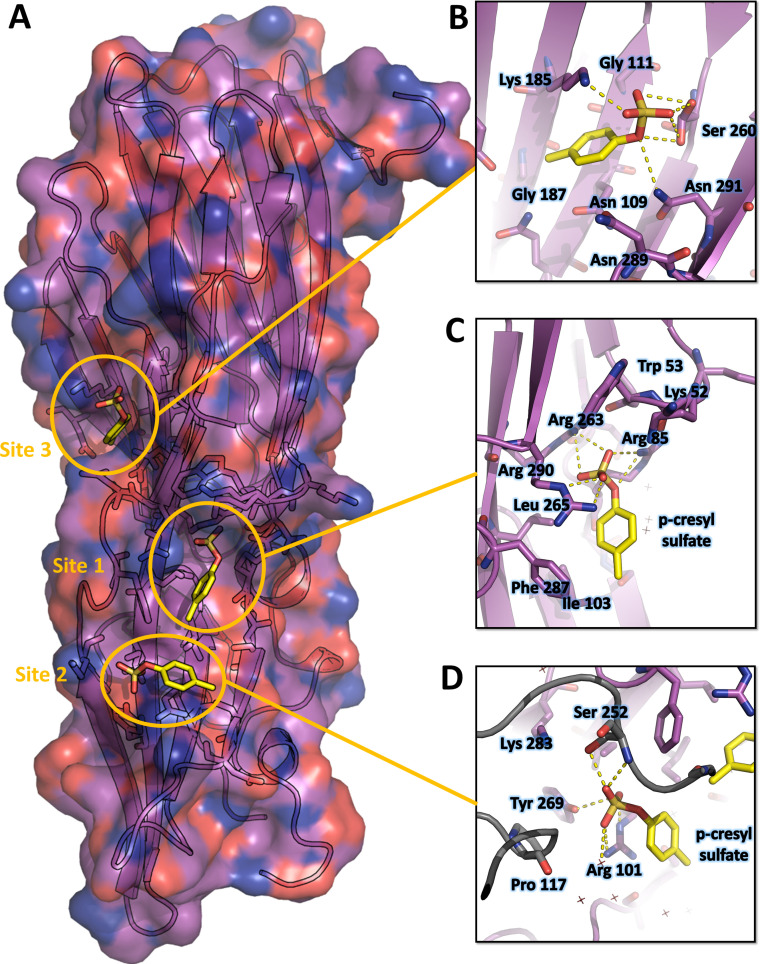
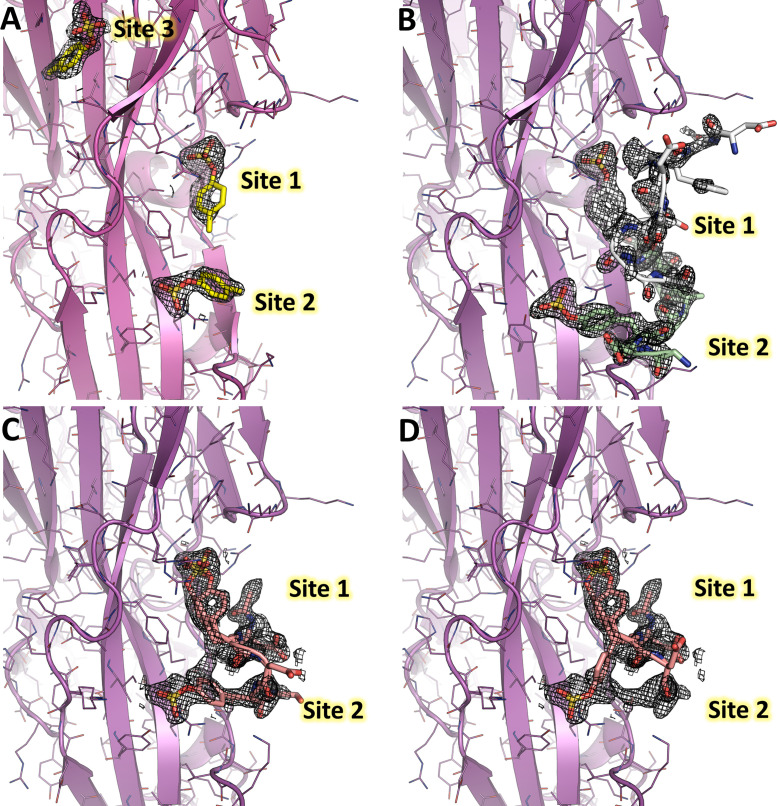
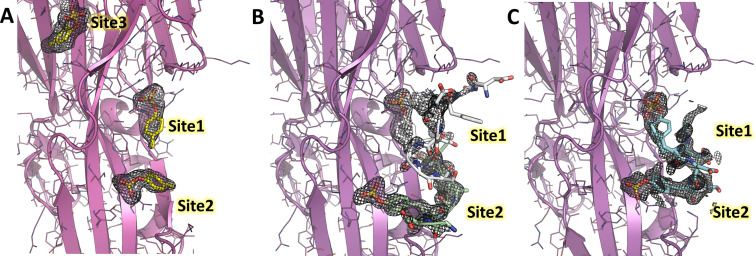
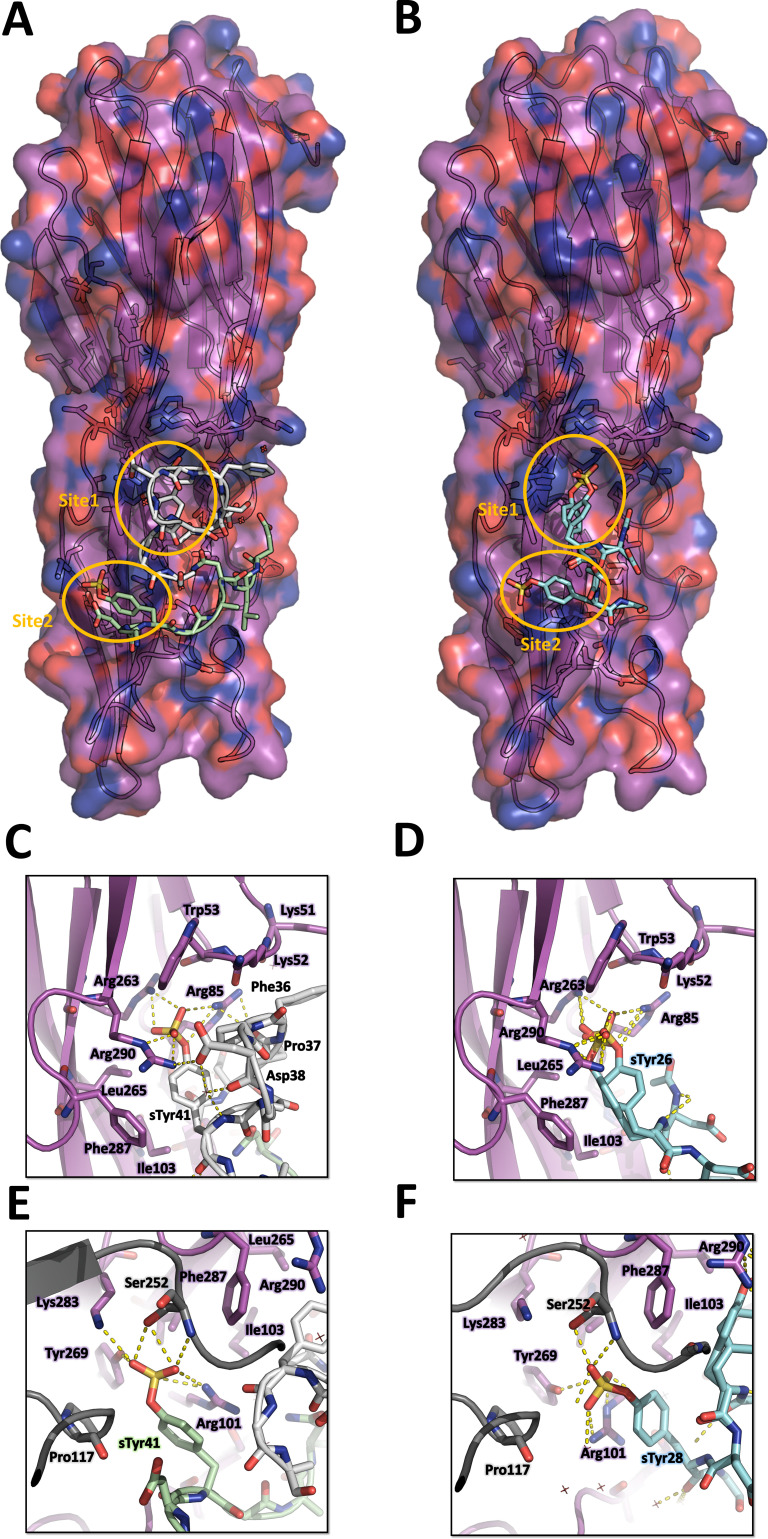
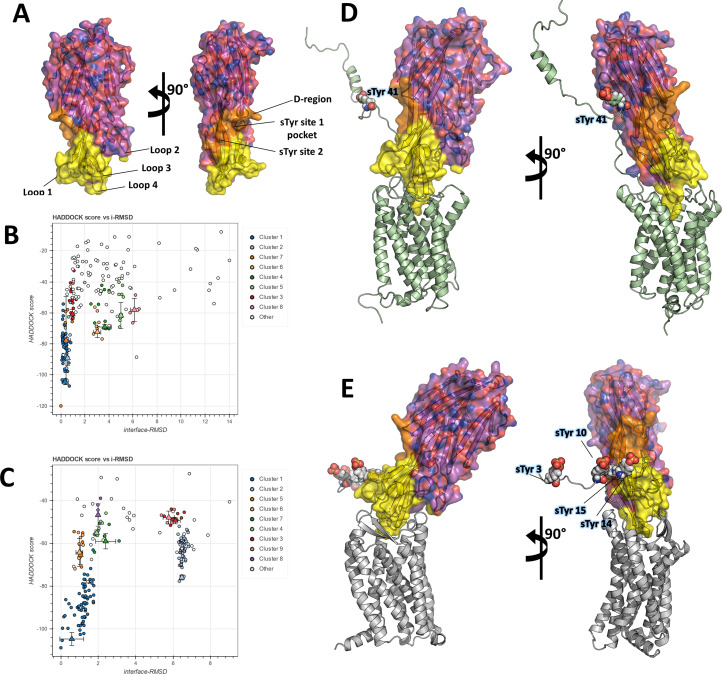
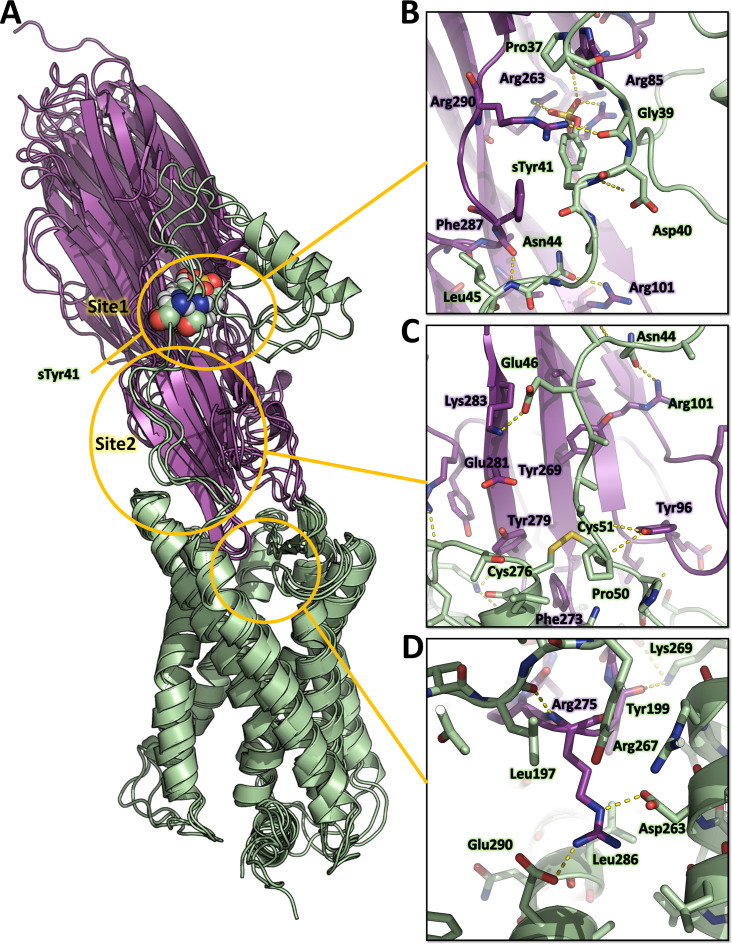
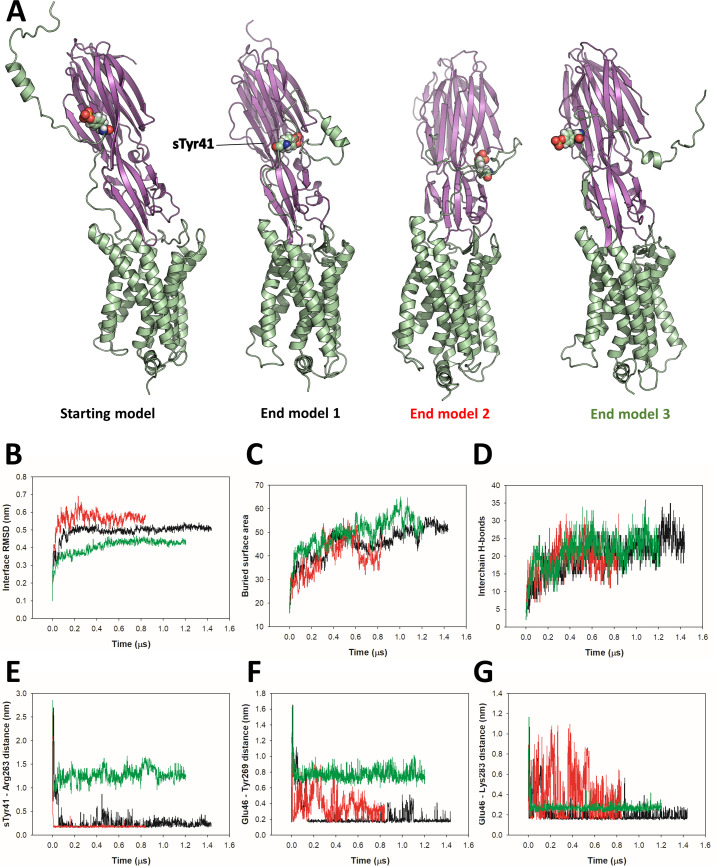
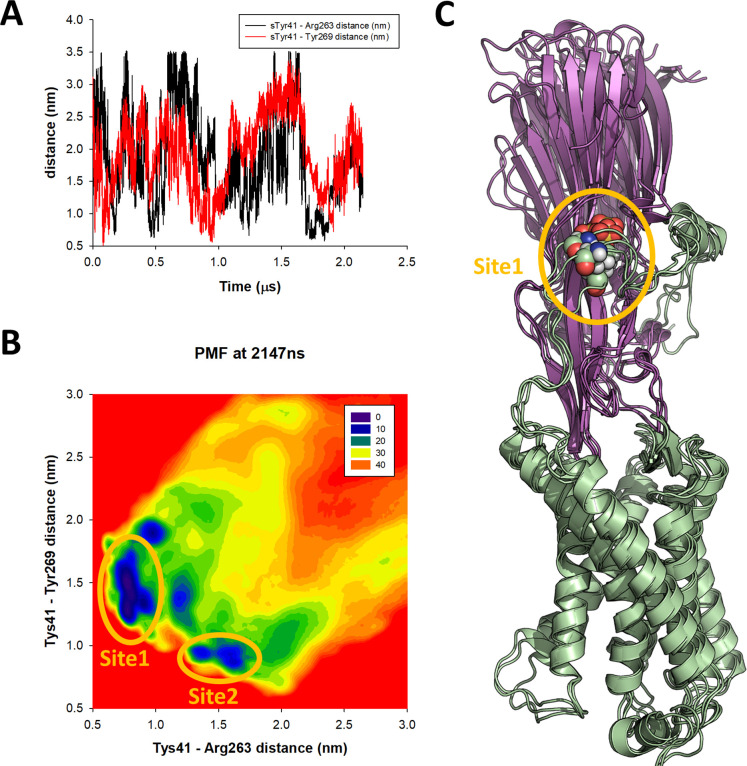
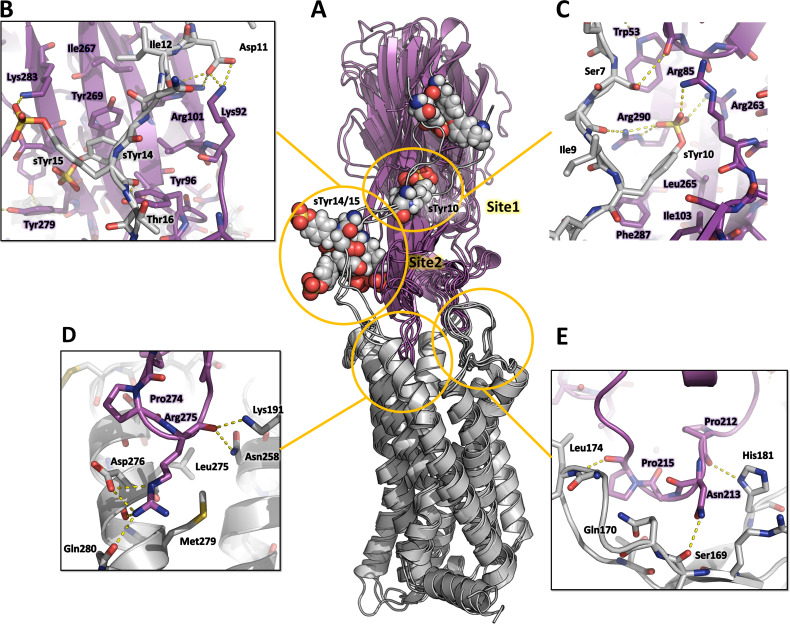
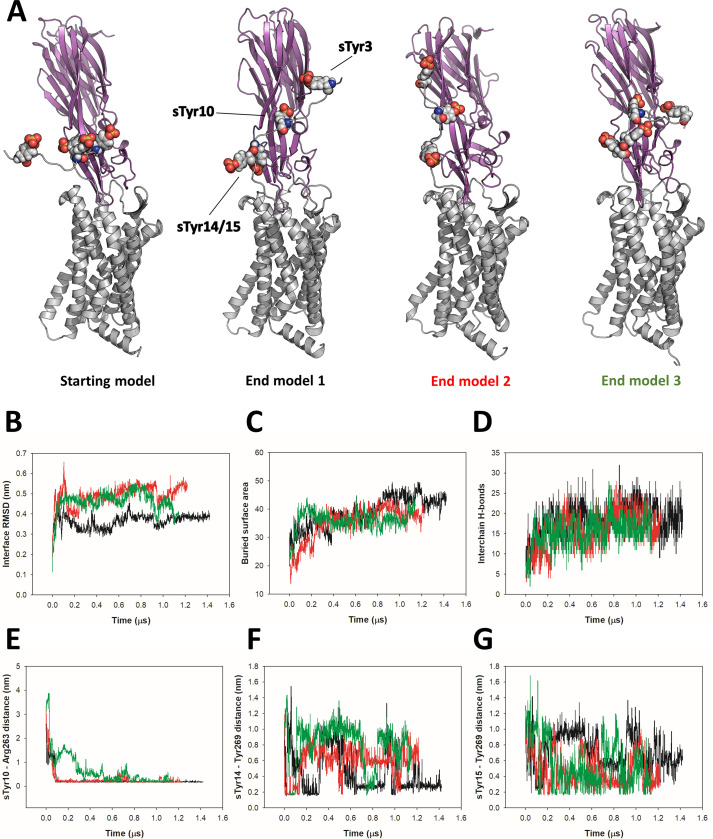
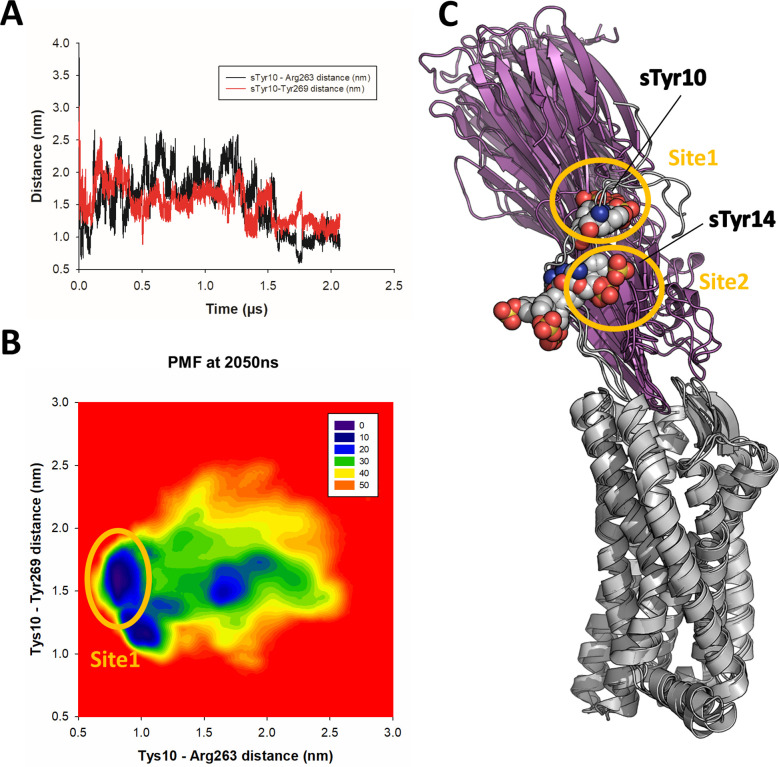
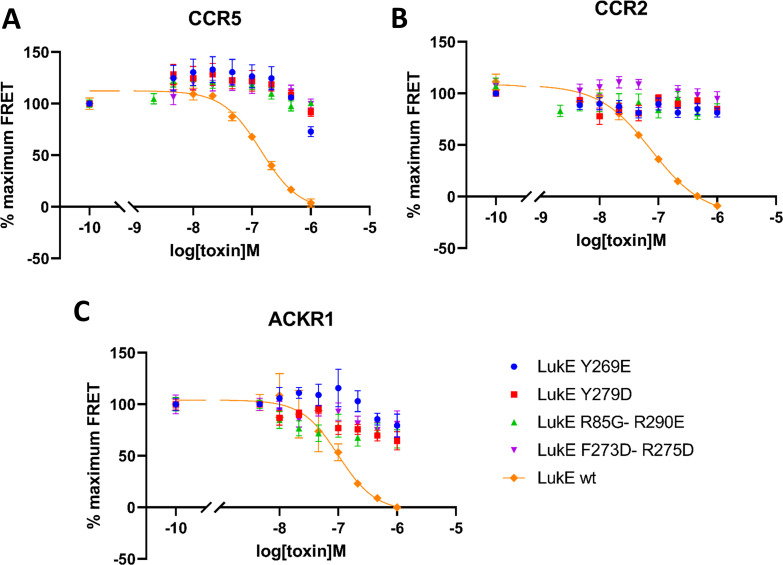
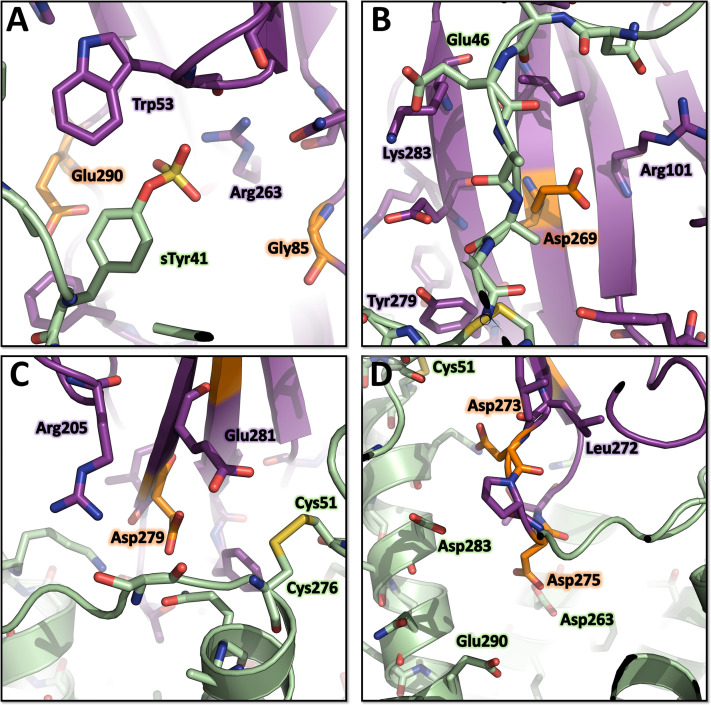
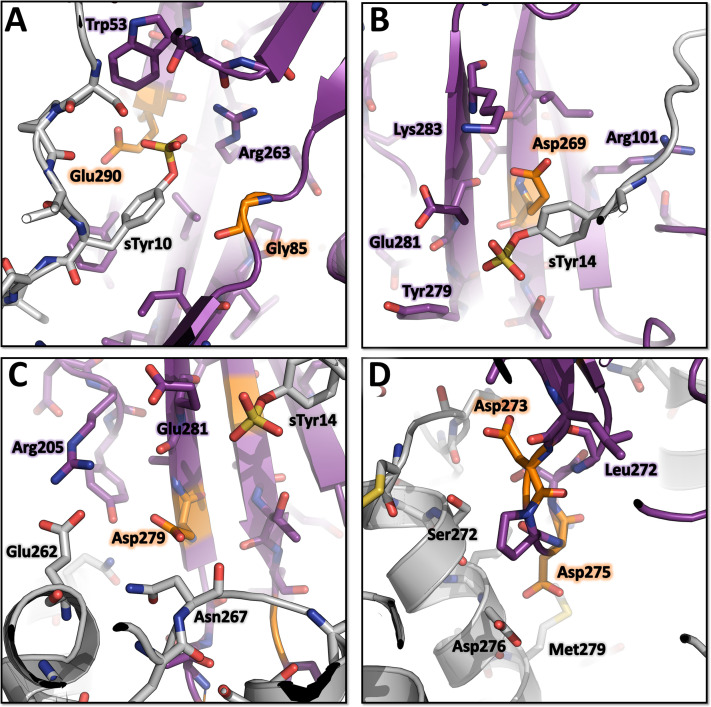
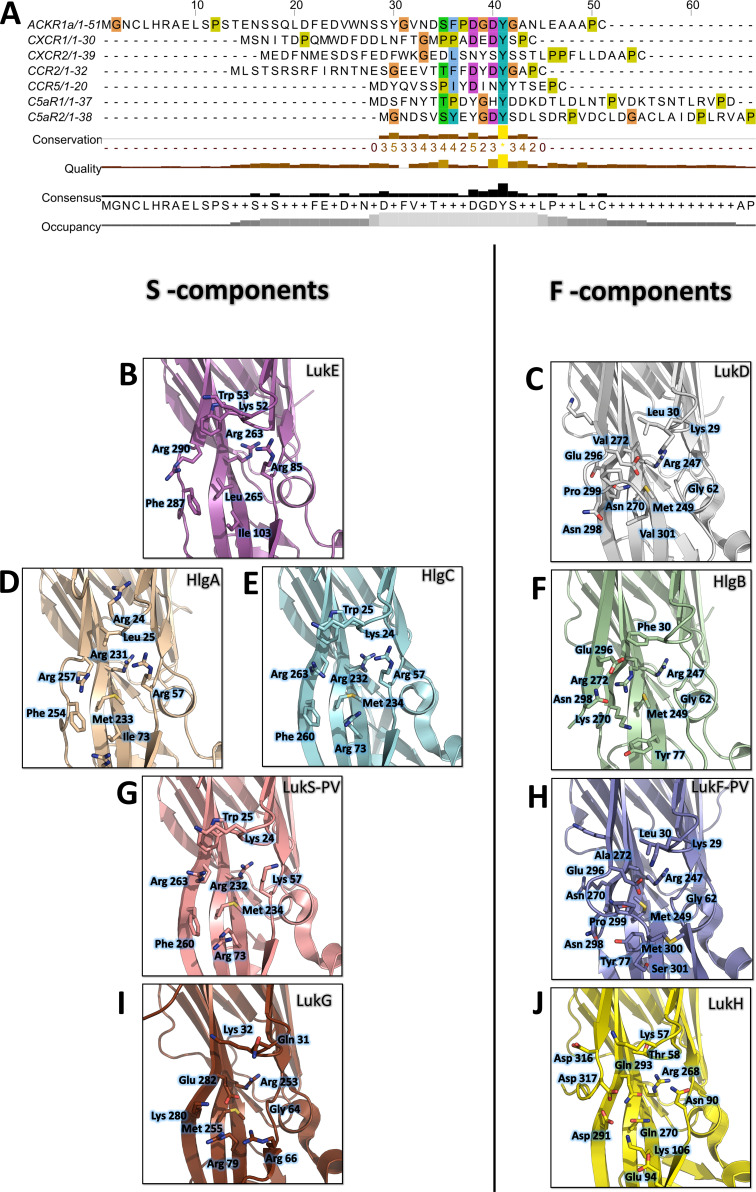
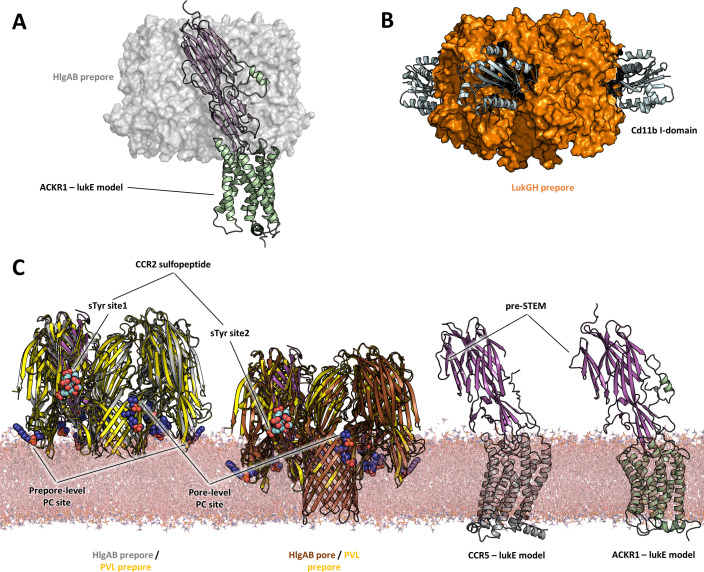
Staphylococcus aureus (SA) leukocidin ED (LukED) belongs to a family of bicomponent pore forming toxins that play important roles in SA immune evasion and nutrient acquisition. LukED targets specific G protein-coupled chemokine receptors to lyse human erythrocytes (red blood cells) and leukocytes (white blood cells). The first recognition step of receptors is critical for specific cell targeting and lysis. The structural and molecular bases for this mechanism are not well understood but could constitute essential information to guide antibiotic development. Here, we characterized the interaction of LukE with chemokine receptors ACKR1, CCR2, and CCR5 using a combination of structural, pharmacological, and computational approaches. First, crystal structures of LukE in complex with a small molecule mimicking sulfotyrosine side chain (p-cresyl sulfate) and with peptides containing sulfotyrosines issued from receptor sequences revealed the location of receptor sulfotyrosine binding sites in the toxins. Then, by combining previous and novel experimental data with protein docking, classical and accelerated weight histogram (AWH) molecular dynamics we propose models of the ACKR1-LukE and CCR5-LukE complexes. This work provides novel insights into chemokine receptor recognition by leukotoxins and suggests that the conserved sulfotyrosine binding pocket could be a target of choice for future drug development.

Keywords: GPCRs; S. aureus; chemokine receptors; crystallography; human; infectious disease; microbiology; molecular biophysics; molecular dynamics; structural biology; sulfotyrosine.


Conflict of interest statement

PL, OO, XC, FH, LB, PV, CG, FP, SJ, TD, CB, SG, CL No competing interests declared

Figures

Figure 1.
Figure 1.. Solution and crystallographic structures of leukotoxin LukE.
(A) The crystal structures of LukE in P212121 (Apo 1, green) and I4 (Apo 2, cyan) space groups are shown in cartoon representation and overlaid onto the previously published crystal structure of LukE (magenta), also in I4 space group (PDB code 3ROH). (B) Optimized ensemble of 10 models corresponding to the fitted SAXS profile in C. The N-terminal extension belonging to the signal peptide and the C-terminal polyhistidine tag are shown in orange and black, respectively. The CAP, RIM, and STEM domains are colored in cyan, deep blue and light blue, respectively. Other regions of interest are also indicated such as the D-region, and divergent loops 1–4. (C) Small angle x-ray scattering (SAXS) profiles of LukE measured at 1, 2, and 4 mg/ml are shown as black, red and green lines, respectively. The merged SAXS curve is shown as a brown line with the fitting curve obtained using the ensemble optimization method (EOM) in orange. (D) Radius of gyration distributions for the initial pool ensemble (gray area and black line) and for the optimized ensembles (red bars) obtained using the merged SAXS curve.
Figure 1—figure supplement 1.
Figure 1—figure supplement 1.. Crystallographic packing differences between LukE structures, LukE flexibility in crystal structures and molecular dynamics simulations.
(A–C) Crystallographic packing differences between LukE apo 1 structure in P212121 space group (A), apo 2 (B) and the previously published structure (C) (PDB code: 3ROH), both in I4 space group. (D–F) B-factor putty representation of the apo 1, apo 2, and 3ROH crystal structures, highlighting the flexibility of the stem loop and the divergent region (DR) loops within the rim domain, as well as the influence of crystal packing on the flexible regions. (G–I) Molecular dynamics simulations data of LukE. (G) Radius of gyration (Rg) over time is shown for two independent molecular dynamics (MD) trajectories performed with the amber99sb-ildn (black line) or amber99sbw (red line). The amber99sbw force field was parameterized with rescaled water-protein interactions to improve the sampling of intrinsically disordered regions (reference), avoiding the collapse of LukE N-terminal signal peptide and C-terminal polyhistidine tag onto the protein core. (H and I) B-factor putty representation of the root mean square fluctuations of LukE extracted from the amber99sb-ildn (H) or amber99sbw (I) trajectories.
Figure 1—figure supplement 2.
Figure 1—figure supplement 2.. Native MS spectrum of LukE.
nMS spectrum of 20 µM LukE showing the presence of both monomeric species (single purple circle) at 34,508 ± 4 Da and dimeric species (double purple circle) at 69,108 ± 8 Da. Theoretical mass of LukE is 34,506 Da. hydrolysed isoforms of lukE are also visible at low intensities (asterisks).
Figure 2.
Figure 2.. Binding of LukE in live cells as determined by competition time-resolved fluorescence energy transfer (TR-FRET).
The upper panel shows a schematic of the competitive TR-FRET assay. Addition of toxins disrupts energy transfer between a SNAP-tagged receptor labeled with a Terbium donor and a d2-chemokine acceptor (Zwier et al., 2010). The bottom panel shows the competition dose-response curves at receptors CCR5, ACKR1, and CCR2. 5 nM tracer ligands, CCL5-d2 for CCR5 and ACKR1 and CCL2-d2 for CCR2 were used to determine TR-FRET at their respective receptors in the presence of LukE. IC50 values are quoted in-text. Data shown is mean ± SEM of three independent experiments performed in triplicate.
Figure 3.
Figure 3.. Crystal structure of LukE in complex with p-cresyl sulfate.
(A) Overview of the asymmetric unit of the crystal. Protein is shown in cartoon representation and colored magenta. The p-cresol sulfate molecules are shown in yellow sticks with surrounding protein residue sidechains in magenta lines (B–D). Close ups of the sulfotyrosine binding sites. The color code is the same as in (A) with p-cresol sulfate molecules and protein sidechains shown in sticks. Polar contacts between ligand and protein are shown as yellow dashed lines. In (D), protein residues from an interacting symmetry related molecule are shown in gray cartoon and sticks.
Figure 3—figure supplement 1.
Figure 3—figure supplement 1.. 2Fo-Fc electron density maps of LukE complexes overlaid with the corresponding models.
For each structure, the model is shown in cartoon representation with a color code similar to Figures 3 and 4 and Figure 5. The electron density maps are shown as mesh and contoured at 1.2σ. (A) 2Fo-Fc map for the p-cresol sulfate-soaked structure. (B) 2Fo-Fc map for the ACKR1 34DSFPDGDsYGANLE46 -soaked structure (C). 2Fo-Fc map for the CCR2 25DsYDsYG29 -soaked structure, corresponding to the conformation that was deposited in the PDB. D. Same as in C, but the model was modified to show a third possible alternate conformation of sTyr26, suggesting the peptide is in equilibrium between different bound conformations.
Figure 3—figure supplement 2.
Figure 3—figure supplement 2.. Polder omit maps of LukE complexes overlaid with the corresponding models.
For each structure, the model is shown in cartoon representation with a color code similar to Figures 3 and 4 and Figure 5. The Polder maps for the soaked ligands are shown as mesh and contoured at 2.5σ for the p-cresol sulfate (A), ACKR1 34DSFPDGDsYGANLE46 (B) and CCR2 25DsYDsYG29 (C) soaked structures.
Figure 4.
Figure 4.. Crystal structures of LukE in complex with ACKR1 peptide 34DSFPDGDsYGANLE46 and CCR2 peptide 25DsYDsYG29.
(A) Overview of the asymmetric unit of the ACKR1 peptide-soaked crystal. Protein is shown in cartoon representation and colored in magenta. The two copies of the peptide with their respective sulfotyrosine residue bound to site 1 and 2 are shown in white and green cartoon and sticks representation. Surrounding protein sidechains are shown as magenta lines. (B) Overview of the asymmetric unit of the CCR2 peptide-soaked crystal. Protein is shown in cartoon representation and colored in magenta. The CCR2 peptide is shown in cyan cartoon and sticks representation. Surrounding protein sidechains are shown as magenta lines. (C and D) Close ups of the sulfotyrosine binding site 1 in the ACKR1 (C) and CCR2 (D) peptide-soaked crystals. The color code is the same as in (A) and (B) with peptide and protein sidechains shown in sticks. Polar contacts between ligand and protein are shown as yellow dashed lines. (E and F). Close ups of the sulfotyrosine binding site 2 in the ACKR1 (E) and CCR2 (F) peptide-soaked crystals. Protein residues from an interacting symmetry related molecule are shown in grey cartoon and sticks.
Figure 5.
Figure 5.. Computational docking of ACKR1-LukE and CCR5-LukE.
(A) Mapping of the LukE residues potentially involved in receptor binding. LukE is shown in semi-transparent surface and cartoon representation and colored in magenta. Site 1 and 2 sulfotyrosine binding sites are colored in orange. Other residues that are potentially involved in receptor binding are colored in yellow based on previous mutagenesis work (Nariya and Kamio, 1997; Reyes-Robles et al., 2013; Tam et al., 2016; Peng et al., 2018; Vasquez et al., 2020). (B) and (C). HADDOCK score versus interface root mean square deviations (iRMSD- relative to the best scoring model) plots for the best ACKR1-LukE (B) and CCR5-LukE (C) docking runs. The best cluster identified by HADDOCK (cluster 1) is shown in blue. (D) and (E). ACKR1-LukE (D) and CCR5-LukE (E) top scoring models selected from HADDOCK simulations, after addition of the missing N-terminal region (residues 8–50 of ACKR1 and residues 1–19 of CCR5), energy minimization and MD equilibration. The receptor is shown in cartoon representation and colored in pale green (ACKR1) or light gray (CCR5). Sulfated tyrosines are shown as spheres.
Figure 6.
Figure 6.. Computational model of the ACKR1-LukE complex extracted from molecular dynamics (MD) simulations.
(A) Superimposed MD snapshots extracted from the last 300 ns of simulation (three snapshots taken at 100 ns interval). The receptor and toxin are shown in cartoon representation and colored in pale green and magenta, respectively. ACKR1 sTyr 41 is shown as spheres. (B, C and D). Close ups of the interactions observed in the proposed model at the sulfotyrosine binding site 1 (B), sulfotyrosine binding site 2 (C), and the orthosteric pocket (D). The MD model of ACKR1-LukE corresponds to the middle structure of the largest cluster in the MD trajectory. Interacting residues are displayed as sticks. The color code is the same as in (A).
Figure 6—figure supplement 1.
Figure 6—figure supplement 1.. Analysis of ACKR1-LukE molecular dynamics (MD) simulations.
(A) Starting model and end model snapshots for each of the three independent CCR5-LukE MD trajectories. (B–G) Time-dependent properties of the system extracted from MD simulations for trajectories 1, 2, and 3 (black, red, and green lines, respectively): RMSD of the interface residues relative to the starting model (B), buried surface area in the complex (C), number of interchain hydrogen bonds (D), sTyr41-Arg263 minimum distance (E), and Glu46-Tyr269 minimum distance (F). Interface residues for interface root mean square deviations (iRMSD) calculation were defined based on the starting structure using a 1 nm cutoff, and calculation was performed on Cα atoms.
Figure 6—figure supplement 2.
Figure 6—figure supplement 2.. accelerated weight histogram (AWH) molecular dynamics (MD) simulation of the ACKR1-LukE model.
(A) sTyr 41–Arg263 (site 1 – black line) and sTyr41–Tyr269 (site 2 – red line) center of mass (COM) distance as a function of simulation time, highlighting the extensive sampling of these variables during the AWH simulation. (B) Final potential of mean force (PMF) profile calculated at t = 2.147 µs. The heat map represents free energies in kJ/mol. The energy wells corresponding to site 1 and site 2 interactions are circled in orange. (C) Three snapshots extracted from the AWH MD simulation at t = 1.730, 1.740, and 1.750 µs are superimposed, which sample the global energy minimum of the PMF.
Figure 7.
Figure 7.. Computational model of the CCR5-LukE complex extracted from molecular dynamics (MD) simulations.
(A) Superimposed MD snapshots extracted from the last 300ns of simulation (3 snapshots taken at 100 ns interval). The receptor and toxin are shown in cartoon representation and colored in light gray and magenta, respectively. CCR5 sTyr residues are shown as spheres. (B–E). Close ups of the interactions observed in the proposed model at the sulfotyrosine binding site 2 (B), sulfotyrosine binding site 1 (C), orthosteric pocket (D) and CCR5 eCL2/LukE loop3 region (E). The MD model of CCR5-LukE corresponds to the middle structure of the largest cluster in the MD trajectory. Interacting residues are displayed as sticks. The color code is the same as in (A).
Figure 7—figure supplement 1.
Figure 7—figure supplement 1.. Analysis of CCR5-LukE molecular dynamics (MD) simulations.
(A) Starting model and end model snapshots for each of the three independent CCR5-LukE MD trajectories. (B–G) Time-dependent properties of the system extracted from MD simulations for trajectories 1, 2, and 3 (black, red, and green lines, respectively): RMSD of the interface residues relative to the starting model (B), buried surface area in the complex (C), number of interchain hydrogen bonds (D), sTyr10 - Arg263 minimum distance (E), sTyr14 - Tyr269 minimum distance (F), and sTyr15 - Tyr269 minimum distance (G). Interface residues for interface root mean square deviations (iRMSD) calculation were defined based on the starting structure using a 1 nm cutoff, and calculation was performed on Cα atoms.
Figure 7—figure supplement 2.
Figure 7—figure supplement 2.. Accelerated weight histogram (AWH) molecular dynamics (MD) simulation of the CCR5-LukE model.
(A) sTyr 10 – Arg263 (site 1 – black line) and sTyr10 – Tyr269 (site 2 – red line) center of mass (COM) distance as a function of simulation time, highlighting the extensive sampling of these variables during the AWH simulation. (B) Final potential of mean force (PMF) profile calculated at t = 2.050 µs. The heat map represents free energies in kJ/mol. The energy well corresponding to site 1 interaction is circled in orange. (C) Three snapshots extracted from the AWH MD simulation at t = 0.02, 0.03, and 0.09 µs are superimposed, which sample the global energy minimum of the PMF.
Figure 8.
Figure 8.. Effects of R85G + R290 E, Y269D, Y279D, and F273D + R275 D mutations on the binding of LukE in live cells as determined by competition time-resolved fluorescence energy transfer (TR-FRET).
5 nM tracer ligands, CCL5-d2 for CCR5 (A) and ACKR1 (C) and CCL2-d2 for CCR2 (B), were used to determine TR-FRET at their respective receptors in the presence of LukE mutants or wild-type LukE. IC50 values were undetermined for LukE mutants due to loss of binding. Data shown is mean ± SEM of three independent experiments performed in triplicate.
Figure 8—figure supplement 1.
Figure 8—figure supplement 1.. Environment of the mutated LukE residues in the ACKR1-LukE model.
(A) Close up of sulfotyrosine binding site 1 in the ACKR1-LukE model with the R85G-R290E mutations. (B) Close up of sulfotyrosine binding site 2 in the ACKR1-LukE model with the Y269E mutation. (C) Close up of the orthosteric pocket near TM7 and extracellular loop 3 in the ACKR1-LukE model showing the Y279D mutation in the vicinity of the Cys51-Cys276 disulfide bridge. (D) Close up of the orthosteric pocket in the ACKR1-LukE model showing the F273D-R275D mutations.
Figure 8—figure supplement 2.
Figure 8—figure supplement 2.. Environment of the mutated LukE residues in the CCR5-LukE model.
(A) Close up of sulfotyrosine binding site 1 in the CCR5-LukE model with the R85G-R290E mutations. (B) Close up of sulfotyrosine binding site 2 in the CCR5-LukE model with the Y269E mutation. (C) Close up of the orthosteric pocket near extracellular loop 3 in the CCR5-LukE model showing the Y279D mutation. (D) Close up of the orthosteric pocket in the CCR5-LukE model showing the F273D-R275D mutations.
Figure 9.
Figure 9.. Conservation of the sulfotyrosine sites in the N-terminal region of leukotoxins receptors and structural alignment of Staphylococcus aureus bicomponent pore forming toxins in the sulfotyrosine binding region (site 1).
(A) Manual sequence alignment of the sulfotyrosine motifs in the N-terminal region of the bicomponent pore forming toxin receptors. (B–J) Comparison of sulfotyrosine site 1 residues in SA bi-component leukotoxin x-ray structures. (B) LukE apo1. (C) LukD (PDB ID 6U2S, Liu et al., 2020). (D) HlgA (PDB ID 2QK7, Roblin et al., 2008). (E) HlgC (PDB ID 4P1X, Yamashita et al., 2014). (F) HlgB (PDB ID 3LKF, Olson et al., 1999). (G) LukS-PV (PDB ID 1T5R, Guillet et al., 2004). (H) LukF-PV (PDB ID 1PVL, Pédelacq et al., 1999). (I and J) LukG and lukH (PDB ID 5K59, Badarau et al., 2016).
Figure 10.
Figure 10.. Comparisons of LukE-CCR2 peptide x-ray structure, ACKR1-LukE and CCR5-LukE models with existing x-ray structures.
(A) Structural alignment of LukE from the ACKR1-LukE model with the HlgAB prepore structure (PDB ID 4P1Y), illustrating that the N-terminal region of ACKR1 binds to a surface located on the outer part of the prepore. The HlgAB prepore is shown as a semitransparent surface and the ACKR1-LukE model as cartoon. (C) X-ray structure of LukGH bound to human CD11b I-domain. The LukGH prepore is shown as a semitransparent surface and the CD11b I-domain as cartoon. (C) The HlgAB pore and prepore structures (PDB IDs 3B07 and 4P1Y) are shown in their membrane context using a POPC bilayer extracted from MDS simulations. On the left, the HlgAB pore and prepore structures are superimposed to the PVL prepore (PDB ID 6U3Y) bound with fos-choline-14 (shown as blue spheres). One of the lukF-PV/HlgB protomer is omitted for clarity. The structural alignment highlights the presence of lipid headgroup binding sites on lukF-PV that correspond to different membrane insertion depths, which we interpreted as pore and prepore membrane levels. The LukE-CCR2 peptide structure is also superimposed onto the pore and prepore structures to indicate the location of the bound sulfotyrosines (shown as cyan spheres). In the case of a fully formed pore, sTyr sulfate at site 2 is located at the same level as the PC headgroups. On the right, the ACKR1-LukE and CCR5-LukE models are shown in their membrane context, and oriented to visualize the acute angle between LukE and the membrane.
Author response image 1.
Author response image 2.

Similar articles

Cited by

References

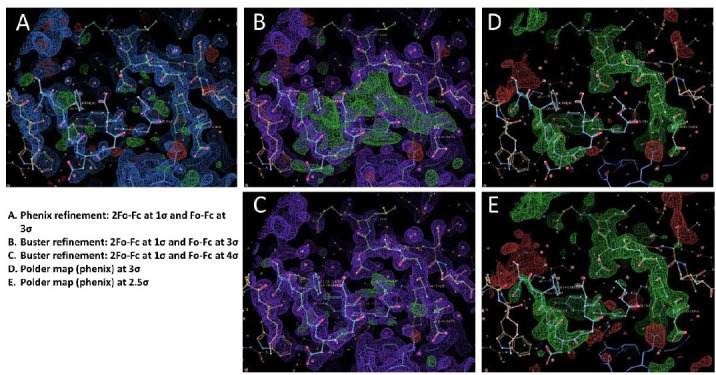
    1. Adams PD, Afonine PV, Bunkóczi G, Chen VB, Davis IW, Echols N, Headd JJ, Hung L-W, Kapral GJ, Grosse-Kunstleve RW, McCoy AJ, Moriarty NW, Oeffner R, Read RJ, Richardson DC, Richardson JS, Terwilliger TC, Zwart PH. PHENIX: a comprehensive Python-based system for macromolecular structure solution. Acta Crystallographica. Section D, Biological Crystallography. 2010;66:213–221. doi: 10.1107/S0907444909052925. - DOI - PMC - PubMed
    1. Alonzo F, Kozhaya L, Rawlings SA, Reyes-Robles T, DuMont AL, Myszka DG, Landau NR, Unutmaz D, Torres VJ. CCR5 is a receptor for Staphylococcus aureus leukotoxin ED. Nature. 2013;493:51–55. doi: 10.1038/nature11724. - DOI - PMC - PubMed
    1. Badarau A, Rouha H, Malafa S, Battles MB, Walker L, Nielson N, Dolezilkova I, Teubenbacher A, Banerjee S, Maierhofer B, Weber S, Stulik L, Logan DT, Welin M, Mirkina I, Pleban C, Zauner G, Gross K, Jägerhofer M, Magyarics Z, Nagy E. Context matters: The importance of dimerization-induced conformation of the LukGH leukocidin of Staphylococcus aureus for the generation of neutralizing antibodies. MAbs. 2016;8:1347–1360. doi: 10.1080/19420862.2016.1215791. - DOI - PMC - PubMed
    1. Bernadó P, Mylonas E, Petoukhov MV, Blackledge M, Svergun DI. Structural characterization of flexible proteins using small-angle X-ray scattering. Journal of the American Chemical Society. 2007;129:5656–5664. doi: 10.1021/ja069124n. - DOI - PubMed
    1. Bernardi RC, Melo MCR, Schulten K. Enhanced sampling techniques in molecular dynamics simulations of biological systems. Biochimica et Biophysica Acta. 2015;1850:872–877. doi: 10.1016/j.bbagen.2014.10.019. - DOI - PMC - PubMed

Publication types

MeSH terms