. 2022 Mar 21:11:e75230.
doi: 10.7554/eLife.75230.

Stage-specific control of oligodendrocyte survival and morphogenesis by TDP-43

Affiliations

Stage-specific control of oligodendrocyte survival and morphogenesis by TDP-43

Dongeun Heo et al. Elife. .

Abstract

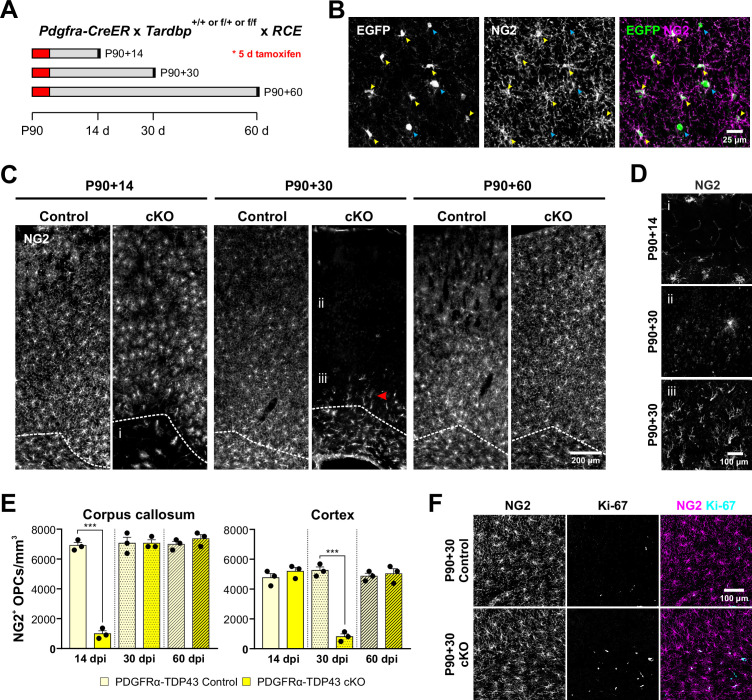
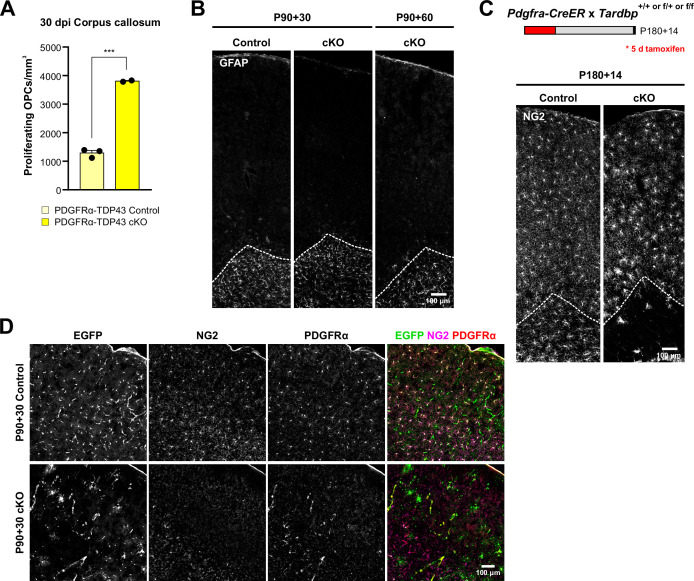
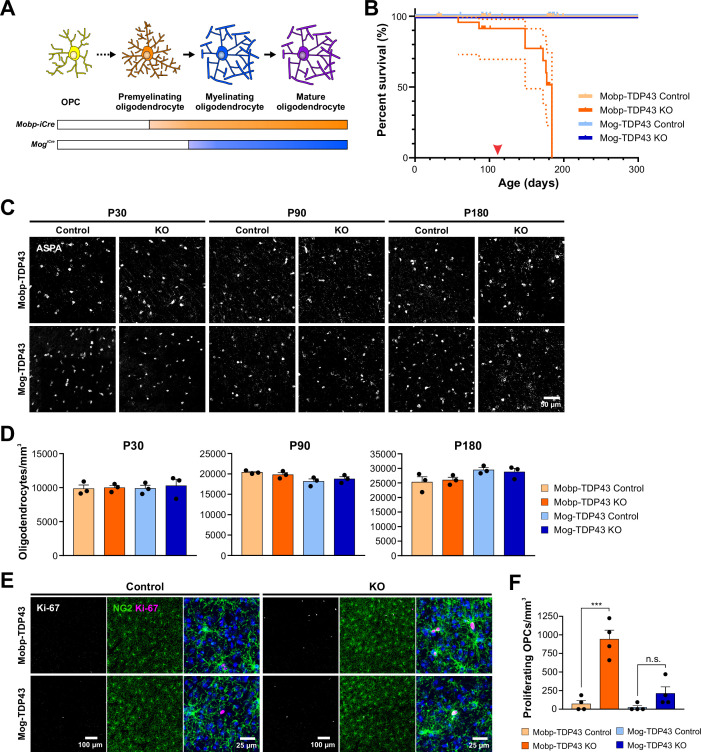
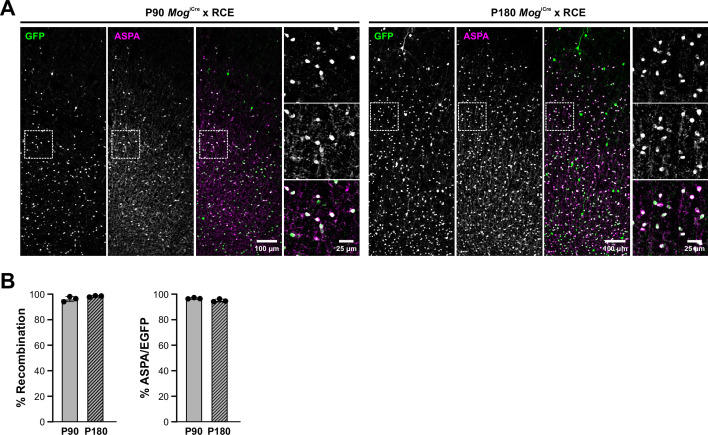
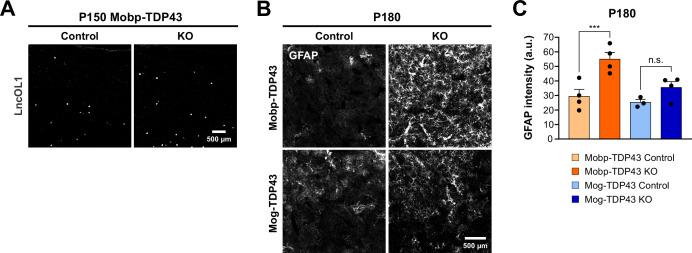
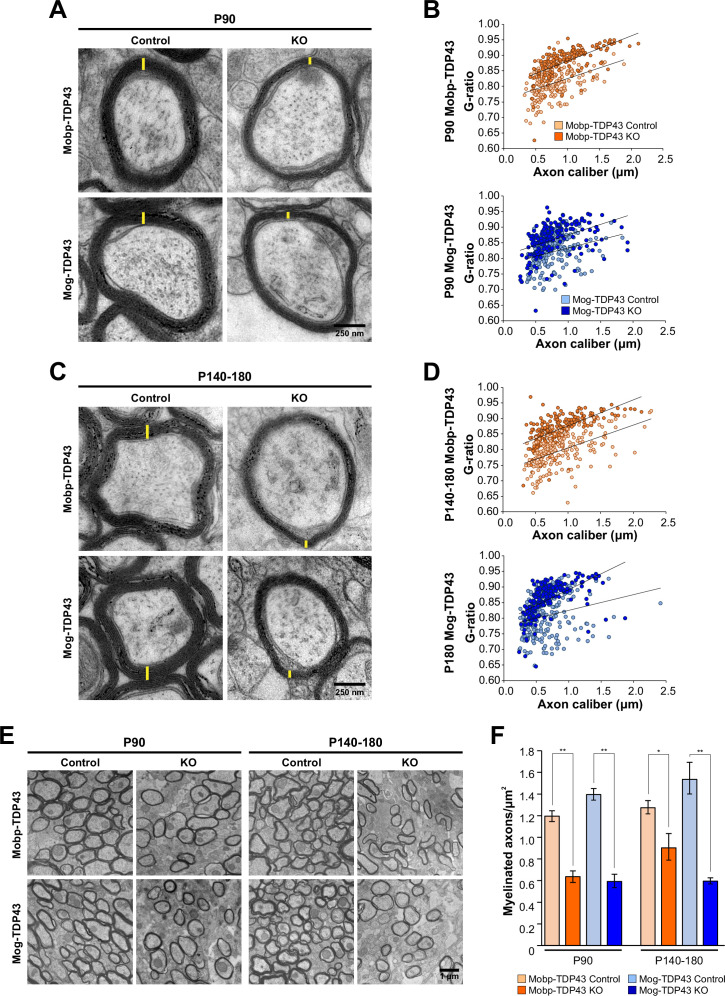
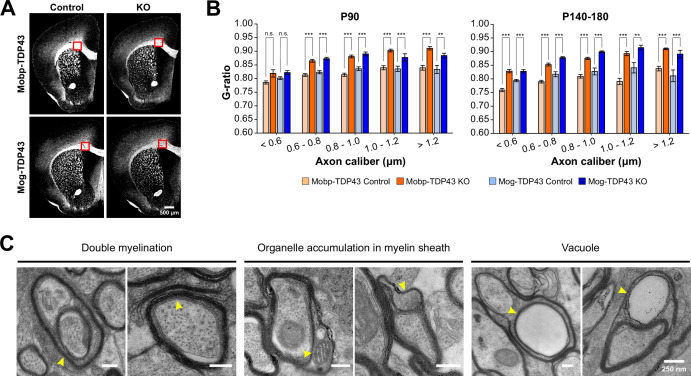
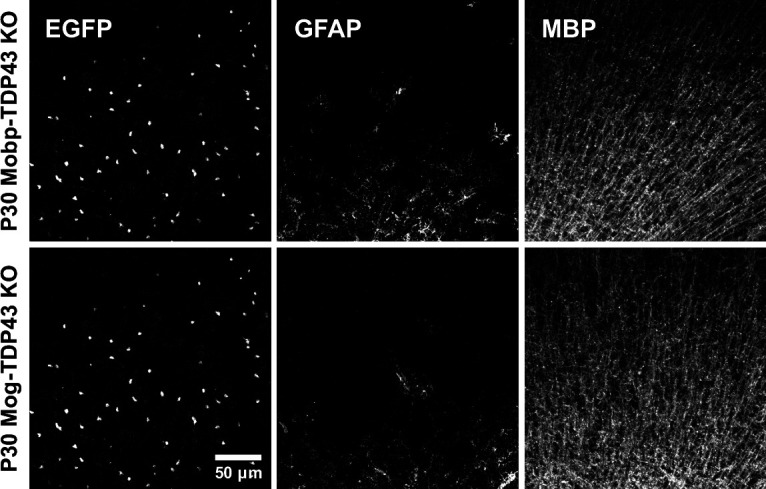
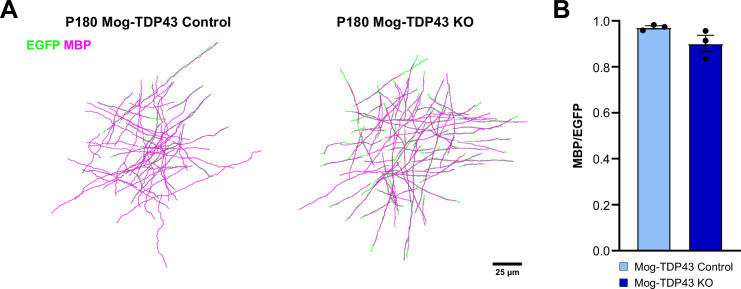
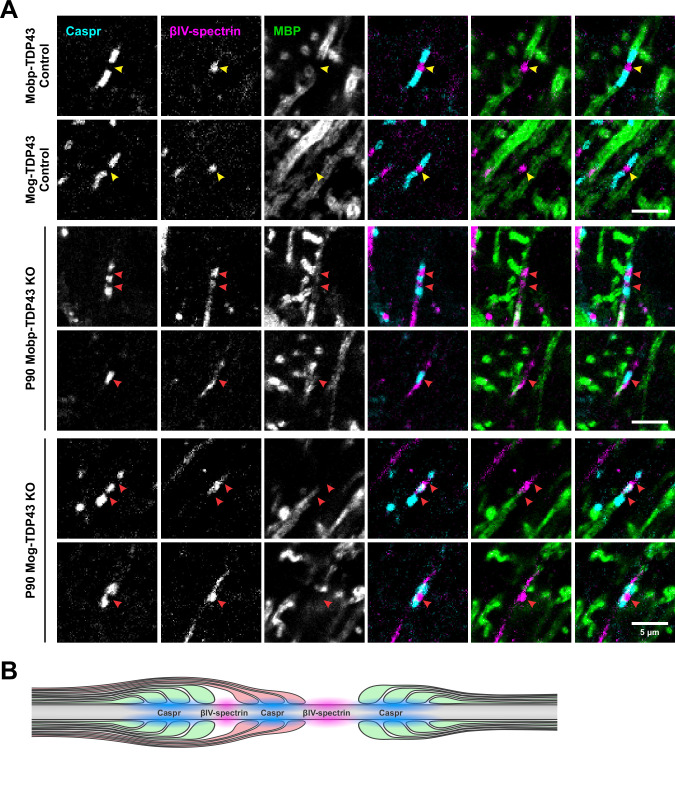
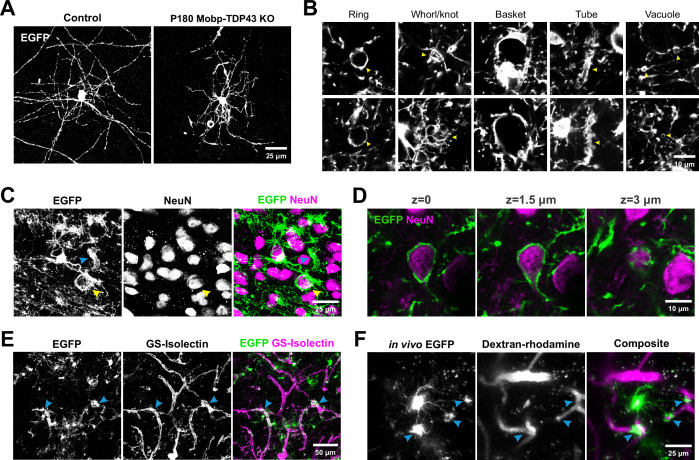
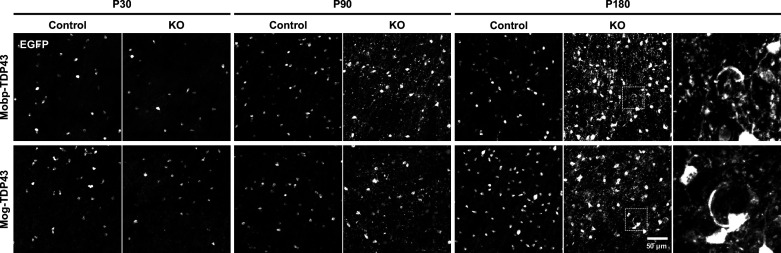
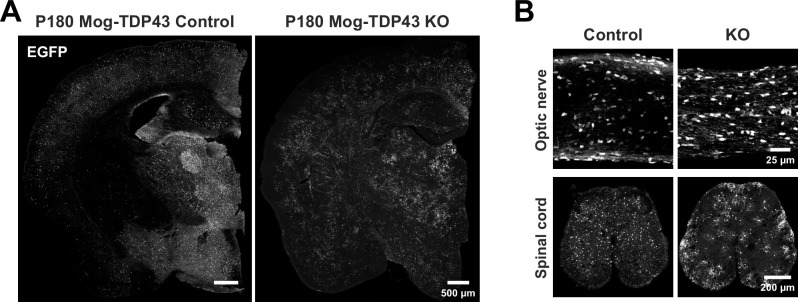
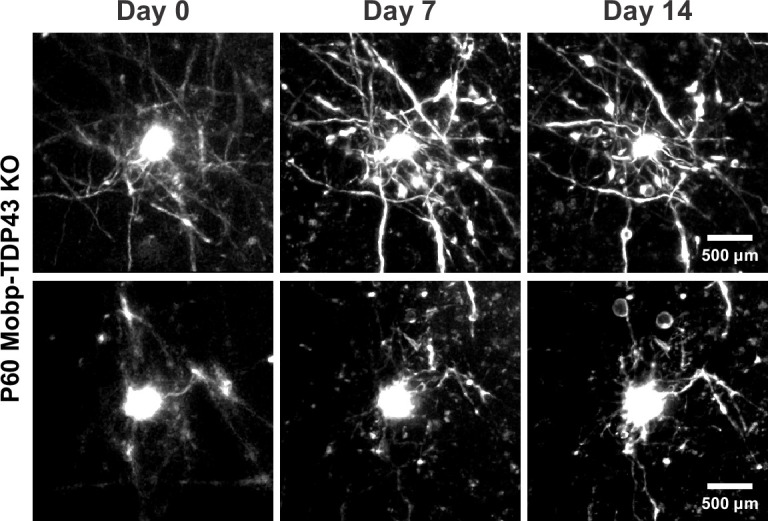
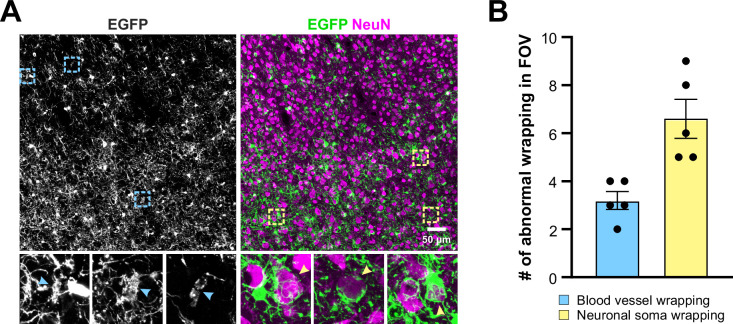
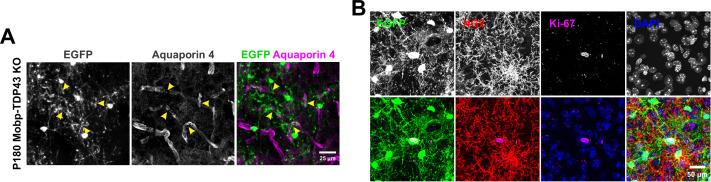
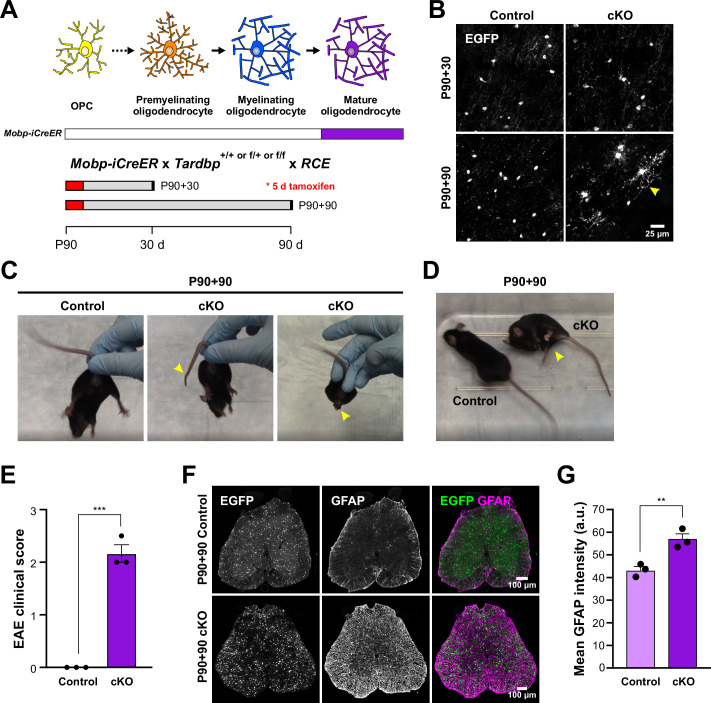
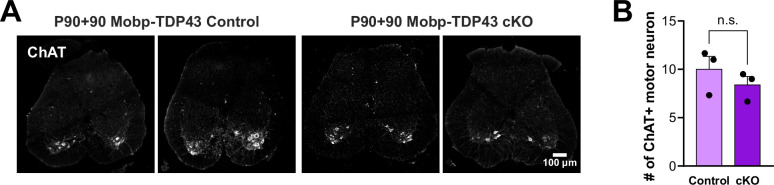
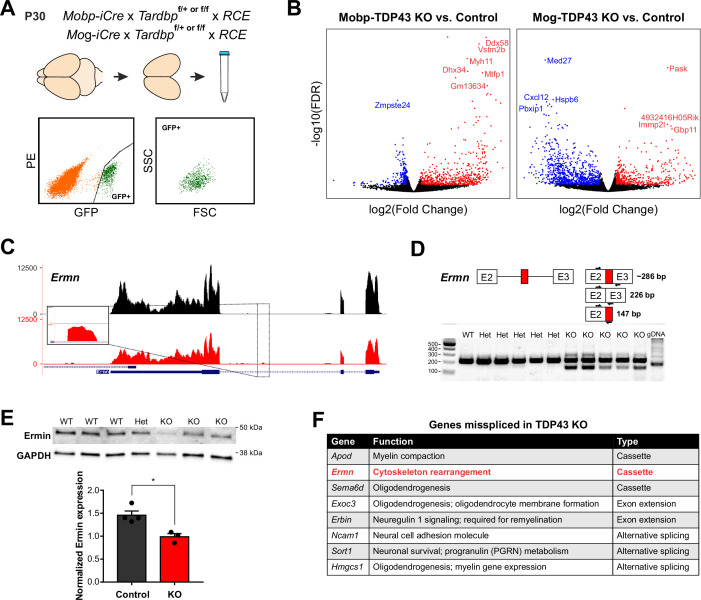
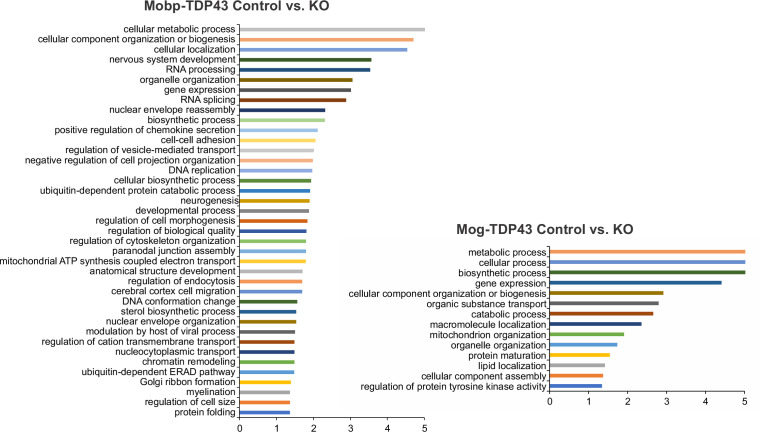
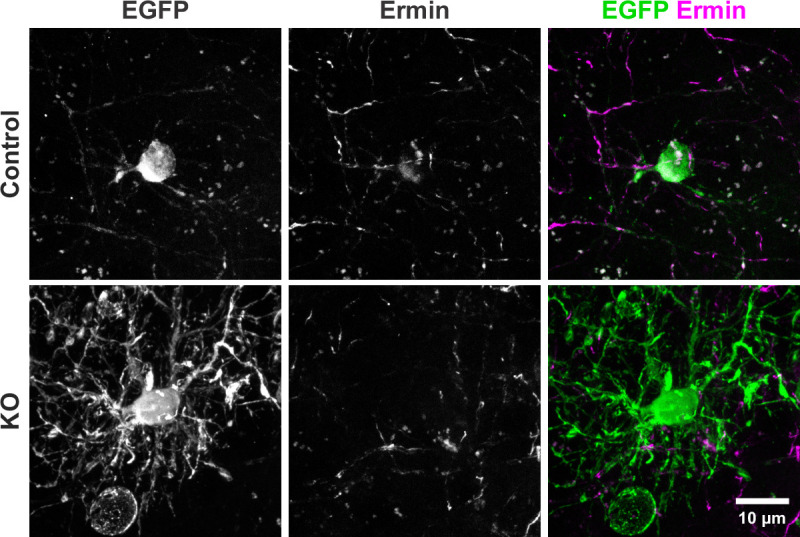
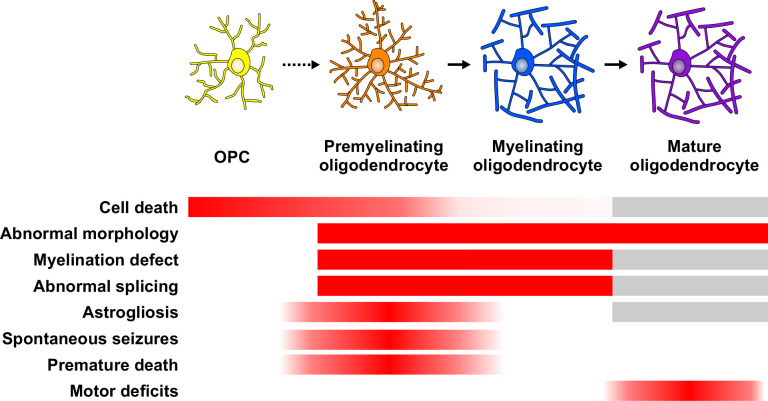
Generation of oligodendrocytes in the adult brain enables both adaptive changes in neural circuits and regeneration of myelin sheaths destroyed by injury, disease, and normal aging. This transformation of oligodendrocyte precursor cells (OPCs) into myelinating oligodendrocytes requires processing of distinct mRNAs at different stages of cell maturation. Although mislocalization and aggregation of the RNA-binding protein, TDP-43, occur in both neurons and glia in neurodegenerative diseases, the consequences of TDP-43 loss within different stages of the oligodendrocyte lineage are not well understood. By performing stage-specific genetic inactivation of Tardbp in vivo, we show that oligodendrocyte lineage cells are differentially sensitive to loss of TDP-43. While OPCs depend on TDP-43 for survival, with conditional deletion resulting in cascading cell loss followed by rapid regeneration to restore their density, oligodendrocytes become less sensitive to TDP-43 depletion as they mature. Deletion of TDP-43 early in the maturation process led to eventual oligodendrocyte degeneration, seizures, and premature lethality, while oligodendrocytes that experienced late deletion survived and mice exhibited a normal lifespan. At both stages, TDP-43-deficient oligodendrocytes formed fewer and thinner myelin sheaths and extended new processes that inappropriately wrapped neuronal somata and blood vessels. Transcriptional analysis revealed that in the absence of TDP-43, key proteins involved in oligodendrocyte maturation and myelination were misspliced, leading to aberrant incorporation of cryptic exons. Inducible deletion of TDP-43 from oligodendrocytes in the adult central nervous system (CNS) induced the same progressive morphological changes and mice acquired profound hindlimb weakness, suggesting that loss of TDP-43 function in oligodendrocytes may contribute to neuronal dysfunction in neurodegenerative disease.

Keywords: ALS; TDP-43; cerebral cortex; developmental biology; mRNA; mouse; myelin; oligodendrocyte; progenitor.


Conflict of interest statement

DH, JL, GM, AL, AW, KN, PW, DB No competing interests declared, WM Reviewing editor, eLife

Figures

Figure 1.
Figure 1.. Oligodendrocyte precursor cells (OPCs) require TDP-43 for survival.
(A) Schematics of CreER activation. At P90, tamoxifen was administered for five consecutive days. Tissue samples were collected 14, 30, and 60 days after the last day of tamoxifen injection. (B) Pdgfra-CreER;RCE allows labeling of oligodendrocyte lineage cells. Yellow arrowheads indicate EGFP+NG2+ OPCs whereas blue arrowheads indicate EGFP+NG2− oligodendrocytes. (C) NG2 staining shows that there is a regional progression in OPC degeneration from white matter to gray matter. The dotted line separates the corpus callosum from cortex. i, ii, and iii regions are zoomed in in D. (D) Region i shows the corpus callosum with a near complete loss of OPCs at P90 + 14. ii shows loss of OPCs in the cortex at P90 + 30. iii shows highly polarized OPCs migrating from the corpus callosum up to cortex. (E) Quantification of NG2+ OPC density in corpus callosum and cortex at 14, 30, and 60 days post injection of tamoxifen (dpi). Statistical significance was determined using one-way ANOVA with Tukey’s multiple comparisons test (n = 4, ***p value < 0.001, n.s. p value >0.05). (F) Ki-67+NG2 + proliferating OPCs increase in number at P90 + 60 in the corpus callosum of PDGFRα-TDP43 KO.
Figure 1—figure supplement 1.
Figure 1—figure supplement 1.. PDGFRα-TDP43 cKO shows a regional difference in degeneration of oligodendrocyte precursor cells (OPCs).
(A) Quantification of NG2+Ki-67+ proliferating OPCs in Figure 1F (unpaired, two-tailed Student’s t-test, ***p value = 0.0002, n = 3,2). (B) Coronal brain sections immunostained for GFAP at 30 and 60 days after tamoxifen injection in PDGFRα-TDP43 Control and cKO. (C) Genetic deletion of Tardbp in old, 6-month-old PDGFRα-TDP43 cKO induces OPC degeneration in the corpus callosum at 14 dpi (similar to Figure 1E). (D) Coronal brain sections immunostained for EGFP, NG2, and PDGFRα at 30 days after tamoxifen injection in PDGFRα-TDP43 Control and cKO. Upon Cre recombination, EGFP+NG2+PDGFRα+ OPCs undergo degeneration.
Figure 2.
Figure 2.. Early deletion of TDP-43 in premyelinating oligodendrocytes leads to seizure development, premature death, and increased oligodendrocyte turnover.
(A) Diagram of oligodendrocyte development showing Mobp-iCre induces Tardbp deletion at the premyelinating oligodendrocyte stage whereas Mog-iCre targets myelinating oligodendrocytes. (B) Kaplan–Meier survival curve for Mobp-TDP43 (orange) and Mog-TDP43 (blue) mouse lines. Dotted line indicates the 95% confidence interval. Log-rank (Mantel–Cox) statistical test showed significance at p value <0.0001 (n = 58, 33, 40, and 32). Red arrowhead points to ~P110 when the animals first exhibit spontaneous seizures. (C) ASPA+ oligodendrocyte staining in the motor cortex of Mobp-TDP43 and MOG-TDP43 mouse lines at P30, P90, and P180. (D) Quantification of ASPA+ oligodendrocyte density shows that there is no statistical difference between the samples at any given timepoint (one-way ANOVA with Tukey’s multiple comparisons test, n = 3, n.s. p value >0.05). (E) Immunostaining for Ki-67 and NG2 to identify proliferating oligodendrocyte precursor cells (OPCs) in Mobp-TDP43 and Mog-TDP43 at P90. (F) Quantification of Ki-67+NG2+ proliferating OPC density shows that it is statistically significantly increased in Mobp-TDP43 KO whereas Mog-TDP43 KO shows a trend toward an increased density (one-way ANOVA with Tukey’s multiple comparisons test, n = 4, ***p value <0.001, n.s. p value = 0.3776).
Figure 2—figure supplement 1.
Figure 2—figure supplement 1.. Quantification of Mog-iCre recombination efficiency.
(A) Maximum intensity z-projection confocal images of the motor cortex from Mog-iCre × RCE mice at P90 and P180 immunostained with GFP and ASPA. (B) Quantification of % recombination (EGFP+ASAP+/ASPA+) and % ASPA+/EGFP+ to show recombination efficiency and specificity in P90 and P180 mouse cortex. n = 3.
Figure 2—figure supplement 2.
Figure 2—figure supplement 2.. Characterization of Mobp-iCre and Mobp-iCreERT2 mouse lines.
(A) Schematic of tamoxifen injection in different Mobp-iCreER mouse lines at P35. (B) Representative images of ASPA (oligodendrocyte marker) and NG2 (oligodendrocyte precursor cell [OPC] marker) from Line #10 without tamoxifen and Line #8,16 with and without tamoxifen injections. (C) Quantification of % recombination (EGFP+ASAP+/ASPA+) and % ASPA+/EGFP+ to show recombination efficiency and specificity in Lines #10 and #8,16 in cortex, corpus callosum (CC), spinal cord gray matter (SC GM), and spinal cord white matter (SC WM).
Figure 2—figure supplement 3.
Figure 2—figure supplement 3.. Mobp-TDP43 and Mog-TDP43 mouse lines exhibit differences in response to loss of TDP-43.
(A) Mobp and Mog expression in oligodendrocyte lineage cells (adapted from https://greenberg.hms.harvard.edu/gene-database/ Hrvatin et al., 2018). (B) Mobp and Mog expression in the lineage of oligodendrocytes (adapted from http://linnarssonlab.org/oligodendrocytes/ Marques et al., 2016).
Figure 2—figure supplement 4.
Figure 2—figure supplement 4.. Differential gene expression between premyelinating (orange) and myelinating (blue) oligodendrocytes (OL) (reproduced from the raw single-cell RNA-Seq dataset in Hrvatin et al., 2018).
Top 16 differentially expressed genes are shown. All genes are statistically significantly differentially expressed (q value <0.01).
Figure 2—figure supplement 5.
Figure 2—figure supplement 5.. Mobp-TDP43 KO animals exhibit a higher oligodendrocyte turnover rate and increased astrogliosis.
(A) In situ hybridization for lncOL1 (9630013A20Rik) shows increased number of premyelinating oligodendrocytes in P150 Mobp-TDP43 KO compared to the Control. (B) Immunostaining for GFAP in the motor cortex at P180 in Mobp-TDP43 and Mog-TDP43 mouse lines. Scale bar = 500 μm. (C) Quantification of mean GFAP intensity (arbitrary unit; a.u.) in the motor cortex. One-way ANOVA with Tukey’s multiple comparisons test, ***p value <0.001, n.s. p value >0.05.
Figure 3.
Figure 3.. Loss of TDP-43 oligodendrocytes leads to fewer and thinner myelin sheaths.
(A) Representative transmission electron micrographs of individual axon cross-sections from Mobp-TDP43 and Mog-TDP43 mouse lines at P90 show decreased myelin sheath thickness (yellow) in the KO. Scale bar = 250 nm. (B) G ratios of individual myelinated axons as a function of axon caliber (μm) in the corpus callosum of Mobp-TDP43 (orange) and Mog-TDP43 (blue) mouse lines at P90. n = 3–4/genotype. The solid lines show the lines of best fit with a linear function. (C) A for P140–180 timepoint. (D) B for P140–180 timepoint. (E) Representative electron micrographs of Mobp-TDP43 and Mog-TDP43 mouse lines at P90 and P140–180 show a decreased density of myelinated axons in the KO. Scale bar = 1 μm. (F) Quantification of myelinated axon density in Mobp-TDP43 (orange) and Mog-TDP43 (blue) mouse lines at P90 and P140–180. Statistical significance was determined using unpaired, two-tailed Student’s t-test (**p value <0.01, *p value <0.05, n.s. p value >0.05).
Figure 3—figure supplement 1.
Figure 3—figure supplement 1.. Both Mobp-TDP43 KO and Mog-TDP43 KO brains show significantly increased g-ratio and aberrant myelination.
(A) Tiled mouse brain coronal sections from P90 Mobp-TDP43 and Mog-TDP43 mouse lines immunostained with myelin basic protein (MBP). Red box indicates where transmission electron microscopy (TEM) was performed. (B) Bar graphs of G ratio values for individual axons in different bins of axon caliber (μm). Statistical significance was determined using unpaired, two-tailed Student’s t-test (***p value <0.001, **p value <0.01, n.s. p value >0.05). (C) Examples of abnormal myelination from TEM at the ultrastructural level. Scale bar = 250 nm. Yellow arrowheads indicate abnormal myelin structures.
Figure 3—figure supplement 2.
Figure 3—figure supplement 2.. Immunostaining for GFP, GFAP, and myelin basic protein (MBP) at P30 in Mobp-TDP43 and Mog-TDP43 mouse lines shows that oligodendrocytes and myelin are formed without astrogliosis.
Figure 3—figure supplement 3.
Figure 3—figure supplement 3.. Morphological reconstruction of individual oligodendrocytes and their myelin sheaths.
(A) Representative images of individually traced oligodendrocytes (EGFP) and myelin sheaths (myelin basic protein, MBP) from motor cortex of P180 Mog-TDP43 Control and KO. (B) Quantification of the overlap between EGFP+ oligodendrocyte processes and MBP + myelin shows a trend toward a decrease in the overlap for Mog-TDP43 KO oligodendrocytes compared to the Control oligodendrocytes (Control: 0.9718 ± 0.007, KO: 0.9017 ± 0.036, n = 3, p value = 0.1252).
Figure 3—figure supplement 4.
Figure 3—figure supplement 4.. Diagram of Control (green) and KO (red) oligodendrocytes, where KO oligodendrocytes are making fewer and thinner myelin sheaths.
Figure 3—figure supplement 5.
Figure 3—figure supplement 5.. TDP-43 loss in oligodendrocytes leads to abnormal nodal structures.
(A) Examples of normal (yellow arrowheads) and abnormal (red arrowheads) nodal and paranodal proteins (Caspr, βIV-spectrin, and myelin basic protein [MBP]) in Control and KO at P90. (B) Diagram of double myelination by a KO oligodendrocyte (red) causing Caspr triads (cyan) at the node of Ranvier (magenta).
Figure 4.
Figure 4.. Oligodendrocytes without TDP-43 undergo aberrant morphological changes and exhibit aberrant wrapping of nonaxonal structures.
(A) Representative images of single oligodendrocytes from Control (Mobp-EGFP) and Mobp-TDP43 KO at P180. Scale bar = 25 μm. (B) Examples of abnormal structures formed by TDP-43 KO oligodendrocytes. Yellow arrowheads point to abnormal structures for each category. Scale bar = 10 μm. (C) Immunostaining of GFP and NeuN in Mobp-TDP43-RCE KO shows a formation of basket-like EGFP+ structure that ensheaths NeuN+ neuronal cell body (yellow arrowhead). Blue arrowhead points to a tubing-like EGFP+ structure. Scale bar = 25 μm. (D) Optical serial sections representing 1.5 μm increments in the z-axis showing wrapping of a NeuN+ neuronal soma by EGFP+ oligodendrocyte processes in Mobp-TDP43-RCE KO at P180. Scale bar = 10 μm. (E) Immunostaining of GFP and GS-Isolectin in Mog-TDP43-RCE KO at P180 shows tight wrapping of the blood vessels by EGFP+ oligodendrocyte processes (blue arrowheads). Scale bar = 50 μm. (F) In vivo imaging of Mobp-TDP43-RCE KO mouse after retro-orbital injection of 70 kDa dextran–rhodamine shows wrapping of the capillaries by EGFP+TDP-43 KO oligodendrocyte. Blue arrows show sites of wrapping. Scale bar = 25 μm.
Figure 4—figure supplement 1.
Figure 4—figure supplement 1.. Oligodendrocytes undergo progressive morphological changes with loss of TDP-43.
EGFP images from the motor cortex of Mobp-TDP43-RCE and Mog-TDP43-RCE mouse lines at P30, P90, and P180 show progressive changes in EGFP+ oligodendrocyte morphology where there is no difference at P30 and dramatic abnormality by P180 (yellow arrowheads). Scale bar = 50 μm.
Figure 4—figure supplement 2.
Figure 4—figure supplement 2.. Abnormal oligodendrocyte morphological phenotype due to loss of TDP-43 is persistent throughout the CNS.
(A) Tiled coronal mouse brain section to show that hypertrophic oligodendrocyte changes can be seen throughout the brain at P180. (B) EGFP immunoreactivity shows that abnormal oligodendrocyte morphologies can be seen in the optic nerve and spinal cord.
Figure 4—figure supplement 3.
Figure 4—figure supplement 3.. Longitudinal two-photon in vivo imaging of Mobp-TDP43 KO oligodendrocytes across 14 days.
Figure 4—figure supplement 4.
Figure 4—figure supplement 4.. Aberrant wrapping of non-axonal structures is prevalent in Mobp-TDP43 KO brains.
(A) Motor cortex of P180 Mobp-TDP43 KO shows that aberrant EGFP structures can be readily identified. Blue arrowheads indicate tubing-like structures that resemble blood vessel wrapping and yellow arrowheads indicate neuronal wrapping. (B) Quantification of the number of abnormal wrapping of blood vessels (blue) and neuronal soma (yellow) in a given field of view (FOV, 450 × 450 × 35 µm).
Figure 4—figure supplement 5.
Figure 4—figure supplement 5.. Loss of TDP-43 in oligodendrocytes potentially contributes to the disruption of blood-brain barrier (BBB) and de-differentiation of oligodendrocytes.
(A) Immunostaining for aquaporin four shows that EGFP+ wrapping displaces aquaporin 4 + astrocyte endfeet (yellow arrowheads). (B) Ki-67+NG2− oligodendrocytes can be found in P180 Mobp-TDP43 KO.
Figure 5.
Figure 5.. Adult loss of TDP-43 in oligodendrocytes leads to hindlimb weakness.
(A) Mobp-iCreER allows Tardbp deletion at mature oligodendrocytes in the adult CNS. Schematics of CreER activation where tamoxifen is administered for five consecutive days at P90. Samples are collected for analyses 30 and 90 days after the last day of tamoxifen injection. (B) EGFP images from Mobp-TDP43-RCE Control and cKO at 30 and 90 days after Tardbp deletion. Yellow arrowhead indicates abnormal morphological changes in cKO oligodendrocytes at P90 +90. Scale bar = 25 μm. (C) Examples of limp tail and hindlimb clasping (yellow arrowheads) in Mobp-TDP43 cKO at P90 + 90 from Video 4. (D) Mobp-TDP43 cKO mice develop hindlimb paralysis at P90 + 90 (yellow arrowhead). (E) Experimental autoimmune encephalomyelitis (EAE) clinical score for Control and Mobp-TDP43 cKO mice. All Control mice at P90 + 90 exhibit no obvious changes in motor function whereas Mobp-TDP43 cKO mice develop limp tail and hindlimb weakness, which yield clinical scores between 2 and 2.5 (unpaired, two-tailed Student’s t-test, ***p value = 0.0002, n = 3). (F) Immunostaining for GFP and GFAP in the lumbar spinal cords of Mobp-TDP43-RCE Control and cKO at P90 + 90 shows global astrogliosis indicated by increased immunoreactivity of GFAP. Scale bar = 100 μm. (G) Quantification of mean GFAP fluorescence intensity (arbitrary unit; a.u.) shows a statistically significant increase in the mean intensity of GFAP in the spinal cord of Mobp-TDP43 cKO (unpaired, two-tailed Student’s t-test, **p value = 0.0096, n = 3).
Figure 5—figure supplement 1.
Figure 5—figure supplement 1.. Loss of TDP-43 in oligodendrocytes does not result in degeneration of spinal motor neurons.
(A) ChAT immunostaining in the spinal cord to visualize motor neurons in the ventral spinal cord. (B) Quantification of the number of ChAT+ motor neurons per 35 μm section of the spinal cord (unpaired, two-tailed Student’s t-test, n = 3).
Figure 6.
Figure 6.. TDP-43 maintains oligodendrocyte transcriptional integrity by suppressing cryptic exon incorporation in key oligodendrocyte genes.
(A) Bulk RNA-Seq was performed with fluorescence-activated cell sorting (FACS)-isolated EGFP+ oligodendrocytes from P30 Mobp-TDP43-RCE and Mog-TDP43-RCE cortices. (B) Volcano plots comparing KO to Control in Mobp-TDP43 and Mog-TDP43 mouse lines showing statistically significantly differentially expressed genes (fold change >1, adjusted p value [false discovery rate, FDR] <0.05). Blue dots indicate downregulated genes whereas red dots indicate upregulated genes with TDP-43 KO. (C) Visualization of the cryptic exon located in Ermn. Gene annotation is shown on the bottom, labeling exons (thick) and introns (thin). Bulk RNA-Seq reads from Control and KO oligodendrocytes from both Mobp-TDP43 and Mog-TDP43 mouse lines are aligned to the mm10 genome. The cryptic exon in the intron 2 of Ermn is magnified to highlight the difference. (D) Reverse transcription-polymerase chain reaction (RT-PCR) validation of cryptic exon incorporation in Ermn in mouse whole brain tissue from Mog-TDP43 Control and KO. Three primers were used to identify (1) normal transcript (226 bp), (2) cryptic exon incorporated transcript (286 bp), and (3) the presence of cryptic exon (147 bp). Only the KO samples showed bands at 147 and 286 bp that represent cryptic exon incorporation into Ermn mRNA. (E) Western blotting assay to quantify the amount of Ermin protein in Mog-TDP43 Control and KO brains shows that Mog-TDP43 KO brains have a significantly decreased amount of Ermin protein (unpaired, two-tailed Student’s t-test, *p value = 0.0119, n = 4 and 3). (F) Table of genes that are misspliced in oligodendrocytes with loss of TDP-43. Cassette indicates incorporation of a nonconserved, novel cryptic exon whereas alternative splicing means usage of alternative, conserved exons. Exon extension indicates that the intronic sequence following an exon was incorporated into mature mRNA and became part of the exonic sequence.
Figure 6—figure supplement 1.
Figure 6—figure supplement 1.. The number of genes that are statistically significantly differentially expressed between different genotypes (false discovery rate FDR <0.05).
Figure 6—figure supplement 2.
Figure 6—figure supplement 2.. Gene ontology (GO) analysis from differentially expressed genes shows that Mobp-TDP43 KO and Mog-TDP43 KO show differential enrichment of biological processes.
Figure 6—figure supplement 3.
Figure 6—figure supplement 3.. Immunostaining for Ermin shows that KO oligodendrocytes have reduced cell body expression of Ermin protein compared to the Control.
Figure 6—figure supplement 4.
Figure 6—figure supplement 4.. Fragments per kilobase of exon per million mapped fragments (FPKM) of Gpr37, Mag, Gamt, and Opalin in Mobp-TDP43 Control and Mog-TDP43 Control from bulk RNA-Seq in Figure 6.
Unpaired, two-tailed Student’s t-test was used to determine statistical significance at p value <0.05.
Figure 6—figure supplement 5.
Figure 6—figure supplement 5.. Summary diagram of how TDP-43 exerts a stage-specific role in oligodendrocyte lineage cells.
Red indicates the degree of effect with the genetic loss of TDP-43. Gray bars indicate the outcomes not addressed and quantified in the conditional deletion of TDP-43 in adult oligodendrocytes.

References

    1. Almeida RG, Czopka T, ffrench-Constant C, Lyons DA. Individual Axons Regulate the Myelinating Potential of Single Oligodendrocytes in Vivo. Development. 2011;138:4443–4450. doi: 10.1242/dev.071001. - DOI - PMC - PubMed
    1. Almeida RG, Pan S, Cole KLHH, Williamson JM, Early JJ, Czopka T, Klingseisen A, Chan JR, Lyons DA. Myelination of Neuronal Cell Bodies When Myelin Supply Exceeds Axonal Demand. Current Biology. 2018;28:1296–1305. doi: 10.1016/j.cub.2018.02.068. - DOI - PMC - PubMed
    1. Bacmeister CM, Barr HJ, McClain CR, Thornton MA, Nettles D, Welle CG, Hughes EG. Motor Learning Promotes Remyelination via New and Surviving Oligodendrocytes. Nature Neuroscience. 2020;23:819–831. doi: 10.1038/s41593-020-0637-3. - DOI - PMC - PubMed
    1. Baracskay KL, Duchala CS, Miller RH, Macklin WB, Trapp BD. Oligodendrogenesis Is Differentially Regulated in Gray and White Matter of Jimpy Mice. Journal of Neuroscience Research. 2002;70:645–654. doi: 10.1002/jnr.10418. - DOI - PubMed
    1. Barreto G, Schäfer A, Marhold J, Stach D, Swaminathan SK, Handa V, Döderlein G. Gadd45a Promotes Epigenetic Gene Activation by Repair-Mediated DNA Demethylation. Nature. 2007;445:671–675. doi: 10.1038/nature05515. - DOI - PubMed

Publication types

Associated data