. 2022 Jun 2;12(6):1560-1579.
doi: 10.1158/2159-8290.CD-20-1145.

Epigenetic Activation of Plasmacytoid DCs Drives IFNAR-Dependent Therapeutic Differentiation of AML

Affiliations

Epigenetic Activation of Plasmacytoid DCs Drives IFNAR-Dependent Therapeutic Differentiation of AML

Jessica M Salmon et al. Cancer Discov. .

Abstract

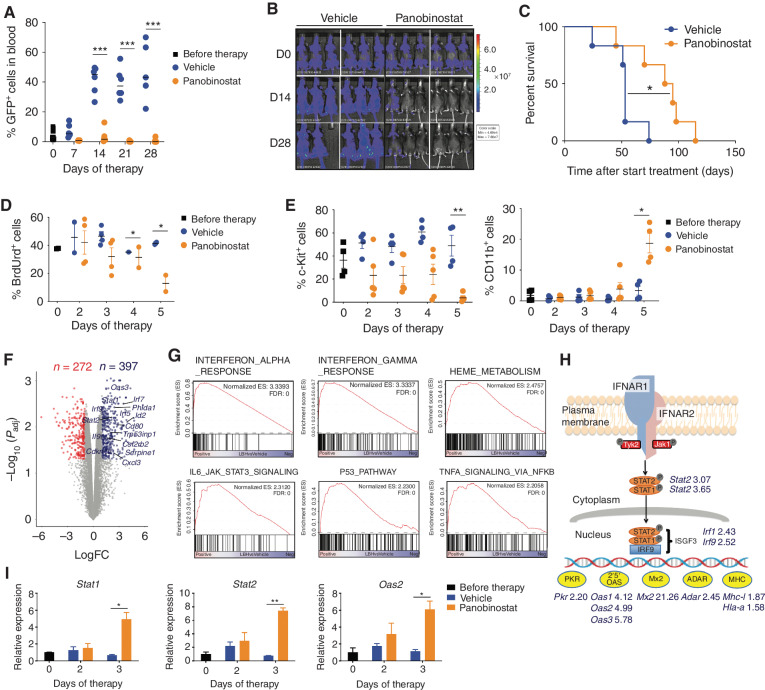
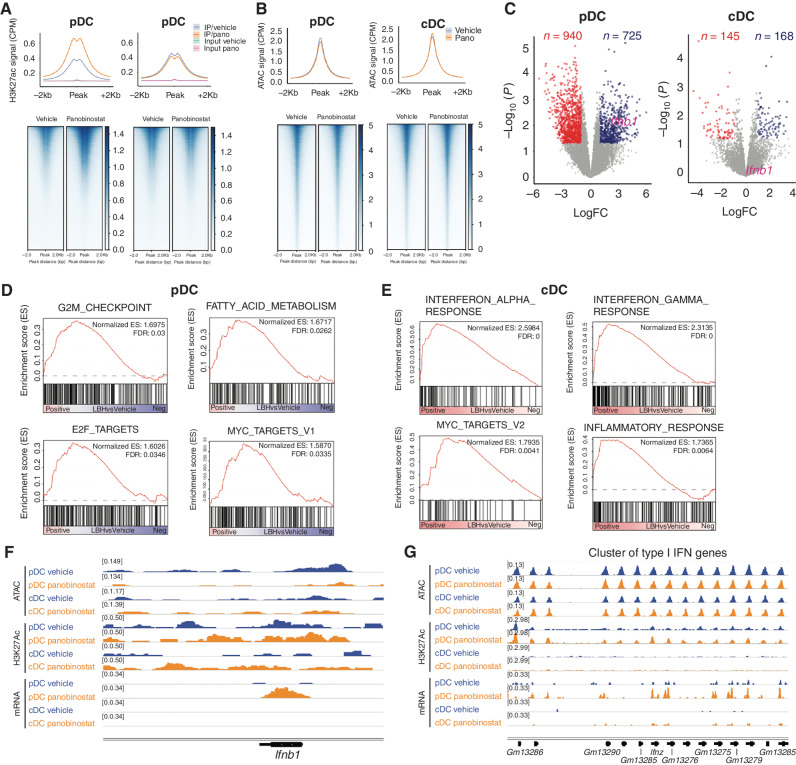
Pharmacologic inhibition of epigenetic enzymes can have therapeutic benefit against hematologic malignancies. In addition to affecting tumor cell growth and proliferation, these epigenetic agents may induce antitumor immunity. Here, we discovered a novel immunoregulatory mechanism through inhibition of histone deacetylases (HDAC). In models of acute myeloid leukemia (AML), leukemia cell differentiation and therapeutic benefit mediated by the HDAC inhibitor (HDACi) panobinostat required activation of the type I interferon (IFN) pathway. Plasmacytoid dendritic cells (pDC) produced type I IFN after panobinostat treatment, through transcriptional activation of IFN genes concomitant with increased H3K27 acetylation at these loci. Depletion of pDCs abrogated panobinostat-mediated induction of type I IFN signaling in leukemia cells and impaired therapeutic efficacy, whereas combined treatment with panobinostat and IFNα improved outcomes in preclinical models. These discoveries offer a new therapeutic approach for AML and demonstrate that epigenetic rewiring of pDCs enhances antitumor immunity, opening the possibility of exploiting this approach for immunotherapies.

Significance: We demonstrate that HDACis induce terminal differentiation of AML through epigenetic remodeling of pDCs, resulting in production of type I IFN that is important for the therapeutic effects of HDACis. The study demonstrates the important functional interplay between the immune system and leukemias in response to HDAC inhibition. This article is highlighted in the In This Issue feature, p. 1397.


Figures

Figure 1. Panobinostat induces differentiation of AML cells through activation of the type I interferon pathway. A, Percentage of GFP-positive cells in the peripheral blood of mice bearing A/E9a;NRASG12D-driven leukemias treated with vehicle or panobinostat (n = 5–6 mice/group; ***, P < 0.001). B, Bioluminescence imaging of individual tumor-bearing animals over the course of therapy with vehicle or panobinostat. C, Kaplan–Meier survival curves of mice bearing A/E9a;NRASG12D-driven leukemias treated with vehicle or panobinostat (n = 6 mice/group; *, P < 0.05). D, Cell-cycle analysis of A/E9a;NRASG12D leukemia cells within the bone marrow of animals treated with vehicle or panobinostat. The percentage of cells in S-phase (BrdUrd-positive) was determined by flow cytometry (n = 3; *, P < 0.05). E, Flow-cytometric analysis of the cell-surface expression of c-Kit and CD11b on tumor cells in the bone marrow of A/E9a;NRASG12D tumor–bearing mice treated for 5 days with vehicle or panobinostat (n = 3; *, P < 0.05; **, P < 0.005). F, Volcano plot of the DEG (logFC > 1; Padj < 0.05) between A/E9a;NRASG12D cells isolated from panobinostat-treated and vehicle-treated leukemia-bearing mice. G, GSEA of upregulated genes shown in F. H, IFNAR signaling pathway and increased fold change in individual genes induced by panobinostat treatment. I, Expression by qRT-PCR of Stat1, Stat2, and 2′5′Oas on tumor cells isolated from vehicle- and panobinostat-treated animals over 3 days of therapy (n = 3; *, P < 0.05; **, P < 0.005).
Figure 1.
Panobinostat induces differentiation of AML cells through activation of the type I interferon pathway. A, Percentage of GFP-positive cells in the peripheral blood of mice bearing A/E9a;NRASG12D-driven leukemias treated with vehicle or panobinostat (n = 5–6 mice/group; ***, P < 0.001). B, Bioluminescence imaging of individual tumor-bearing animals over the course of therapy with vehicle or panobinostat. C, Kaplan–Meier survival curves of mice bearing A/E9a;NRASG12D-driven leukemias treated with vehicle or panobinostat (n = 6 mice/group; *, P < 0.05). D, Cell-cycle analysis of A/E9a;NRASG12D leukemia cells within the bone marrow of animals treated with vehicle or panobinostat. The percentage of cells in S-phase (BrdU-positive) was determined by flow cytometry (n = 3; *, P < 0.05). E, Flow-cytometric analysis of the cell-surface expression of c-Kit and CD11b on tumor cells in the bone marrow of A/E9a;NRASG12D tumor–bearing mice treated for 5 days with vehicle or panobinostat (n = 3; *, P < 0.05; **, P < 0.005). F, Volcano plot of the DEG (logFC > 1; Padj < 0.05) between A/E9a;NRASG12D cells isolated from panobinostat-treated and vehicle-treated leukemia-bearing mice. G, GSEA of upregulated genes shown in F. H, IFNAR signaling pathway and increased fold change in individual genes induced by panobinostat treatment. I, Expression by qRT-PCR of Stat1, Stat2, and 2′5′Oas on tumor cells isolated from vehicle- and panobinostat-treated animals over 3 days of therapy (n = 3; *, P < 0.05; **, P < 0.005).
Figure 2. Expression of IFNAR on tumor cells is critical for the therapeutic efficacy of panobinostat. A, Schematic representation of the generation of A/E9a;NRASG12D;Ifnar1−/− leukemias in wild-type (WT) recipient mice. B, Kaplan–Meier survival curves of mice bearing A/E9a;NRASG12D;Ifnar1−/−–driven leukemias treated with either vehicle or panobinostat (n = 6 mice/group). C, Representative immunoblot of WT (A/E9a;NRASG12D) or IFNAR-deficient (A/E9a;NRASG12D;Ifnar1−/−) cells treated with either vehicle of panobinostat for 24 hours in vitro for the AML1–ETO9a (AE9a) fusion protein; acetylated histone 3 (AcH3); total histone 3 (H3) and α-actin as loading control (n = 3). D, Cell-cycle analysis of A/E9a;NRASG12D;Ifnar1−/− leukemia cells within the bone marrow of mice treated with vehicle or panobinostat. The percentage of cells in S-phase (BrdUrd+ cells) was determined by flow cytometry (n = 3–4; ***, P < 0.001). E, Flow cytometry analysis of the cell-surface expression of c-Kit on A/E9a;NRASG12D;Ifnar1−/− tumor cells isolated from the bone marrow of mice treated for 4 days with vehicle or panobinostat. The differential expression of c-Kit on WT (A/E9a;NRASG12D) tumor cells at day 4 is shown for comparison (n = 3 mice/timepoint; ***, P < 0.001). F, Representative images of May-Grünwald/Giemsa-stained WT (A/E9a;NRASG12D) or IFNAR-deficient (A/E9a;NRASG12D;Ifnar1−/−) tumor cells isolated from the bone marrow of mice treated with vehicle or panobinostat for 4 days. Arrows indicate condensation of nuclear chromatin and appearance of azurophilic cytoplasmic granules, indicating myeloid differentiation (600× magnification; scale bar, 10 μm; n = 3). G, Volcano plot showing DEG (logFC > 1; Padj < 0.05) between IFNAR-deficient (A/E9a;NRASG12D;Ifnar1−/−) leukemia cells isolated from panobinostat-treated and vehicle-treated leukemia-bearing mice. H, Comparison of DEG between panobinostat-treated and vehicle-treated WT (A/E9a;NRASG12D) and IFNAR-deficient (A/E9a;NRASG12D;Ifnar1−/−) tumor cells. I, GSEA of upregulated genes shown in G. J, Schematic representation of the generation of WT A/E9a;NRASG12D leukemias in Ifnar1WT or Ifnar1−/− recipient mice. K, Kaplan–Meier survival curves of Ifnar1WT or Ifnar1−/− mice bearing WT A/E9a;NRASG12D-driven leukemias treated with vehicle or panobinostat (n = 5 mice/group).
Figure 2.
Expression of IFNAR on tumor cells is critical for the therapeutic efficacy of panobinostat. A, Schematic representation of the generation of A/E9a;NRASG12D;Ifnar1−/− leukemias in wild-type (WT) recipient mice. B, Kaplan–Meier survival curves of mice bearing A/E9a;NRASG12D;Ifnar1−/−–driven leukemias treated with either vehicle or panobinostat (n = 6 mice/group). C, Representative immunoblot of WT (A/E9a;NRASG12D) or IFNAR-deficient (A/E9a;NRASG12D;Ifnar1−/−) cells treated with either vehicle of panobinostat for 24 hours in vitro for the AML1–ETO9a (AE9a) fusion protein; acetylated histone 3 (AcH3); total histone 3 (H3) and α-actin as loading control (n = 3). D, Cell-cycle analysis of A/E9a;NRASG12D;Ifnar1−/− leukemia cells within the bone marrow of mice treated with vehicle or panobinostat. The percentage of cells in S-phase (BrdU+ cells) was determined by flow cytometry (n = 3–4; ***, P < 0.001). E, Flow cytometry analysis of the cell-surface expression of c-Kit on A/E9a;NRASG12D;Ifnar1−/− tumor cells isolated from the bone marrow of mice treated for 4 days with vehicle or panobinostat. The differential expression of c-Kit on WT (A/E9a;NRASG12D) tumor cells at day 4 is shown for comparison (n = 3 mice/timepoint; ***, P < 0.001). F, Representative images of May-Grünwald/Giemsa-stained WT (A/E9a;NRASG12D) or IFNAR-deficient (A/E9a;NRASG12D;Ifnar1−/−) tumor cells isolated from the bone marrow of mice treated with vehicle or panobinostat for 4 days. Arrows indicate condensation of nuclear chromatin and appearance of azurophilic cytoplasmic granules, indicating myeloid differentiation (600× magnification; scale bar, 10 μm; n = 3). G, Volcano plot showing DEG (logFC > 1; Padj < 0.05) between IFNAR-deficient (A/E9a;NRASG12D;Ifnar1−/−) leukemia cells isolated from panobinostat-treated and vehicle-treated leukemia-bearing mice. H, Comparison of DEG between panobinostat-treated and vehicle-treated WT (A/E9a;NRASG12D) and IFNAR-deficient (A/E9a;NRASG12D;Ifnar1−/−) tumor cells. I, GSEA of upregulated genes shown in G. J, Schematic representation of the generation of WT A/E9a;NRASG12D leukemias in Ifnar1WT or Ifnar1−/− recipient mice. K, Kaplan–Meier survival curves of Ifnar1WT or Ifnar1−/− mice bearing WT A/E9a;NRASG12D-driven leukemias treated with vehicle or panobinostat (n = 5 mice/group).
Figure 3. Single-cell analysis identifies activation of the type I IFN pathway in DCs in response to panobinostat. A, Experimental set-up for CITE-seq and Cell Hashing on DC isolated from A/E9a;NRASG12D leukemia-bearing or leukemia-free mice treated with vehicle or panobinostat for 2 days. B, Annotated cell clusters based on RNA expression. C, Relative frequency of individual clusters, excluding tumor/myeloid cells. D, Percentage of pDCs (CD11cintSiglec-H+), after density gradient enrichment, in the spleen of vehicle-treated leukemia-free (n = 3 experiments) and leukemia-bearing mice (n = 6 experiments) 2 days after treatment with vehicle. In the case of leukemia-bearing mice, we also excluded GFP+ leukemia cells to calculate the percentage of pDC. E, Activity of type I IFN signature on single-cell clusters. F, AUCell enrichment score of type I IFN signature in DC subpopulations (**, P < 0.01; ***, P < 0.001).
Figure 3.
Single-cell analysis identifies activation of the type I IFN pathway in DCs in response to panobinostat. A, Experimental setup for CITE-seq and Cell Hashing on DCs isolated from A/E9a;NRASG12D leukemia-bearing or leukemia-free mice treated with vehicle or panobinostat for 2 days. B, Annotated cell clusters based on RNA expression. C, Relative frequency of individual clusters, excluding tumor/myeloid cells. D, Percentage of pDCs (CD11cintSiglec-H+), after density gradient enrichment, in the spleen of vehicle-treated leukemia-free (n = 3 experiments) and leukemia-bearing mice (n = 6 experiments) 2 days after treatment with vehicle. In the case of leukemia-bearing mice, we also excluded GFP+ leukemia cells to calculate the percentage of pDC. E, Activity of type I IFN signature on single-cell clusters. F, AUCell enrichment score of type I IFN signature in DC subpopulations (**, P < 0.01; ***, P < 0.001).
Figure 4. Type I IFN is produced by pDC within the tumor microenvironment in response to panobinostat. A, Flow cytometry gating strategy, after density gradient enrichment and exclusion of GFP+ leukemia cells, to isolate pDCs and cDCs from the spleen of mice bearing A/E9a;NRASG12D-driven leukemias. B and C, qRT-PCR of Ifnα4 and Ifnβ transcripts in pDCs (B) and cDCs (C) isolated from the spleen of mice bearing A/E9a;NRASG12D-driven leukemias treated with either vehicle or panobinostat following 5 days of therapy (*, P < 0.05; **, P < 0.01). D, qRT-PCR of Irf7 transcript in A/E9a;NRASG12D tumor cells isolated from the spleen of mice receiving IgG control or anti–PDCA-1 and treated with either vehicle or panobinostat following 3 days of therapy (**, P < 0.01). E, qRT-PCR of Ifna4 in pDCs isolated from the bone marrow of mice bearing A/E9a;NRASG12D-driven leukemias treated with either vehicle or panobinostat following 3 days of therapy (*, P < 0.05). F, qRT-PCR of Irf7 transcript in A/E9a;NRASG12D tumor cells isolated from the bone marrow of mice receiving IgG control or anti–PDCA-1 and treated with either vehicle or panobinostat following 5 days of therapy (**, P < 0.01; ***, P < 0.001). G, Percentage of tumor cells in the bone marrow of mice bearing A/E9a;NRASG12D-driven leukemias receiving IgG control or anti–PDCA-1 and treated with either vehicle or panobinostat for 5 days (**, P < 0.01; ****, P < 0.0001). H, Kaplan–Meier survival curves of mice bearing A/E9a;NRASG12D-driven leukemias receiving IgG control or anti–PDCA-1 and treated with either vehicle or panobinostat (n = 6 mice/group; *, P < 0.05).
Figure 4.
Type I IFN is produced by pDCs within the tumor microenvironment in response to panobinostat. A, Flow cytometry gating strategy, after density gradient enrichment and exclusion of GFP+ leukemia cells, to isolate pDCs and cDCs from the spleen of mice bearing A/E9a;NRASG12D-driven leukemias. B and C, qRT-PCR of Ifna4 and Ifnb1 transcripts in pDCs (B) and cDCs (C) isolated from the spleen of mice bearing A/E9a;NRASG12D-driven leukemias treated with either vehicle or panobinostat following 5 days of therapy (*, P < 0.05; **, P < 0.01). D, qRT-PCR of Irf7 transcript in A/E9a;NRASG12D tumor cells isolated from the spleen of mice receiving IgG control or anti-PDCA1 and treated with either vehicle or panobinostat following 3 days of therapy (**, P < 0.01). E, qRT-PCR of Ifna4 in pDCs isolated from the bone marrow of mice bearing A/E9a;NRASG12D-driven leukemias treated with either vehicle or panobinostat following 3 days of therapy (*, P < 0.05). F, qRT-PCR of Irf7 transcript in A/E9a;NRASG12D tumor cells isolated from the bone marrow of mice receiving IgG control or anti-PDCA1 and treated with either vehicle or panobinostat following 5 days of therapy (**, P < 0.01; ***, P < 0.001). G, Percentage of tumor cells in the bone marrow of mice bearing A/E9a;NRASG12D-driven leukemias receiving IgG control or anti-PDCA1 and treated with either vehicle or panobinostat for 5 days (**, P < 0.01; ****, P < 0.0001). H, Kaplan–Meier survival curves of mice bearing A/E9a;NRASG12D-driven leukemias receiving IgG control or anti-PDCA1 and treated with either vehicle or panobinostat (n = 6 mice/group; *, P < 0.05).
Figure 5. Panobinostat induces transcriptional activation of type I IFN genes in pDC through increased histone acetylation. A, H3K27Ac ChIP-seq on pDC and cDC isolated from A/E9a;NRASG12D leukemia-bearing mice treated with vehicle or panobinostat for 2 days. B, ATAC-seq on pDC and cDC isolated from A/E9a;NRASG12D leukemia-bearing mice treated with vehicle or panobinostat for 2 days. C, Volcano plot showing DEG (logFC > 1; P < 0.05) between panobinostat-treated and vehicle-treated pDC (left) and cDC (right) isolated from A/E9a;NRASG12D leukemia–bearing mice. D, GSEA of upregulated genes in pDC shown in C. E, GSEA of upregulated genes in cDC shown in C. F and G, Read-density tracks of normalized ATAC-seq, H3K27Ac ChIP-seq, and RNA-seq at the Ifnβ1 locus (F) and Ifnα loci (G) in pDC and cDC isolated from A/E9a;NRASG12D leukemia-bearing mice treated with vehicle or panobinostat for 2 days.
Figure 5.
Panobinostat induces transcriptional activation of type I IFN genes in pDCs through increased histone acetylation. A, H3K27Ac ChIP-seq on pDCs and cDCs isolated from A/E9a;NRASG12D leukemia-bearing mice treated with vehicle or panobinostat for 2 days. B, ATAC-seq on pDCs and cDCs isolated from A/E9a;NRASG12D leukemia-bearing mice treated with vehicle or panobinostat for 2 days. C, Volcano plot showing DEG (logFC > 1; P < 0.05) between panobinostat-treated and vehicle-treated pDCs (left) and cDCs (right) isolated from A/E9a;NRASG12D leukemia–bearing mice. D, GSEA of upregulated genes in pDCs shown in C. E, GSEA of upregulated genes in cDCs shown in C. F and G, Read-density tracks of normalized ATAC-seq, H3K27Ac ChIP-seq, and RNA-seq at the Ifnβ1 locus (F) and Ifnα loci (G) in pDCs and cDCs isolated from A/E9a;NRASG12D leukemia-bearing mice treated with vehicle or panobinostat for 2 days.
Figure 6. Panobinostat enhances the connectivity of core TFs in pDC. A, Venn diagram showing core TFs in pDC and cDC. B, Inward/outward binding plots of pDC and cDC, with highly connected core TFs highlighted. C, Clique fraction for highly connected core TFs in pDC and cDC. D, Core TFs defining cell identity for pDC, cDC1, and cDC2 based on SCENIC analysis on single-cell data. E, Venn diagram showing core TFs in panobinostat-treated and vehicle-treated pDC and cDC. F, Difference in inward/outward binding between panobinostat-treated and vehicle-treated pDC and cDC.
Figure 6.
Panobinostat enhances the connectivity of core TFs in pDCs. A, Venn diagram showing core TFs in pDCs and cDCs. B, Inward/outward binding plots of pDCs and cDCs, with highly connected core TFs highlighted. C, Clique fraction for highly connected core TFs in pDCs and cDCs. D, Core TFs defining cell identity for pDCs, cDC1, and cDC2 based on SCENIC analysis on single-cell data. E, Venn diagram showing core TFs in panobinostat-treated and vehicle-treated pDCs and cDCs. F, Difference in inward/outward binding between panobinostat-treated and vehicle-treated pDCs and cDCs.
Figure 7. Combining panobinostat and type I IFN enhances myeloid differentiation and improves therapeutic efficacy in AML. A, Flow-cytometric analysis of the cell-surface expression of CD11b on A/E9a;NRASG12D tumor cells isolated from the bone marrow of mice treated for 4 days with vehicle, rIFNα1, panobinostat, or a combination of rIFNα1 + panobinostat (n = 3). B, Kaplan–Meier survival curves of mice bearing A/E9a;NRASG12D-driven leukemias treated with vehicle, rIFNα1, panobinostat, or the combination of rIFNα1 + panobinostat (n = 11–12 mice/group; **, P < 0.005). C, Schematic representation of the t(8;21) AML PDX experiment. D, Percentage of CD11b+ HLA-DR+ tumor cells (CD45+CD3neg) in the bone marrow of t(8;21) AML xenografts treated in vivo for 14 days with vehicle, panobinostat, rIFNα2, or panobinostat + rIFNα2. Gated on live/singlets/mCD45negcells (n = 5–6; ***, P < 0.001; ***, P < 0.0001). E, Percentage of tumor cells (CD45+CD3neg) in the bone marrow of t(8;21) AML xenografts treated in vivo for 14 days with vehicle, panobinostat, rIFNα2, or panobinostat + rIFNα2. Gated on live/singlets/mCD45negcells (n = 5; *, P < 0.05; **, P < 0.01). F, Percentage of CD11b+CD34neg tumor cells (CD45+) in the bone marrow of NRASmut AML xenografts treated in vivo for 28 days with vehicle, panobinostat, rIFNα2, or panobinostat + rIFNα2 (n = 5; **, P < 0.01). Gated on viable/singlets/mCD45.1negcells. G, Percentage of donor chimerism (hCD45+/hCD45+ + mCD45.1+) in the bone marrow of NRASmut AML PDX at day 28 after treatment with vehicle, panobinostat, rIFNα2, or panobinostat + rIFNα2 (*, P < 0.05). H, Percentage of mature pDCs (CD45+Lin−CD45RA+HLA-DR+CD123+CD11c−CD11b−CD86high) in the bone marrow of NSG mice transplanted with human cord blood after 28 days treatment with panobinostat or vehicle (*, P < 0.05). Gated on live/singlets. I, Schematic model of the proposed mechanism of type I IFN expression induced by panobinostat in pDCs, leading to activation of IFNAR in AML cells, which induces their differentiation toward the myeloid lineage and subsequent cell death.
Figure 7.
Combining panobinostat and type I IFN enhances myeloid differentiation and improves therapeutic efficacy in AML. A, Flow-cytometric analysis of the cell-surface expression of CD11b on A/E9a;NRASG12D tumor cells isolated from the bone marrow of mice treated for 4 days with vehicle, rIFNα1, panobinostat, or a combination of rIFNα1 + panobinostat (n = 3). B, Kaplan–Meier survival curves of mice bearing A/E9a;NRASG12D-driven leukemias treated with vehicle, rIFNα1, panobinostat, or the combination of rIFNα1 + panobinostat (n = 11–12 mice/group; **, P < 0.005). C, Schematic representation of the t(8;21) AML PDX experiment. D, Percentage of CD11b+ HLA-DR+ tumor cells (CD45+CD3neg) at day 14 and day 28 in the bone marrow of t(8;21) AML xenografts treated in vivo for 28 days with vehicle, panobinostat, rIFNα2, or panobinostat + rIFNα2. Gated on live/singlets/mCD45negcells (n = 5–6; ***, P < 0.001; ***, P < 0.0001). E, Percentage of tumor cells (CD45+CD3neg) at days 14, 28, and 42 in the bone marrow of t(8;21) AML xenografts treated in vivo for 28 days with vehicle, panobinostat, rIFNα2, or panobinostat + rIFNα2. Gated on live/singlets/mCD45neg cells (n = 5; *, P < 0.05; **, P < 0.01). F, Percentage of CD11b+CD34neg tumor cells (CD45+) in the bone marrow of NRASmut AML xenografts treated in vivo for 28 days with vehicle, panobinostat, rIFNα2, or panobinostat + rIFNα2 (n = 5; **, P < 0.01). Gated on viable/singlets/mCD45.1neg cells. G, Percentage of donor chimerism (hCD45+/hCD45+ + mCD45.1+) in the bone marrow of NRASmut AML PDX at day 28 after treatment with vehicle, panobinostat, rIFNα2, or panobinostat + rIFNα2 (*, P < 0.05). H, Percentage of mature pDCs (CD45+LinCD45RA+HLA-DR+CD123+CD11cCD11bCD86hi) in the bone marrow of NSG mice transplanted with human cord blood after 28 days treatment with panobinostat or vehicle (*, P < 0.05). Gated on live/singlets. I, Schematic model of the proposed mechanism of type I IFN expression induced by panobinostat in pDCs, leading to activation of IFNAR in AML cells, which induces their differentiation toward the myeloid lineage and subsequent cell death.

Comment in

  • Cancer Discov. 12:1397.
  • Cancer Discov. 12:1397.

References

    1. Ustun C, Marcucci G. Emerging diagnostic and therapeutic approaches in core binding factor acute myeloid leukaemia. Curr Opin Hematol 2015;22:85–91. - PubMed
    1. Solh M, Yohe S, Weisdorf D, Ustun C. Core-binding factor acute myeloid leukemia: heterogeneity, monitoring, and therapy. Am J Hematol 2014;89:1121–31. - PubMed
    1. Frank R, Zhang J, Uchida H, Meyers S, Hiebert SW, Nimer SD. The AML1/ETO fusion protein blocks transactivation of the GM-CSF promoter by AML1B. Oncogene 1995;11:2667–74. - PubMed
    1. Liu Y, Chen W, Gaudet J, Cheney MD, Roudaia L, Cierpicki T, et al. Structural basis for recognition of SMRT/N-CoR by the MYND domain and its contribution to AML1/ETO's activity. Cancer Cell 2007;11:483–97. - PMC - PubMed
    1. Cancer Genome Atlas Research N, Ley TJ, Miller C, Ding L, Raphael BJ, Mungall AJ, et al. Genomic and epigenomic landscapes of adult de novo acute myeloid leukemia. N Engl J Med 2013;368:2059–74. - PMC - PubMed

Publication types

MeSH terms