. 2022 Mar 29;119(13):e2111533119.
doi: 10.1073/pnas.2111533119. Epub 2022 Mar 21.

Ancient and modern genomics of the Ohlone Indigenous population of California

Affiliations

Ancient and modern genomics of the Ohlone Indigenous population of California

Alissa L Severson et al. Proc Natl Acad Sci U S A. .

Abstract

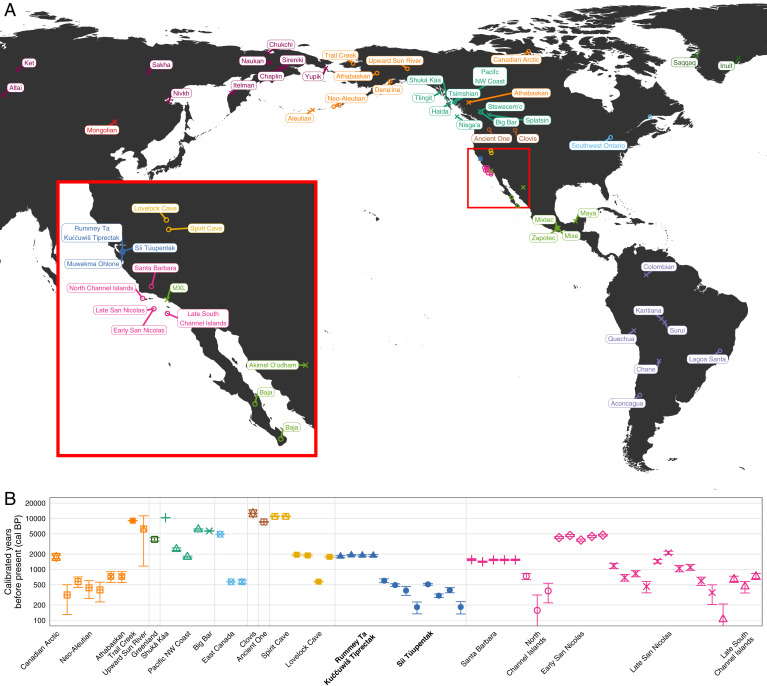
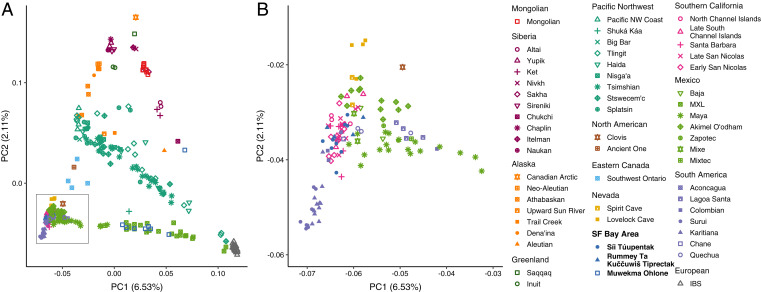
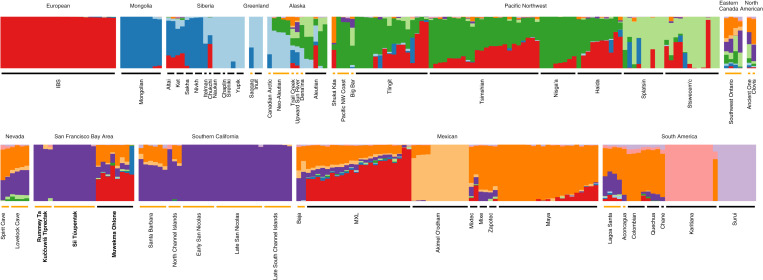
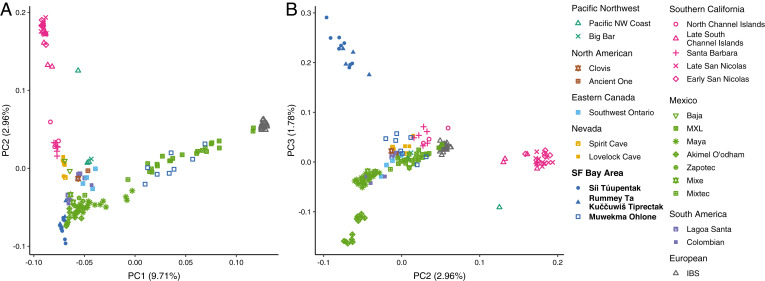
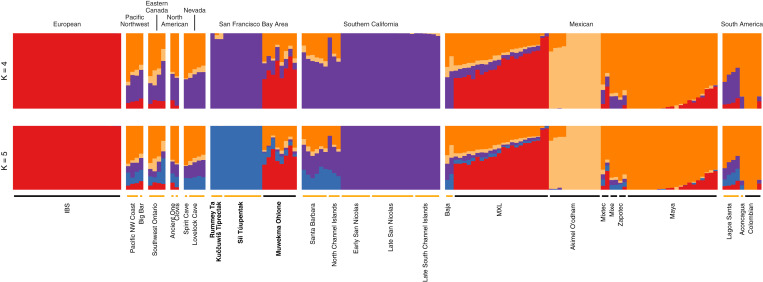
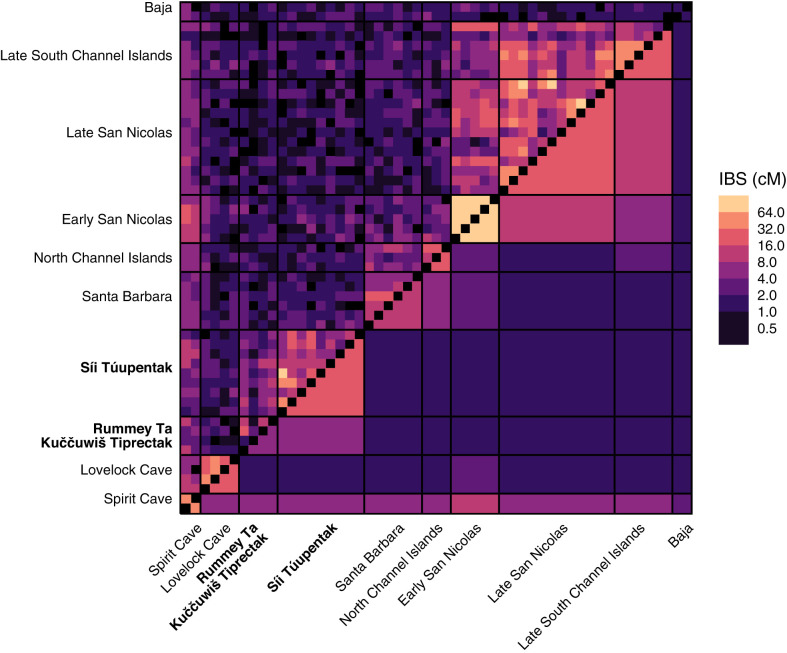
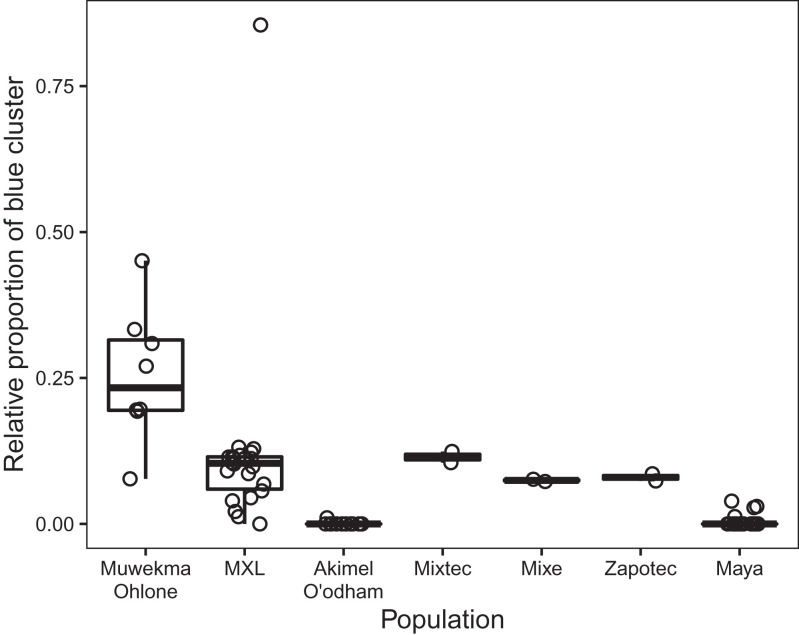
SignificanceCalifornia supports a high cultural and linguistic diversity of Indigenous peoples. In a partnership of researchers with the Muwekma Ohlone tribe, we studied genomes of eight present-day tribal members and 12 ancient individuals from two archaeological sites in the San Francisco Bay Area, spanning ∼2,000 y. We find that compared to genomes of Indigenous individuals from throughout the Americas, the 12 ancient individuals are most genetically similar to ancient individuals from Southern California, and that despite spanning a large time period, they share distinctive ancestry. This ancestry is also shared with present-day tribal members, providing evidence of genetic continuity between past and present Indigenous individuals in the region, in contrast to some popular reconstructions based on archaeological and linguistic information.

Keywords: Indigenous population genetics; Penutian hypothesis; genes and languages; identity by descent; paleogenomics.


Conflict of interest statement

The authors declare no competing interest.

Figures

Fig. 1.
Fig. 1.
Identifiers for ancient and present-day individuals used in this study. (A) Map of ancient and present-day individuals, colored by regional grouping. The inset shows the new individuals from the San Francisco Bay Area (blue) and the surrounding groups. (B) Dates of ancient individuals included in the dataset.
Fig. 2.
Fig. 2.
PCA of all ancient and present-day individuals. (A) PCA of 311 individuals in the full dataset, including 231 modern and 80 ancient individuals. (B) An enlarged view of the cluster in the Bottom Left Corner of A.
Fig. 3.
Fig. 3.
Model-based clustering of all 311 ancient and present-day individuals, with K = 10 clusters. The results represent a summary of 10 independent runs of unsupervised clustering. Each of the 10 clusters is represented by a color, and each individual is represented by a vertical bar. To aid interpretation, clustering results from a unified analysis are depicted over two rows. Ancient individuals are denoted by an orange horizontal line below the plot, and present-day individuals are denoted by a black horizontal line.
Fig. 4.
Fig. 4.
PCA of a subset of ancient and present-day individuals, considering 165 samples with ancestry relevant to newly sampled individuals from the San Francisco Bay Area. (A) PCs 1 and 2. (B) PCs 2 and 3.
Fig. 5.
Fig. 5.
Model-based clustering of a subset of ancient and present-day individuals, considering 165 samples with ancestry relevant to newly sampled individuals from the San Francisco Bay Area. Separately for K = 4 and K = 5, the results represent a summary of 10 independent runs of unsupervised clustering. Coloring is the same as described in Fig. 3.
Fig. 6.
Fig. 6.
Total pairwise IBS segment sharing for 53 ancient individuals from Nevada, California, and the Baja peninsula. The upper triangle of the matrix shows the total length of segments shared for pairs of individuals. The lower triangle shows mean pairwise values. In the triangularly shaped regions incident to the diagonal, the mean is taken across pairs within a population; rectangles off the diagonal show means across pairs, one from one population and one from another population.
Fig. 7.
Fig. 7.
Membership in the blue cluster in the K = 5 cluster analysis in Fig. 5, divided by one minus membership in the red cluster, for present-day populations from California and Mexico. For each individual, the proportion is calculated as the membership fraction in the blue cluster divided by the total fraction of membership in the blue, purple, light orange, and dark orange clusters. Individual values and boxplots are shown.

References

    1. Kroeber A. L., Handbook of the Indians of California (Smithsonian Institution, Bureau of American Ethnology Bulletin 78, 1925).
    1. Heizer R. F., Ed., California (Smithsonian Institution, 1978).
    1. Golla V., California Indian Languages (University of California Press, 2011).
    1. Kroeber A. L., Cultural and Natural Areas of Native North America (University of California Publications in American Archaeology and Ethnology, 1939).
    1. Ubelaker D. H., “North American Indian population size: Changing perspectives” in Disease and Demography in the Americas, Verano J. W., Ubelaker D. H., Eds. (Smithsonian Institution Press, 1992), pp. 169–176.

Publication types

LinkOut - more resources