

Comparison of six methods for Loa loa genomic DNA extraction
- PMID: 35312712
- PMCID: PMC8936488
- DOI: 10.1371/journal.pone.0265582
Comparison of six methods for Loa loa genomic DNA extraction
Erratum in
-
Correction: Comparison of six methods for Loa loa genomic DNA extraction.PLoS One. 2023 Sep 19;18(9):e0291986. doi: 10.1371/journal.pone.0291986. eCollection 2023. PLoS One. 2023. PMID: 37725626 Free PMC article.
Abstract
Objectives: Good-quality and sufficient DNA is essential for diagnostics and vaccine development. We aimed to compare six DNA extraction techniques applied to Loa loa microfilariae in order to evaluate the purity and integrity of extracts in terms of quality and quantity.
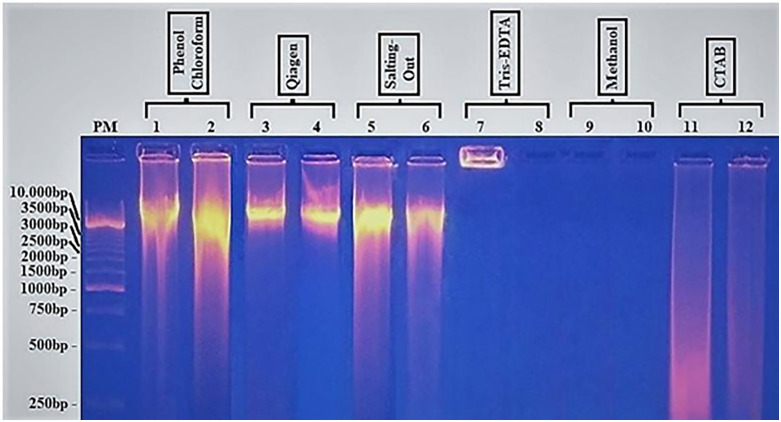
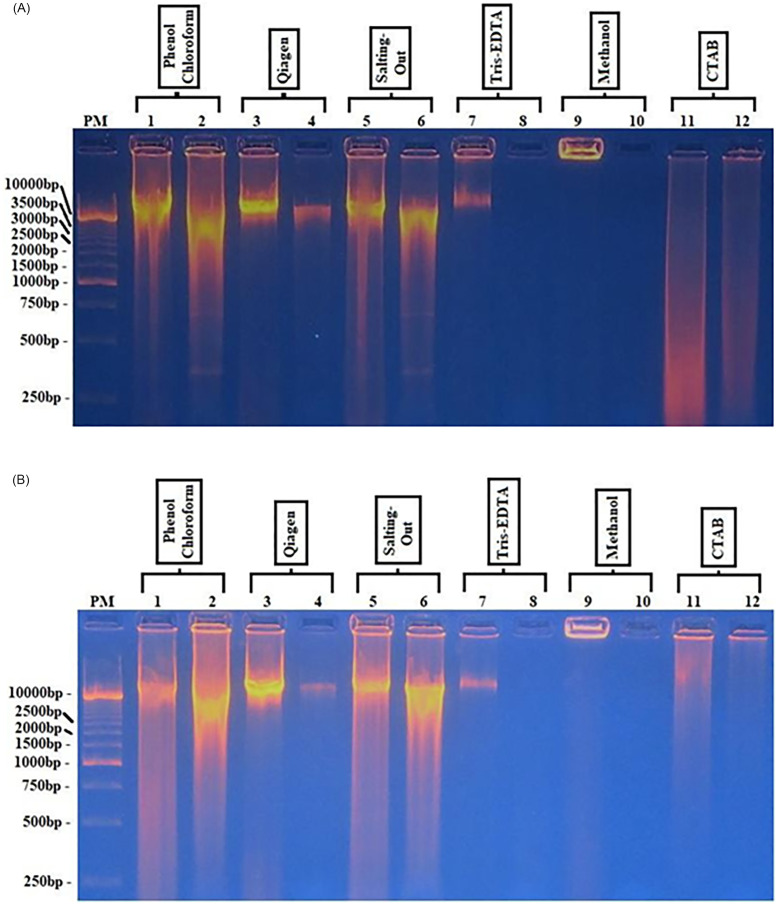
Methods: The microfilariae were purified via a Percoll gradient procedure with blood from hyper-microfilaremic individuals (> 30,000 microfilaria [mf]/ml). DNA extraction was carried out in duplicate at a rate of 350,000 mf/tube for each technique: phenol/chloroform, commercial Qiagen kit, salting out, Tris-EDTA, methanol, and cetyltrimethylammonium bromide (CTAB). The integrity, purity, concentration, and quality of the DNA extracts were successively verified by agarose gel electrophoresis, spectrophotometry (A260/A280 and A260/A230 wavelength ratio), Qubit fluorometry, and endonuclease and polymerase activity. The six techniques were compared on the basis of the following parameters: concentration, purity, efficiency, effectiveness, integrity, safety of the technique, as well as cost and duration of the protocol.
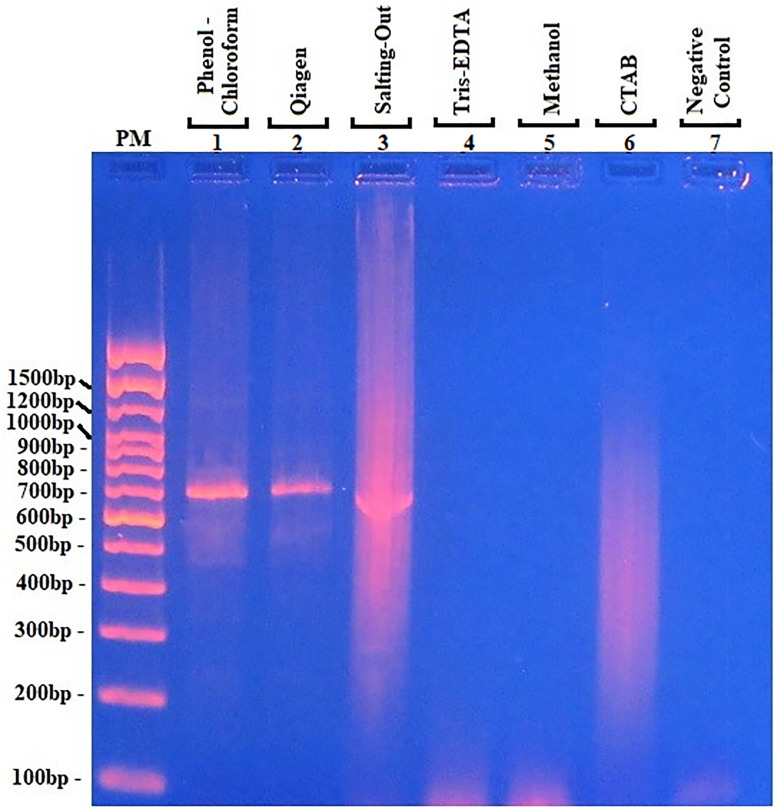
Results: The ratios of the optical densities of the extracts A260/A280 and A260/A230 were, respectively: phenol/chloroform (1.82; 1.11), Qiagen (1.93; 1.36), salting-out (1.9; 2.04), Tris-EDTA (1.99; 1.183), methanol (2.126; 1.343), and CTAB (2.01; 2.426). The DNA yield was: phenol/chloroform (3.920 μg), Qiagen (10.280 μg), salting-out (10.390 μg), Tris-EDTA (0.5528 μg), methanol (0.1036 μg), and CTAB (1.115 μg). Endonuclease and polymerase activity was demonstrated by digestion of DNA and through amplicons obtained via polymerase chain reaction assays with phenol/chloroform, Qiagen, and salting-out extracts.
Conclusion: The phenol/chloroform, Qiagen, and salting-out DNA extracts were all of good quality. Salting out had the best yield followed by Qiagen and then phenol/chloroform. Endonuclease and polymerase activity was effective in all three extracts despite the presence of some contaminants. These methods are therefore suitable for the extraction of DNA from Loa loa microfilariae. Tris-EDTA and methanol did not show adequate sensitivity, while CTAB was found to be unsuitable.
Conflict of interest statement
The authors have declared that no competing interestq exist.
Figures
Similar articles
-
Qualification study of two genomic DNA extraction methods in different clinical samples.Tanaffos. 2014;13(4):41-7. Tanaffos. 2014. PMID: 25852760 Free PMC article.
-
A comparative evaluation of four DNA extraction protocols from whole blood sample.Cell Mol Biol (Noisy-le-grand). 2016 Mar 31;62(3):120-4. Cell Mol Biol (Noisy-le-grand). 2016. PMID: 27064884
-
Evaluating genomic DNA extraction methods from human whole blood using endpoint and real-time PCR assays.Mol Biol Rep. 2017 Feb;44(1):97-108. doi: 10.1007/s11033-016-4085-9. Epub 2016 Sep 29. Mol Biol Rep. 2017. PMID: 27686559
-
Robust comparative performance of genomic DNA extraction methods from non-engorged phlebotomine sandflies.Med Vet Entomol. 2022 Jun;36(2):203-211. doi: 10.1111/mve.12567. Epub 2022 Mar 1. Med Vet Entomol. 2022. PMID: 35229900
-
[Research advances on DNA extraction methods from peripheral blood mononuclear cells].Zhongguo Shi Yan Xue Ye Xue Za Zhi. 2014 Oct;22(5):1495-8. doi: 10.7534/j.issn.1009-2137.2014.05.060. Zhongguo Shi Yan Xue Ye Xue Za Zhi. 2014. PMID: 25338615 Review. Chinese.
Cited by
-
pH-Sensitive oligopeptide magnetic mesoporous silica beads for deoxyribonucleic acid extraction.Nanoscale Adv. 2025 Jan 21;7(6):1663-1670. doi: 10.1039/d4na00987h. eCollection 2025 Mar 11. Nanoscale Adv. 2025. PMID: 39898280 Free PMC article.
-
Correction: Comparison of six methods for Loa loa genomic DNA extraction.PLoS One. 2023 Sep 19;18(9):e0291986. doi: 10.1371/journal.pone.0291986. eCollection 2023. PLoS One. 2023. PMID: 37725626 Free PMC article.
-
Optimizing a modified cetyltrimethylammonium bromide protocol for fungal DNA extraction: Insights from multilocus gene amplification.Open Life Sci. 2025 Feb 3;20(1):20221006. doi: 10.1515/biol-2022-1006. eCollection 2025. Open Life Sci. 2025. PMID: 39926474 Free PMC article.
-
Expression of BSN314 lysozyme genes in Escherichia coli BL21: a study to demonstrate microbicidal and disintegarting potential of the cloned lysozyme.Braz J Microbiol. 2024 Mar;55(1):215-233. doi: 10.1007/s42770-023-01219-4. Epub 2023 Dec 26. Braz J Microbiol. 2024. PMID: 38146050 Free PMC article.
References
-
- Van Hoegaerden M, Chabaud B, Akue JP, Ivanoff B. Filariasis due to Loa loa and Mansonella perstans: distribution in the region of Okondja, Haut-Ogooué Province, Gabon, with parasitological and serological follow-up over one year. Trans R Soc Trop Med Hyg. 1987; 81(3):441–446. doi: 10.1016/0035-9203(87)90163-5 - DOI - PubMed
MeSH terms
Substances
LinkOut - more resources
Full Text Sources
